
6. CO2 Capture from SMR type flue gas using CESAR1 solvent at Technology Centre Mongstad (2022)
Sundus Akhtera*, Ahmad Wakaaa, Anette Knarvika,b, Erik Gjernesc, Ida M. Bernhardsenb, Muhammad I. Shaha,c
aTechnology Centre Mongstad, 5954 Mongstad, Norway
bEquinor ASA, PO Box 8500, 4035 Stavanger, Norway
cGassnova SF, Dokkvegen 11, 3920 Porsgrunn, Norway
Abstract
The Technology Centre Mongstad (TCM DA) in Norway has investigated the CO2 capture performance with the non-proprietary CESAR1 solvent for flue gases with CO2 concentration like that of a SMR (steam methane reforming) furnace. The basis for this investigation is Equinor’s SMR unit at Tjeldbergodden methanol plant. Specific reboiler duty (SRD) is reported for 90% CO2 capture from flue gases with 10 and 15 vol% (dry) CO2 content when using 12 and 18 m absorber packing height. Tests at 10 vol% (dry) CO2 content confirmed that SRD levels below 4 GJ/ton CO2 are achievable with only 12 m absorber packing height, but lower SRD values are achieved with 18 m absorber packing height. This illustrates that a more compact absorber will give lower CAPEX at the expense of a higher heat requirement for the CO2 stripper. During the tests, precipitation was observed in the absorber packing despite that the overall absorber condition were unfavorable for this to occur. Also, foaming in stripper was observed and mitigated by the use of anti-foam.
1. Introduction
The Technology Centre Mongstad (TCM DA), established in 2012, is one of the world’s largest facilities to test, verify and demonstrate different post combustion carbon dioxide capture (PCC) technologies. The company is a joint venture between Gassnova (the Norwegian state), Equinor, Shell and Total Energies with a common vision to facilitate development of carbon capture and storage (CCS) for the wide deployment of large-scale carbon capture technologies across industries. The facility is located next to the Equinor refinery in Mongstad providing two types of flue gas sources: (1) combined cycle gas turbine (CCGT) based heat and power plant flue gas (CHP) and (2) residual fluid catalytic cracker (RFCC) flue gas. The different flue gas sources enable TCM to mimic flue gases from different industries such as waste incineration, gas processing, steam reforming and oil refining.
Since the start-up in 2012, TCM has gained valuable knowledge and experience with the use of the non-proprietary solvents monoethanolamine (MEA) and CESAR1 for CO2 capture. CESAR1 is a blend of 27 wt% 2-Amino-2- methylpropanol (AMP) and 13 wt% piperazine (PZ) and is considered to be a better solvent than MEA in terms of thermal energy and stability [1,2]. CESAR1 was first tested at TCM as a part of the ALIGN-CCUS campaign in 2019 where the energy demand was found to be around 10% lower than that of 30 wt% MEA. Although the comparison is not straightforward, the tests provided valuable learnings with this solvent [3,4]. To further explore the solvent’s potential, the owners of TCM DA performed two campaigns with CESAR1 from April to December 2020. The goal of the campaigns was to carry out long term operation with this solvent, close knowledge gaps on the solvent performance with different flue gas compositions, to understand cost reduction potential of CO2 capture with CESAR1 and perform thermal reclaiming [5] of the solvent.
This paper presents results from the part of the CESAR1 owner’s campaign which was carried out to understand the CESAR1 solvent’s potential for CO2 capture from steam methane reformer (SMR) flue gas. Steam methane reforming is a key technology for converting natural gas to synthesis gas and is the dominant technology for hydrogen production. In this work, the CO2 concentration was varied from 10 to 15 vol% (dry). The CO2 concentration of 10 vol% mimic the SMR flue gas at the Equinor methanol plant at Tjeldbergodden [6]. The methanol plant at Tjeldbergodden is the largest in Europe. It produces approximately 900,000 tonnes of methanol per year and accounts for around 25% of total European methanol production. The methanol is produced using natural gas and pure oxygen as raw material. Natural gas is converted to synthesis gas by combined reforming (i.e. steam methane reforming followed by autothermal reforming) and the resulting synthesis gas is converted to methanol. Currently, the methanol plant at Tjeldbergodden emits around 300,000 tonnes CO2 per year. As most of this CO2 is generated in the SMR furnace by combustion of fuel, there is a considerable potential for CO2 reduction. The fuel combusted in the SMR is a mixture of natural gas and purge gas from the synthesis gas, and the composition of the SMR flue gas will depend on the purge gas rate, and composition of the natural gas.
The first part of this paper presents the energy performance obtained with the CESAR1 solvent when varying the CO2 concentration, absorber packing height and flow rates, while maintaining 90% CO2 capture. The second part of the paper describes operational experiences with CESAR1 solvent at TCM.
2. Assessment of CESAR1 performance with SMR flue gas
2.1 TCM amine plant description
Figure 1 shows a simplified illustration of the TCM amine plant in CHP mode. Flue gas from the blower is conditioned and saturated with water to the required temperature (normally 20-50 °C) in the direct contact cooler (DCC). CO2 is captured in the absorber by the lean amine flowing downwards counter current with the flue gas. The depleted flue gas passes through two water wash stages before being emitted to the atmosphere. Rich amine from the absorber is pumped through the rich/lean cross plate heat exchanger to the stripper where the CO2 is released using a steam-heated reboiler. The lean amine is then pumped back to the absorber.
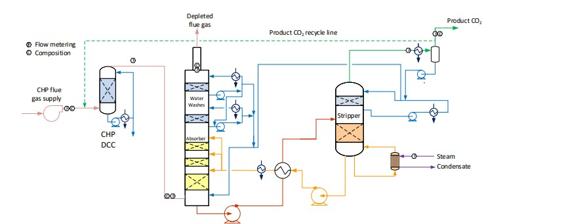
The plant is flexible and offers the possibility to test several different configurations and a wide range of flue gas flow rates and compositions. Two strippers are available with capacities up to about 3,500 and 8,000 kg CO2/h. The latter, named RFCC stripper, was in operation during the present test program. The lean amine solvent can be fed at various solvent flow rates utilizing 12, 18 or 24 m of the absorber structured packed bed (highlighted in yellow in Figure 1). The CO2 content in the flue gas can be increased by recycling captured CO2 to DCC inlet. A more detailed description of the amine plant is available elsewhere [7,8].
2.2 CESAR1 campaign mimicking SMR flue gas
The three phases A, B and C of the test program are presented in Table 1. The plant was operated to capture 90% CO2 from a flue gas with 10 to 15 vol% (dry) CO2, i.e. mimicking SMR flue gas. For each phase, the objective was to determine the optimal specific reboiler duty (SRD) by varying the solvent circulation rate.
The tests in Phase A were performed at 18 m absorber packing height to find the lowest possible SRD. In phase B, the packing height was reduced to 12 m. This was made to illustrate the consequence of utilizing a more compact absorber that reduces CAPEX at the expense of increased heat requirement and OPEX. During phase C, tests were conducted at 18 m and at a higher CO2 concentration to better understand the impact of flue gas CO2 concentration at a target capture rate of 90%. All tests were made with CHP flue gas including CO2 recycling and with the RFCC stripper in operation. CO2 recycling increased the CO2 content in the flue gas into the absorber from about 4 to 10 and 15 vol% (dry). The target CESAR1 solvent concentration during the campaign was 40 wt% comprising 27 wt% AMP and 13 wt% Piperazine. This concentration was similar as used in the previous ALIGN-CCUS campaign at TCM [4], however, variations occurred both in total amine concentration and Piperazine and AMP ratio. Calibration and validation of analysers were carried out before and during the campaign to ensure good data quality on solvent performance and compliance with emission permit.
Table 1 Operational parameters for tests mimicking SMR flue gas.
| Phase | Abs. pack height [m] | Inlet CO2 conc. [Dry vol%] | Flue gas x 1000 [Sm3/h] | Flue gas temp. [oC] | L/G [kg/Sm3] | CO2 cap. [%] | CO2 cap.1 [kg/h] |
| A | 18 | 10 | 48 | 35-37 | 1.7-2.3 | 90 | 7,560 |
| B | 12 | 10 | 48 | 38 | 1.9-3.2 | 90 | 7,500 |
| C | 18 | 15 | 34 | 40 | 2.9-3.8 | 90 | 7,940 |
1Captured CO2 for test A5, B7* and C7.
The amount of CO2 being captured can be calculated based on either the mass balance over the absorber; i.e. CO2 in versus CO2 out of the absorber or on the CO2 mass flow out of the stripper. The results presented here are based on the latter. The CO2 capture rate is then calculated as mass flow of captured CO2 versus the CO2 mass flow into the absorber. SRD is calculated based on the steam side enthalpy difference over the reboiler heat exchanger divided by the amount of captured CO2. TCM is well equipped with multiple analysers and flow meters for each of the three gas flows. The present analysis is made using the same selection of analysers and flow meters as [9].
Each test was operated up to 24 hours targeting stable operation and each of the data points presented in Figure 2 to Figure 4 represent an average over typical 2 hours of stable operation within that test interval. The data quality may be affected by steam quality and moisture in the CO2 product flow out of the stripper. For phase A and part of phase B, steam temperature into the reboiler heat exchanger was close to saturation temperature and thus introduced some uncertainty on the steam quality. It should be noted that for phase A, B and C, the measured moisture content out of the stripper fluctuated rather lively.
2.3 Results from flue gas with 10 vol% CO2
The energy required to capture 90% of the CO2 from the CHP flue gas with recycling to mimic 10 vol% SMR
furnace type of flue gas was determined during phase A and B tests.
Figure 2 (a) shows SRD at 90% capture rate for phase A tests utilising 18 m packing height. During the tests the flue gas flow rate was kept constant at 48,000 Sm3/h, while the solvent flow rate was varied. The optimum steam consumption achieved for tests A5 and A1 were approximatively the same, i.e. 3.2 GJ/ton CO2 at lowest L/G ratio around 1.9 kg/Sm3, at lean solvent flow rates 90,800 kg/h and 92,100 kg/h, respectively. Note that A1 test was conducted at 35 °C while A5 tests was carried out at 37 °C. The increase in temperature was applied to control precipitation in the absorber. As experienced from previous campaigns [4], increasing the flue gas inlet temperature has a negative effect on the SRD. However, Figure 2 (a) shows that SRD during A5 test is slightly lower than A1 test. This may be due to instability in the plant operation during A1 test and since calibration was not performed for the IR-high instrument at absorber inlet. The IR-high instrument showed higher values while the actual CO2 concentration during A1 test was 9.5 vol% (dry). Calibration was made after the A1 test and point A5 is considered as the optimum for the phase A tests. After the B series the A5 test was repeated with an SRD of 3.3 GJ/ton CO2. This illustrates reduced reproducibility due to minor changes in operational conditions etc.
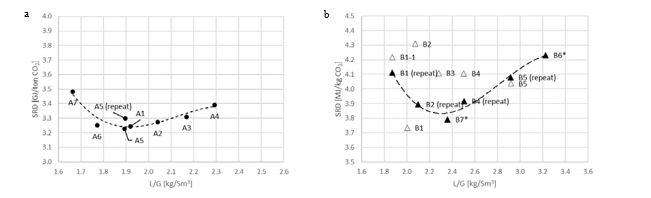
Phase B utilised 12 m absorber packing height while maintaining capture rate at 90% as well as flue gas flow at 48,000 Sm3/h. SRD plotted against L/G ratio for tests from phase B is shown in Figure 2 (b). During the B1-1 and B2 tests, there was an issue with controlling the steam temperature and pressure to the RFCC reboiler resulting in lower CO2 capture rate. In addition, precipitation was observed and there were frequent foaming issues in the stripper packing which led to a poor stripper performance. Several measures were taken such as increasing the flue gas inlet temperature from 37 °C to 38 °C, to be within the precipitation free zone, or even flushing the absorber sometimes to remove precipitation, and addition of antifoam to reverse the foaming in the stripper. Since the initial results of phase B tests were not satisfactory and the variation in the SRD values was small ranging from 4.0 to 4.3 GJ/ton CO2, phase B repeat tests were carried out including two new tests B6* and B7*. B1 in Figure 2 has a low SRD but the test was at only 85% capture rate. When considering B1 (repeat), B2 (repeat), B4 (repeat), B5 (repeat), B6* and B7* tests, the SRD values were in the range 3.8 – 4.2 GJ/ton CO2. The minimum energy penalty achieved during phase B repeat was
3.8 GJ/ton CO2 at 113,300 kg/h lean solvent circulation rate and at L/G ratio around 2.4 kg/Sm3 during B7* test. This test series has also two more test points confirming that SRD below 4 GJ/ton CO2 is achievable utilising 12 m absorber packing.
2.4 Comparison of absorber packing height
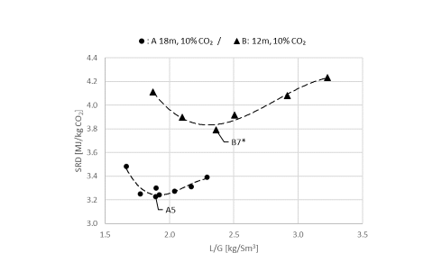
Using results from phase A and phase B, the effect of packing height on energy performance when operating with SMR type flue gas (10 vol% dry CO2) can be assessed as shown in Figure 3. Reducing the packing height from 18 to 12 m gives an increase in SRD when comparing the optimum test points, i.e. from 18 m series A5 with an SRD 3.2 GJ/ton CO2 to the 12 m series B7* with an SRD 3.8 GJ/ton CO2. There is also a corresponding increase in the optimum L/G ratio from 1.9 to 2.4 kg/Sm3. First of all, this illustrates that selecting a more compact absorber that can reduce CAPEX will have a consequence on the OPEX through increased heat requirement for the CO2 stripper as well as increased pumping power for solvent circulation. Thus, a shorter absorption column may be beneficial for installations with limited space available or if low-cost thermal energy is available.
- Results from flue gas with 15 vol% CO2
2.5Results from flue gas with 15 vol% CO2
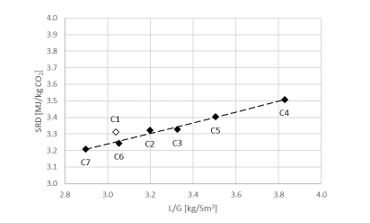
During phase C the CO2 level in the flue gas into the absorber was increased to 15 vol% (dry) and in order to be within the design of the stripper, the flue gas flow is decreased to 34,000 Sm3/h. SRD plotted against L/G ratio for tests from phase C at 18 m packing height and 90% capture rate is shown in Figure 4. The SRD values were in the range 3.2- 3.5 GJ/ton CO2. The minimum energy penalty achieved during phase C was 3.2 GJ/ton CO2 at 98,400 kg/h lean solvent circulation rate and at L/G ratio around 2.9 kg/Sm3 during C7 test. The SRD level is similar to test A5 above, however, lower L/G ratios were not explored due to time constraints so the optimal case could be even further to the left of the lowest SRD value achieved from C7 test.
3. Operational experience
3.1 Precipitation in the lower absorber packing and mitigating actions
According to TCM’s laboratory tests prior to ALIGN-CCUS campaign, CESAR1 solvent should not precipitate at planned absorber operation conditions [4]. However, at TCM precipitation has turned out to be a reoccurring issue with the CESAR1 solvent. The TCM absorber design is with rectangular cross-section and both temperature and concentrations may vary and create local conditions for CESAR1 to precipitate. Already during the ALIGN-CCUS campaign TCM gained knowledge under which conditions precipitation can occur, how to handle and dissolve precipitates.
Precipitation was most easily detected by increase in the pressure drop in the lower absorber packing. If larger amounts of solvent precipitate, it can also be noticed by significant decrease in the solvent concentration. At stable operation, without precipitation, the lower packing pressure drop is stable (+/- 0.1 mbar), and variations are mainly caused by changes in lean solvent or flue gas flow rates.
With precipitation two pressure drop profiles in absorber lower bed are observed:
- Continuous fast increase of the pressure drop (100% increase in few hours).
- Unstable and increasing or decreasing pressure drop (+/- 1 to 2 mbar) at stable absorber operation or with slight variations of operation parameters.
During normal operation without precipitation, the four temperature sensors at the same elevation at the bottom of the lower absorber packing usually indicate a deviation of +/- 5 °C, and the temperature close to the absorber wall is higher than the other locations (unless no reaction is occurring). This deviation is most likely caused by higher local CO2 loading and may indicate a poor distribution close to the walls in normal operation.
With precipitation the temperature sensors often indicate similar temperatures (+/- 1 °C in some cases). However, with high precipitation (pressure drop profile 1), flooding may occur on the whole packing area, causing a uniform temperature of the packing. Significant modification of the operation parameters or absorber flushing is required in order to control the pressure drop. In case of pressure drop profiles 2, an increase or decrease of the pressure drop is also observed at several tests at almost identical parameters, despite of better conditions for avoiding precipitation. This is likely caused by the local accumulation of precipitation close to the wall as the concrete absorber walls are not insulated and poor gas distribution is expected at the corners and walls.
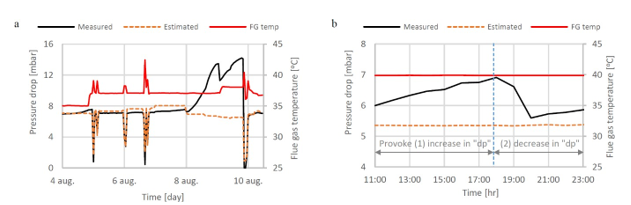
During the start of phase A at 18 m absorber packing height, 10 vol% (dry) CO2 concentration and 90% CO2 capture rate, there was a slight increase in the differential pressure in the lower absorber bed which indicated that precipitation might be occurring. This was dealt with by increasing the flue gas inlet temperature from 35 °C to 37 °C in attempt to avoid precipitation. Although a higher flue gas inlet temperature negatively impact the steam consumption, it was prioritized to run tests at higher temperatures in order to avoid precipitation. However, towards the end of phase A tests and despite the increased temperature, the pressure drop across the lower absorber packing was increased drastically from 7 to 14 mbar indicating a significant precipitation event. An absorber flushing was required to dissolve the precipitate. This was carried out by turning off the flue gas feed blower and increasing both the lean solvent flow rate and temperature. As a result of the flush test, the differential pressure in the lower absorber bed was reduced to 7 mbar indicating that the precipitate had been cleared. The measured and the calculated pressure drop during phase A testing are shown in Figure 5 (a).
During phase C tests at 18 m packing height, 15 vol% CO2 (dry) in the flue gas and 90% CO2 capture rate, the increasing differential pressure in the lower absorber packing was a recurring issue even if maintaining a high flue gas temperature of 40 °C. Therefore, two tests were dedicated to investigating further the differential pressure rise, see Figure 5 (b). The first test was run to provoke the differential pressure to be increased. During this test, the pressure drop increased from 4 mbar to 7 mbar. In the second test the water which is usually dumped to the absorber sump from the lower water wash was led to the 3rd water wash (the unused upper absorber bed) instead to see if this could affect positively on the differential pressure in the lower absorber bed (i.e. by contributing to diluting and flushing). However, the effect on the pressure drop was limited, and the differential pressure stabilized at 5.9 mbar as shown in Figure 5 (b).
3.2 Foaming evidence in the RFCC stripper during tests mimicking SMR flue gas
Analyses of the stripper temperature profiles at TCM revealed that CESAR1 solvent tends to foam, and this depends on several factors that may vary in the plant operation. At times stripper profiles show that foaming may start some hours after plant start-up, even with a fresh solvent and may be increased or decreased. Operation parameters that are suspected to cause and/or influence the formation of foam are mostly not predictable or repeatable. Among these, the high stripper temperature and consequently high evaporation rate of solvent at the bottom of the stripper packing. Other potential reasons for formation of foam could be impurities in flue gas, solvent properties, particles of solids and corrosion, and design of stripper column internals.
The main consequence of foaming observed is unstable stripper operation. Hence, foaming leads to decreased stripper efficiency and thereby not allowing to achieve optimal test conditions. As foaming has a direct impact on the regenerator performance, more steam will be needed to regenerate the solvent and achieve the target CO2 capture rate. Hence, the specific reboiler duty SRD values can increase by 0.1 GJ/ton CO2 up to 0.25 GJ/ton CO2 in the worst cases of foaming.
Foaming in the RFCC stripper was an intermittent issue throughout the test program particularly during original phase B tests at 12 m absorber packing height (see section 2.3). As the results from these tests were not promising due to several periods of high foaming or flow maldistribution, phase B tests were repeated to reverse the foaming issue by injecting a small amount of antifoam. Although foaming during phase B repeat and phase C was limited, a 2 liter of antifoam addition was able to remove the strong foaming tendency and led to lower steam requirements in the stripper reboiler and consequently lower energy numbers (SRD). However, the duration of antifoam effect is variable and could be limited to only a few hours.
Based on literature [10] excessive antifoam dosing is not recommended as its function can be reversed and be a foam promoter. Future CESAR1 tests at TCM may confirm the minimum injection rate and if lower injection rates at short intervals reduce the risk of excessive antifoam dosing. It is also recommended to minimize risks of local high gas flow or liquid flow in the stripper packing by ensuring a suitable vapor flow distribution from the stripper reboiler to the stripper packing.
Future CESAR1 tests might also consider testing the solvent at relevant temperature, pressure and packing with representative flue gas to be able to confirm the eventual impact of specific decomposition products to foaming. If foaming is caused by impurities or degradation products, then it could be possible that activated carbon bed operation and/or thermal reclaimer unit can help to reduce foaming tendency.
Conclusion
The three test series (phase A, B and C) discussed above with CESAR1 solvent showed interesting results for 90% CO2 capture from flue gases with comparable levels of CO2 to that of a SMR furnace. At 10 vol% (dry) CO2 the minimum SRD was found to be 3.2 GJ/ton CO2 when utilizing 18 m absorber packing. For the same flue gas conditions
but with absorber packing height reduced to 12 m, the minimum SRD became 3.8 GJ/ton CO2. This test series has two more test points confirming that SRD below 4 GJ/ton CO2 is achievable with only 12 m absorber packing. The 18 and 12 m cases with 10 vol% CO2 illustrate the consequence of utilizing a more compact absorber that reduces capex at the expense of increased heat requirement for the CO2 stripper. The third test series was operated at 18 m absorber packing with CO2 in flue gas increased to 15 vol% CO2 (dry). Similar SRD level as the corresponding 10 vol% CO2 case was found. However, the minimum SRD was likely not demonstrated since the point where SRD stops decreasing when decreasing L/G had not been reached.
During the test program there was precipitation in the lower absorber packing in spite of that the conditions in the absorber should not be favorable for this to occur. Precipitation was mitigated by increasing the flue gas inlet temperature and flushing of the absorber was also required. The cause may be related to the absorber design and local zones with poor gas distribution at lower temperature close to the absorber walls as well as corners. Foaming was observed in the stripper and introduced unstable stripper performance and less efficient stripping. Injection of anti- foam reduced the foaming tendency, but the effect was temporary. Better understanding of the onset of precipitation and foaming should be included in future CESAR1 tests at TCM.
The basis for this investigation is Equinor’s SMR unit at Tjeldbergodden methanol plant which is the largest methanol plant in Europe. The test campaign provides value to the industry as it helps to reduce both technical and financial uncertainty associated with CO2 capture. The campaign results give an indication on what SRD values one might expect when operating a CO2 capture plant.
Acknowledgments
The authors gratefully acknowledge the staff of TCM DA, Gassnova, Equinor, Shell and TotalEnergies for their contribution and work at the TCM DA facility. The authors also gratefully acknowledge Gassnova, Equinor, Shell, and TotalEnergies as the owners of TCM DA for their financial support and contributions.
References
- Further Assessment of Emerging CO2 Capture Technologies for the Power Sector and their Potential to Reduce Costs: IEAGHG Technical Report, 09. 2019.
- G. Wiechers, P. Moser, C. Benquet, J. Gibbons, J. Monteiro, A. Hartono, K-. A. Solli, H. Knuutila, Guidelines for effective solvent management, Deliverable Nr. D1.2.6, ALIGN-CCUS.
- Accelerating Low carbon Industrial Growth through CCUS: ALIGN-CCUS, project homepage https://www.alignccus.eu/, website accessed: 15.11.2021.
- C. Benquet, A. Knarvik, E. Gjernes, O. A. Hvidsten, E. R. Kleppe, S. Akhter, First Process Results and Operational Experience with CESAR1 Solvent at TCM with High Capture Rates (ALIGN-CCUS Project), 15th International Conference on Greenhouse Gas Control Technologies,GHGT-15, 15th-18th March 2021 Abu Dhabi, UAE. http://dx.doi.org/10.2139/ssrn.3814712
- M.Campbell, S. Akhter, A. Knarvik, M. Zeeshan, A. Wakaa, CESAR1 solvent degradation and thermal reclaiming results from TCM testing. To be presented at the GHGT-16 Conference: 23 – 27 October 2022, Lyon, France.
- Equinor onshore facilities, Tjeldbergodden industrial facility, https://www.equinor.com/energy/onshore-facilities, website accessed: 26.08.2022.
- E. Gjernes, S. Pedersen, T. Cents, G. Watson, B.F. Fostås, M.I. Shah, G. Lombardo, C. Desvignes, N.E. Flø, A.K. Morken, T. de Cazenove,L. Faramarzi, E.S. Hamborg, Results from 30 wt% MEA performance testing at the CO2 Technology Centre Mongstad, Energy Procedia, 114, 2017, 1146-1157, https://doi.org/10.1016/j.egypro.2017.03.1276
- M.I. Shah, G. Lombardo, B.F. Fostås, C. Benquet, A.K. Morken, T. de Cazenove, CO2 Capture from RFCC Flue Gas with 30w% MEA at Technology Centre Mongstad, Process Optimization and Performance Comparison, 14th Greenhouse Gas Control Technologies Conference Melbourne 21-26 October 2018 (GHGT-14), https://ssrn.com/abstract=3366149
- M.I. Shah, E. Silva, E. Gjernes, K.I. Åsen, Cost Reduction Study for MEA based CCGT Post-Combustion CO2 Capture at Technology Center Mongstad. Proceedings of the 15th Greenhouse Gas Control Technologies Conference 15-18 March 2021, Abu Dhabi, UAE. http://dx.doi.org/10.2139/ssrn.3821061
- [10]A.M. Al-Dhafeeri, H.A. Nasr-El-Din, Characteristics of high-permeability zones using core analysis, and production logging data. J Pet Sci Eng – J PET SCI Eng 2007;55:18–36. https://doi.org/10.1016/j.petrol.2006.04.019.