
1. Evaluating performance during start-up and shut down of the TCM CO2 capture facility (2022)
Mai Bui,a,b* Matthew Campbell,c Anette Beate Knarvik,c Alexander Tait,d Xiaomian Baxter,e James Bowers,e Niall Mac Dowella,b
aCentre for Environmental Policy, Imperial College London, UK
bCentre for Process Systems Engineering, Imperial College London, UK
cTechnology Centre Mongstad (TCM), Mongstad, Norway
dBP Net Zero Teesside, UK
e SSE Thermal, UK
Abstract
The value of flexible CO2 capture and storage (CCS) becomes greater with higher penetrations of intermittent renewable power (e.g., solar PV, wind). Moreover, start-up and shut-down cycles of power plants with CCS will become increasingly frequent, which could potentially increase fugitive emissions. Whilst start-up and shut down of power plants have been characterized, the effect of start-up and shut down on CCS plants is still unclear. The objective of this study is to quantify the residual CO2 emissions, energy requirements, and time requirements of start-up and shut down in amine-based CO2 capture plants. We performed a series of start-up and shut down tests in March, June and November of 2020 at the Technology Centre Mongstad (TCM) CO2 capture facility in Mongstad, Norway. These tests used CESAR-1 amine solvent (aqueous blend of AMP and PZ) to capture CO2 from flue gas (~4 mol% CO2) exiting from the natural gas-fired CCGT combined heat and power (CHP) plant. These tests provide valuable insights on key process parameters and operation strategies that could help minimise disruption (e.g., time and energy requirements) and CO2 emissions during start-up and shut down of CO2 capture plants. Performance improvement could be achieved through optimising the solvent inventory volume, the timing of stream availability, and key process parameters such as solvent CO2 loading or amine concentration.
Keywords: CO2 capture, dynamic operation, flexible operation, post-combustion capture, pilot plant, demonstration, CCGT, start-up, shut down
1. Introduction
As energy systems transition to net-zero emissions, the share of intermittent renewable energy (e.g., wind and solar power) will increase significantly. However, this presents major operational challenges in terms of balancing the electricity grid to ensure energy demands are met. Technologies that can provide flexibility to the energy system will be required, this includes technologies such as batteries, or pumped hydroelectricity storage. Thermal power plants with carbon capture and storage (CCS) will also likely have an important role in providing affordable dispatchable low carbon capacity, thus helping to maintain security of supply and enable the expansion of other low-carbon energy sources.
Whilst the value of flexible CCS has been demonstrated in a number of previous studies [1-5], work to-date focusing on start-up and shut down of CO2 capture plants has been limited [6-8], particularly with respect to the dynamic effects, e.g., timing, energy requirements and residual CO2 emissions. This is particularly important with increasing penetration of intermittent renewable energy as these start-up and shut-down cycles will become increasingly frequent, thus the potential for fugitive emissions must be quantified and minimised. Further work is therefore necessary to develop an understanding of the process dynamics during start-up and shut down in order to identify the key factors that will impact CO2 capture performance and operability.
The objective of this study was to examine the potential for performance improvements during the start-up and shut down of a CO2 capture process in a power plant. This involved conducting a series of start-up and shut down tests at the Technology Centre Mongstad (TCM) CO2 capture facility in Norway.
This paper presents a summary of some key insights from this study. For the detailed analysis and discussion of the test data from this work, interested readers can refer to the technical report published by IEAGHG [9].
2. Start-up and shut down tests at the Technology Centre Mongstad (TCM) CO2 capture plant
The TCM plant is an industrial-scale post-combustion absorption plant that is located in Mongstad, Norway, adjacent to the Equinor oil refinery. The plant uses amine-based solvents to capture CO2 from a natural gas-fired combined heat and power (CHP) plant, and it can also be configured to process a gas slipstream from the refinery residue fluid catalytic cracker (RFCC). However, this study used CESAR-1 solvent to capture CO2 from the CHP flue gas to develop an understanding around the start-up and shut down (SUSD) dynamic behaviour.
![Figure 1: Process flow diagram of the configuration used at TCM for the start-up and shut down tests. The plant captured CO2 from the combined heat and power (CHP) flue gas using CESAR-1 solvent. In this configuration, SUSD tests used 18 m of packing height, the CHP direct contact cooler and the larger stripper column (RFCC unit). Some key process control loops are shown, however, much of the P&ID detail is omitted. Figure reproduced from reference [9].](https://gassnova.no/app/uploads/sites/5/2022/04/1-45.png)
We present results from three different test campaigns carried out in March, June and November 2020. These tests
have provided valuable insights around key factors and operation strategies that could help minimise disruption and CO2 emissions during start-up and shut down of CO2 capture in a power plant.
The key factors that were investigated in this study include:
- Comparing cold start-up performance with hot start-ups to demonstrate the effect of the starting temperature.
- Combined effect of start-up and shut down on overall performance.
- Effect of using different solvent inventory volumes, 53 m3 versus 42 m3, which is significant enough to illustrate a difference in process dynamics and identify any potential benefits.
- Timing of steam availability on start-up time, different tests were conducted to show steam introduced (i) before, i.e., preheating with an auxiliary boiler, (ii) at the same time, and (iii) after the start of flue gas flow, i.e., delayed steam supply when steam extraction is unavailable.
- Effect of solvent CO2 loading on the start-up performance.
The results demonstrate the influence of these factors on the capture performance in the context of conventional hot/cold start-ups and shut down protocols, also showing the results for strategies that improve start-up and shut down performance, e.g., the effect of preheating before start-up (shown in Figure 4), lower CO2 loading and higher amine flow on hot and cold start-ups. The learnings from this study are important as they helps identify potential protocol measures which can provide substantial reductions in CO2 emissions, time requirements and energy demand for start- up and shut down protocols.
3. Results & Discussion
In this contribution, we have focused on analysing start-up and shut down separately, e.g., the yellow shaded regions in Figure 2. The tests typically begin with a cold/hot start-up, followed by a period of steady state operation before ending with a shut down. A summary of the time it takes to reach these different periods of operation is summarised in Table 1 for tests conducted in November 2020, which show the effect of solvent inventory volume and a hot start- up with delayed steam supply.
Readers can refer to the detailed report [9] for analysis of the combined start-up and shut down performance of the TCM CO2 capture plant. The report [9] also shows the effect of analysing over different start-up time periods (i.e., 82-minutes compared with 200-minutes) on the cumulative CO2 capture performance – illustrates whether start-up shut down has any impact once you consider the steady state phase of operation.
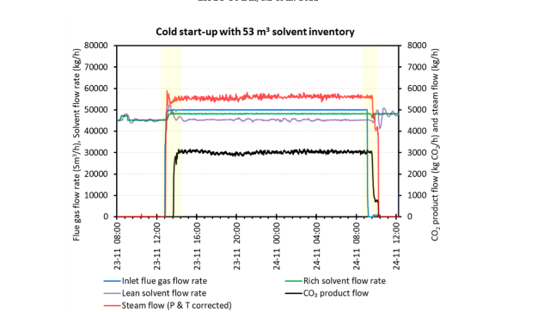
Table 1: Duration of time for start-up and shut down with different solvent inventory volumes. tSU = start-up time is the period when CO2 product flow starts; tSS = time when CO2 product flow reaches steady state; tSD = shut down time is the period between the time flue gas is turned off until steam is turned off.
| Start-up type | Conditions Start loading 0.1 mol CO2/mol amine | Start-up time: time when CO2 product flow starts, tSU (min) | Time to reach steady state, tSS (min) | Shut down time, tSD (min) |
| Cold start-up | 53 m3 solvent inventory | 47 | 82 | 61 |
| 42 m3 solvent inventory | 47 | 69 | 39 | |
| Hot start-up | 53 m3 solvent inventory | 22 | 40 | 66 |
| 42 m3 solvent inventory | 19 | 42 | 53 | |
| 42 m3 solvent inventory with delayed steam supply | 45 | 63 | – |
3.1 Effect of solvent CO2 loading on the start-up performance
To ensure the plant starts with solvent that is sufficiently low in CO2 loading, shut down continues to supply steam to the reboiler even after the flue gas was turned off to “lean out” the solvent (Figure 2). Steam is turned off once all of the solvent reaches the required target CO2 loading, which represents the end of shut down. By the end of shut down, all of the solvent will have lean loading of ≤ 0.2 mol CO2/mol amine for two reasons: (1) to prevent precipitation during plant downtime, which can occur if CESAR-1 is rich and low temperature [10-13], and (2) having lean solvent loading for the next start-up will maximise the CO2 capture capacity. Lean out for non-precipitating solvents such as 30 wt% MEA would also be beneficial for the latter reason. Due to the use of solvent with low CO2 loading (0.05– 0.11 mol CO2/mol amine) for the cold and hot start-up tests, the online CO2 capture rate is very high at 98–99% upon start-up, and is observed as soon as flue gas is introduced.
3.2 Cold start-up vs hot start-up
Cold start-ups typically take longer to reach steady state compared to hot start-ups. As the starting temperatures of cold start-up (25–30°C) is much lower than hot start-up (~90°C), cold start-ups require more time to heat the stripper/reboiler to the target temperatures. Compared to hot start-ups, cold start-ups have lower cumulative CO2 capture rates and higher specific reboiler duty. For a start-up period of 82-minutes with a 53 m3 solvent inventory, the cold start-up achieved a cumulative CO2 capture rate of 78% on an absorbed CO2 basis, whereas a hot start-up cumulatively captured 90% (Table 2).
3.3 Effect of solvent inventory volume
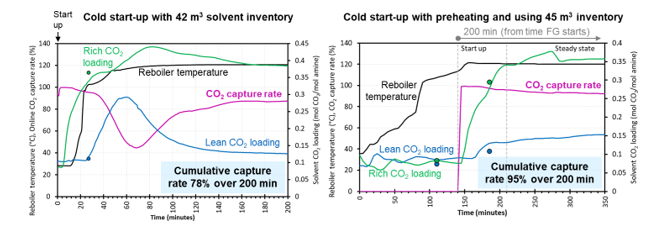
For cold start-ups, using the smaller solvent inventory (42 m3) reduced the time needed to reach steady state and slightly decreased energy requirements (Table 1). On the other hand, using a larger solvent inventory (53 m3) increased cumulative CO2 capture rates, hence reducing residual CO2 emissions. Cold start-ups benefit from using a greater solvent inventory of 53 m3 as more lean solvent is available to capture CO2 as the plant heats up. Hot start-up for the two solvent inventory cases (42 m3 vs 53 m3) achieved the same cumulative CO2 capture rates of 90% (absorbed CO2 basis) over an 82-minute time period, shown in Table 2. The cumulative specific reboiler duty based on MJ/kg absorbed CO2 is marginally greater when using the smaller inventory.
In addition to potentially decreasing solvent consumption costs when using smaller inventory systems, the findings indicate that hot start-up performance could potentially benefit from smaller solvent inventory. The smaller inventory volume reduces the solvent circulation time; thus, the effects of solvent regeneration occur on a faster time scale. Therefore, the smaller inventory generates more product CO2 (absolute terms) for a given start-up time period, resulting in a higher product basis CO2 capture rate, which in turn, reduced specific reboiler duty on a product basis (MJ/kg product CO2).
3.3 Effect of delayed steam supply
During the start-up of a power plant with CO2 capture, power generation is typically prioritised, and steam extraction is not available for a period of time. Consequently, there will be a delay in the supply of steam to the CO2 capture plant. To illustrate this effect, a hot start-up using a 42 m3 inventory with 20 minutes delayed steam supply was demonstrated. The delay in steam availability increased the time required to heat the reboiler, which results in a start- up time similar to cold start-ups (Table 1). Compared to the normal hot start-up, delaying steam supply decreased the specific reboiler duty, however, the cumulative CO2 capture rate (absorbed and product CO2 basis) also significantly reduced. To maximise the CO2 capture rates and minimise residual CO2 emissions during start-up, it is essential to make steam available to the CO2 capture plant as soon as possible (Figure 3).
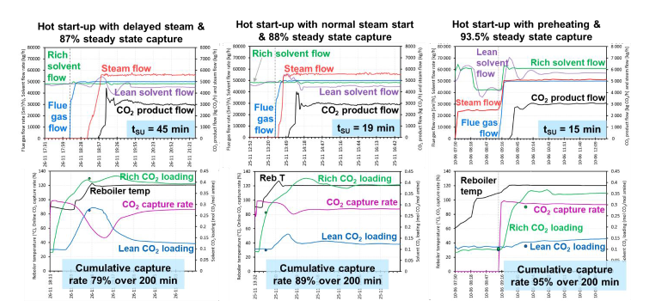
Table 2: Cumulative CO2 capture performance of 82 min start-up (SU) and shut down (SD) scenarios. Refer to Appendix A for equations.
| Product CO2 basis | Absorbed CO2 basis | |||
| 82 min start-up (SU), duration of shut down (SD) varies | Cumulative specific reboiler duty (MJ/kg CO2) | Cumulative CO2 captured (%) | Cumulative specific reboiler duty (MJ/kg CO2) | Cumulative CO2 captured (%) |
| Cold SU 53 m3 | 12.64 | 30.5 | 4.95 | 77.8 |
| Cold SU 42 m3 | 10.64 | 33.9 | 4.83 | 74.7 |
| Hot SU 53 m3 | 6.46 | 52.6 | 3.76 | 90.3 |
| Hot SU 42 m3 | 5.66 | 64.0 | 4.03 | 90.0 |
| Hot SU 42 m3 delayed steam | 5.91 | 35.4 | 2.77 | 75.3 |
| SD 53 m3 | 5.63 | 939 | 62.73 | 84.3 |
| SD 42 m3 (1) | 6.49 | 840 | 61.07 | 89.2 |
| SD 42 m3 (2) | 6.40 | 1016 | 72.84 | 89.3 |
- Effect of preheating on the start-up performance
This study compared start-ups with low preheating of steam flow rate 2500 kg/h and high preheating of steam flow 5000 kg/h. The effect of preheating is illustrated in Figure 3 for hot start-up and Figure 4 for cold start-up. Hot start- up with high preheating had the highest cumulative capture rate compared to the other tests using lower preheating steam flow. The two cold start-up tests had the same preheating steam flow, consequently, the cumulative CO2 capture rates based on absorbed CO2 were similar (97–98%). Higher preheating results in a higher cumulative capture rate on a product CO2 basis (i.e., hot start-up cases). This indicates the use of higher preheating rates before start-up allows the capture plant to reach the steady state flow of product CO2 in a shorter timeframe, making the capture plant more responsive to the requirements of the CO2 compression and transport system.
3.6 Shut down performance
The time required to shut down the CO2 capture plant is a function of the solvent inventory volume, which impacts the absolute steam energy required. Compared to the 42 m3 case (using the same amine flow rate), shut down with 53 m3 of solvent inventory required more time and steam energy on a MJ basis to lean out the larger solvent volume in the stripper section (Table 3). Moreover, shut down with 53 m3 of solvent inventory recovers more CO2 product (2274 kg CO2) compared to 42 m3 (1476–1507 kg CO2 product). As a result, the specific reboiler duty of shut down with 53 m3 of solvent is lower (5.63 MJ/kg CO2) compared to the 42 m3 case (6.40–6.49 MJ/kg CO2). As shown in Table 3, the cumulative amount of supply CO2 is very small as the flue gas flow is turned off during shut down. Subsequently, calculating the cumulative CO2 capture rate on a product CO2 basis will result in very high percentages (Table 2). Importantly, the cumulative CO2 capture rate on an absorbed CO2 basis is relatively high at 84–89%, which indicates that the residual CO2 emissions during shut down is low.
4. Conclusion
Dispatching low-carbon power into a rapidly evolving grid with increasing demands for system flexibility is of paramount importance in decarbonising electricity systems. The ability of an abated CCGT to start-up at short notice and at low cost will define its position in the merit order and therefore the overall value the asset can provide – this applies to the day ahead and intra-day (balancing mechanism) power markets along with ancillary services such as frequency response. The whole system should be designed for turn down, shut down and solvent lean out where the recovered CO2 from the solvent inventory is sent to the downstream system post power plant shutdown.
The optimal CO2 capture performance during start-up and shut down of the plant needs to balance several factors: solvent inventory volume, initial temperature (cold vs hot) and timing of steam availability (preheating vs steam & flue gas at the same time vs delayed steam). This study demonstrates that these are key factors that influence the time requirements and capture performance during start-up and shut down of a CO2 capture plant.
Using a larger solvent inventory provides the benefit of increased cumulative CO2 capture rate (i.e., Table 2). The improvement in cumulative CO2 capture is most significant for cold start-ups, whereas the solvent inventory volume has a negligible effect on hot start-ups. Compared to cold start-ups, hot start-up achieved a much higher cumulative
CO2 capture rate and lower specific reboiler duty. Due to the use of a low solvent loading (0.05–0.11 mol CO2/mol amine) for the cold and hot start-up tests, high online CO2 capture rates of 98–99% were achieved initially upon start- up, which occur immediately once flue gas is introduced to the system. The ability to sustain high CO2 capture rates during start-up depends on the volume of the solvent inventory, starting solvent CO2 loading, amine concentration and the timing of steam supply to the reboiler.
The results indicate the importance of timely steam supply upon start-up of the CO2 capture plant. Any delay in steam availability can significantly decrease the cumulative CO2 capture rate, which will increase the residual CO2 emissions. These results show that start-up with preheating is a potentially valuable approach. Under specific operating conditions, preheating can increase the cumulative CO2 capture rates during start-up of the capture plant, thereby minimising the residual CO2 emissions. To maximise the value of preheating, a higher flow rate of steam supply can heat the system much faster, but the duration of preheating needs to be optimised to minimise the steam energy demand. The CO2 emissions associated with supplying steam for preheating will depend on the source of energy used, which will have an impact on the overall CO2 capture rate. For interested readers, the effect of the CO2 intensity of steam supply is demonstrated in the technical report published by IEAGHG [9].
Appendix A: Calculating online CO2 capture rate
The proportion of CO2 absorbed from the feed flue gas is equal to one minus the ratio of the depleted flue gas CO2 concentration to the flue gas supply CO2 concentration:

Where
𝑂𝐶𝑂2 = CO2 concentration of depleted flue gas, dry basis
𝐼𝐶𝑂2 = CO2 concentration of supply flue gas, dry basis
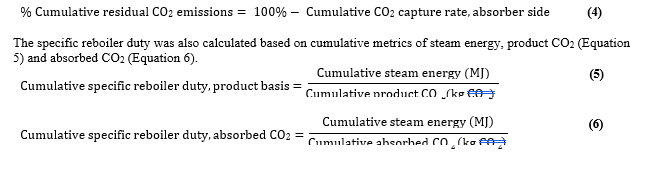
The main cumulative metrics include: (i) cumulative CO2 capture rate on a product basis, and (ii) cumulative CO2 capture rate, absorber side, (iii) cumulative specific reboiler duty (SRD) on a product basis, and (iv) cumulative specific reboiler duty on an absorbed CO2 basis.
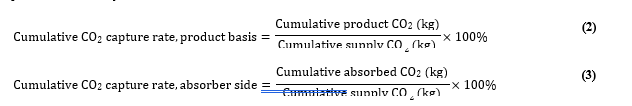
Equation 3 is the indicator for the amount of CO2 cumulatively absorbed by the solvent represented as a percentage of the total supply CO2. The cumulative absorbed CO2 is the online CO2 capture rate (Equation 1) multiplied by the supply CO2 flow rate, and is calculated cumulatively over the specified time period. The percentage of the supply CO2 that is emitted as residual emissions is Equation 4:
5. Appendix B: Shut down results from November 2020 tests
Table 3: Calculations of cumulative amounts of CO2 over the shut down period. *This shut down included an inventory volume adjustment from 53 m3 to 42 m3, consequently, less product CO2 is generated compared to SD 53 m3 (1). This case cannot be used for comparison of performance.
| Shut down case | Shut down time, tSD (min) | Cumulative amount of CO2 over time period (kg) | Steam energy (MJ) | ||||
| Supply CO2 | Product CO2 | Absorbed CO2 | Supply – Absorbed | Supply – Product | |||
| SD 53 m3 (1) | 61 | 242.2 | 2273.9 | 204.2 | 38.0 | -2031.6 | 12810.5 |
| SD 53 m3 (2) volume adjusted* | 66 | 302.5 | 2037.4 | 272.2 | 30.3 | -1734.9 | 12742.5 |
| SD 42 m3 (1) | 53 | 179.4 | 1506.8 | 160.1 | 19.3 | -1327.4 | 9778.2 |
| SD 42 m3 (2) | 39 | 145.3 | 1476.1 | 129.8 | 15.6 | -1330.8 | 9452.2 |
Acknowledgements
The authors Mai Bui and Niall Mac Dowell would like to acknowledge funding from the Research Councils UK (RCUK) under grants EP/M001369/1 (MESMERISE-CCS), EP/M015351/1 (Opening New Fuels for UK Generation), EP/N024567/1 (CCSInSupply), NE/P019900/1 (GGR Opt) and EP/T033940/1 (Multiphysics and multiscale modelling for safe and feasible CO2 capture and storage).
References
- Heuberger, C.F., I. Staffell, N. Shah, N. Mac Dowell, Quantifying the value of CCS for the future electricity system.Energy & Environmental Science, 2016. 9(8): 2497–2510.
- IEAGHG, Valuing Flexibility in CCS Power Plants, Technical Report 2017-09. 2017, International Energy Agency Greenhouse Gas R&D Programme (IEAGHG): London, United Kingdom. http://www.ieaghg.org/exco_docs/2017- 09.pdf.
- Mechleri, E., P.S. Fennell, N. Mac Dowell, Optimisation and evaluation of flexible operation strategies for coal- and gas-CCS power stations with a multi-period design approach. International Journal of Greenhouse Gas Control, 2017. 59: 24–39.
- Abdilahi, A.M., M.W. Mustafa, S.Y. Abujarad, M. Mustapha, Harnessing flexibility potential of flexible carbon capture power plants for future low carbon power systems: Review. Renewable and Sustainable Energy Reviews, 2018. 81: 3101- 3110.
- Cohen, S.M., G.T. Rochelle, M.E. Webber, Optimizing post-combustion CO2 capture in response to volatile electricity prices. International Journal of Greenhouse Gas Control, 2012. 8: 180–195.
- BEIS, Start up and shut down times of power carbon capture, usage and storage (CCUS) facilities, BEIS research paper number 2020/031. 2020, https://www.gov.uk/government/publications/start-up-and-shut-down-times-of-power-carbon- capture-usage-and-storage-ccus-facilities: Department for Business, Energy & Industrial Strategy, United Kingdom.
- Marx-Schubach, T., G. Schmitz, Modeling and simulation of the start-up process of coal fired power plants with post- combustion CO2 capture. International Journal of Greenhouse Gas Control, 2019. 87: 44–57.
- Thern, M., K. Jordal, M. Genrup. Temporary CO2 capture shut down: Implications on low pressure steam turbine design and efficiency. in 7th Trondheim Conference on CO2 capture, Transport and Storage. 2013. Trondheim, Norway: Energy Procedia.
- Bui, M., N. Mac Dowell, M. Campbell, A.B.N. Knarvik, Start-up and shutdown protocol for power stations with CO2 capture, Project IEA/CON/20/272. 2022, in press, IEAGHG: United Kingdom.
- Nwaoha, C., T. Supap, R. Idem, C. Saiwan, P. Tontiwachwuthikul, M.J. Al-Marri, A. Benamor, Advancement and new perspectives of using formulated reactive amine blends for post-combustion carbon dioxide (CO2) capture technologies. Petroleum, 2017. 3(1): 10-36.
- Benquet, C., A.B.N. Knarvik, E. Gjernes, O.A. Hvidsten, E. Romslo Kleppe, S. Akhter, First process results and operational experience with CESAR1 solvent at TCM with high capture rates (ALIGN-CCUS Project). Proceedings of the 15th Greenhouse Gas Control Technologies Conference 15-18 March 2021, 2021: Available at SSRN: http://dx.doi.org/10.2139/ssrn.3814712.
- Brúder, P., A. Grimstvedt, T. Mejdell, H.F. Svendsen, CO2 capture into aqueous solutions of piperazine activated 2- amino-2-methyl-1-propanol. Chemical Engineering Science, 2011. 66(23): 6193-6198.
- Li, H., L. Li, T. Nguyen, G.T. Rochelle, J. Chen, Characterization of piperazine/2-aminomethylpropanol for carbon dioxide capture. Energy Procedia, 2013. 37: 340–352.