
1. Assessment of Erosion-Corrosion as Possible Failure Mechanism of Reboiler at Technology Centre Mongstad (2022)
A. Palencsára,*, R. Nyborga, A. Dragesetb
aInstitute for Energy Technology, 2007 Kjeller, Norway
bTechnology Centre Mongstad (TCM), 5954 Mongstad, Norway

Abstract
During a series of test campaigns for CO2 capture using monoethanolamine (MEA) at the Technology Centre Mongstad (TCM), a failure occurred in the reboiler of the amine plant caused by severe damage to the plate heat exchanger made of AISI 316L Stainless Steel. Considerable material loss (ca. 200-250 µm reduction in thickness) including two perforations led to leakage between the solvent and heating fluid sides[1]. Preliminary investigations by TCM revealed that during a test period when oxygen scavenger was injected, a rise in the concentration of metal cations occurred; it was considered very likely that the failure was related to this “scavenger period”. A collaboration was subsequently started with the Institute for Energy Technology (IFE) to assess the failure mode of the reboiler plates. As reported earlier elsewhere[2], three plausible hypotheses were identified: the “erosion” hypothesis considers that erosion alone is sufficient to cause the failure by damaging the passive film from the stainless-steel surface and allowing corrosion attacks to develop even under normal operation conditions (or abrading the steel itself); the “erosion and enhanced corrosivity” hypothesis considers that erosion could remove passivity, but the specific chemistry in the scavenger period is also required to prevent rapid re-passivation and to sustain severe corrosion; the “enhanced corrosivity” hypothesis implies that the specific chemistry in the scavenger period can cause depassivation and sustain a considerably high corrosion rate, even in the absence of erosion. This paper presents the results of laboratory testing to validate the erosion and enhanced corrosivity hypothesis. An experimental setup based on the radial impeller concept was developed around a commercial glass autoclave. Experiments were conducted with used solvent from the TCM plant, simulating i.a. different plant conditions: anoxic rich MEA with an excess of oxygen scavenger and oxygenated rich MEA with scavenger and an excess of oxygen. Significant damage of the stainless-steel specimens occurred with erosive action in a used rich solvent with excess oxygen scavenger (i.e. anoxic conditions). The observations agree with damage of passive film, allowing activation of the corrosion process. The surface likely fails to re-passivate in an anoxic environment. The same mechanism is not sustained in an oxygenated environment where the surface can re-passivate. The results obtained suggest that the erosion and enhanced corrosivity hypothesis is valid and plausible. This mechanism may be the actual failure mode in the TCM reboiler.
1. Introduction
Technology Centre Mongstad (TCM) has been, since its completion in 2012, the world’s largest test facility for assessing CO2 capture technologies. It encompasses two plants for full-scale testing: a proprietary Chilled Ammonia Process (CAP) plant and a highly flexible amine plant. The test facility is currently owned by Gassnova, Equinor, Total and Shell.
The reboiler of the amine plant experienced a failure during a series of CO2 capture test campaigns using monoethanolamine (MEA) in 2017-2018, prompting extensive investigations to identify the failure mechanism. This paper presents the results of laboratory testing performed at IFE to verify a plausible hypothesis experimentally.
The reboiler failure occurred as some plates of the plate heat exchanger (AISI 316L Stainless Steel) were severely damaged, causing leakage between the solvent and heating fluid sides. Measurements indicated ca. 200-250 µm thickness reduction in some locations, including two perforations[1] (see Fig. 1). TCM has conducted preliminary investigations and identified that a rise in the concentration of metal cations occurred when up to 5 mass% potassium bisulfite was injected as an oxygen scavenger during the test period. it was thus considered very likely that the failure was related to this “scavenger period.” To identify the failure mode of the reboiler plates, all the relevant aspects that could be related to the failure were thoroughly reviewed and evaluated. As reported earlier elsewhere[2], three plausible hypotheses were identified:
– Erosion: This hypothesis considers that erosion is both necessary and sufficient to cause the failure, the corrosivity aspect being irrelevant for this scenario. Erosion can remove the passive film from the stainless-steel surface and even the regular operation conditions may have been corrosive enough to attack the unprotected stainless steel. In principle, erosion could be severe enough to abrade the steel as well, not only the passive film.
– Erosion and enhanced corrosivity: Erosion could remove passivity, but regular conditions would not be enough to prevent rapid repassivation to sustain corrosion. The specific chemistry in the scavenger period could sustain corrosion in the absence of a passive film but would not be able to depassivate the surface. Enhanced corrosivity could depassivate and maintain a certain corrosion rate, but not high enough to lead to rapid failure.
– Enhanced corrosivity: According to this hypothesis the specific chemistry in the scavenger period can cause depassivation and sustain a considerably high corrosion rate, probably in combination with some depassivating effect of the amine or its degradation products. The erosion aspect would be, in practice, irrelevant in the context of this scenario.
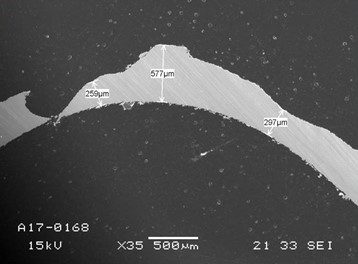
Fig. 1. Cross-section SEM image of the reboiler plate region around the leak; original thickness 600 m (reproduced with permission from Ref. [1]).
2. Preliminary modelling of the test system
The experiments were designed to be performed in a closed system (batch) rather than in flow-through mode (like the plant process) and, as such, were to represent steady-state conditions envisioned to be relevant at the site of the damage in the reboiler. To gain a better understanding of the equilibria involved and support selection of various experimental parameters, a series of scenarios have been preliminarily modelled simulating the composition and speciation as a function of temperature at a given total pressure. The calculations were performed using OLI Studio, a thermodynamic modelling software with capability to simulate redox reactions (i.e. between O2 and a scavenger). The modelled aspects have been published in detail earlier [2], only a summary is included here.
Initial loading of 30 mass% MEA (lean solvent) by continuous purging with pure CO2 at 40 °C and ambient pressure was modelled based on the forward direction of the reversible reaction (1) below, accounting also for
dissolution of CO2 into the aqueous phase.

A shown in Fig. 2a, up to an uptake of ca. 0.4 mol CO2 / mol MEA, all added CO2 is predicted to be bound by the solvent. As more CO2 gas is purged through the solvent, the bound fraction continues to increase while some of the CO2 is being retained as dissolved CO2. After ca. 0.6 mol CO2 / mol MEA has been added, the dissolved CO2 will reach saturation and all further addition will escape into the gas phase while the speciation of the solution appears to remain constant. It can be thus expected that purging test solutions with generous excess of CO2 will yield a predictable and reproducible state for the rich MEA with a constant chemical composition.
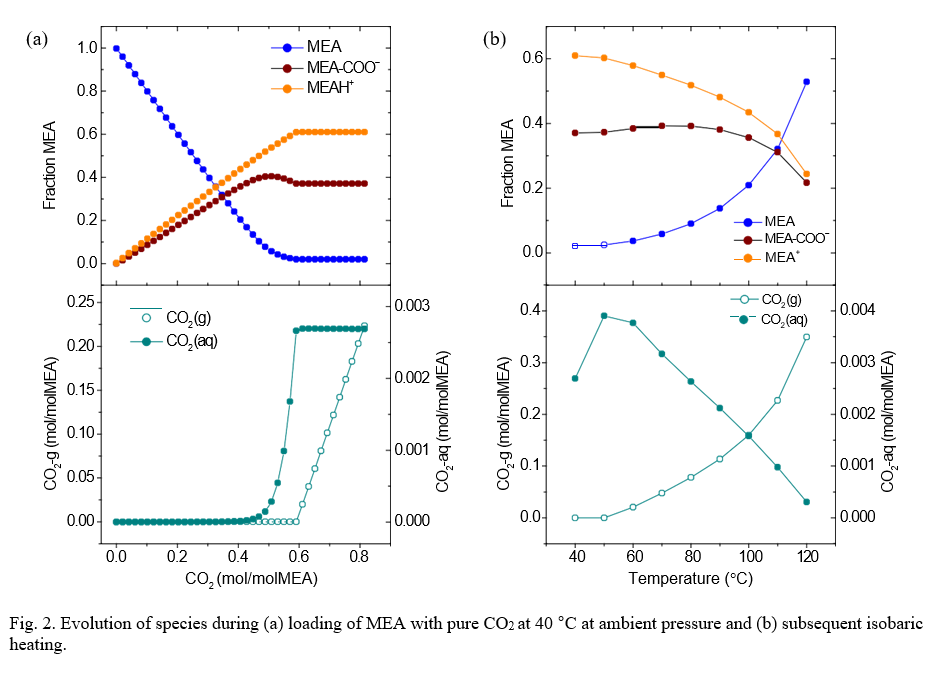
Upon heating, the composition of the rich MEA will show a transient, reaching the new equilibrium after sufficient time at the target temperature depending on the kinetics. The process was modelled starting with a fully loaded rich MEA ramping the temperature from 40 °C to 120 °C while maintaining the reactor vessel pressure at 2 bar. As shown in the right plots in Fig. 2, increasing the temperature leads to the gradual reversal of the loading process, releasing more and more CO2. For each given temperature, a new equilibrium state is reached characterized by a distinct distribution of species. Care must be taken to release the gas-phase CO2 to avoid excessive pressure buildup in the vessel. Addition of KHSO3 as oxygen scavenger is expected to affect the speciation in the solution as it will lower the pH. The reaction product KHSO4 is an acid salt, can be considered completely dissociated under the modelled conditions resulting in SO42– ions in solution, see eq. (2). Consequently, increasing concentrations of added bisulphite are expected to lower the fraction of MEA-bound CO2 at equilibrium under otherwise identical conditions. It is predicted that the equilibrium composition of the test solutions will change as a function of the added scavenger concentration for any given temperature, but without considerable practical impact on testing. It should be noted that for a given set of test conditions the composition will be different in the presence and the absence of the oxygen scavenger.

3. Experimental
3.1 Equipment
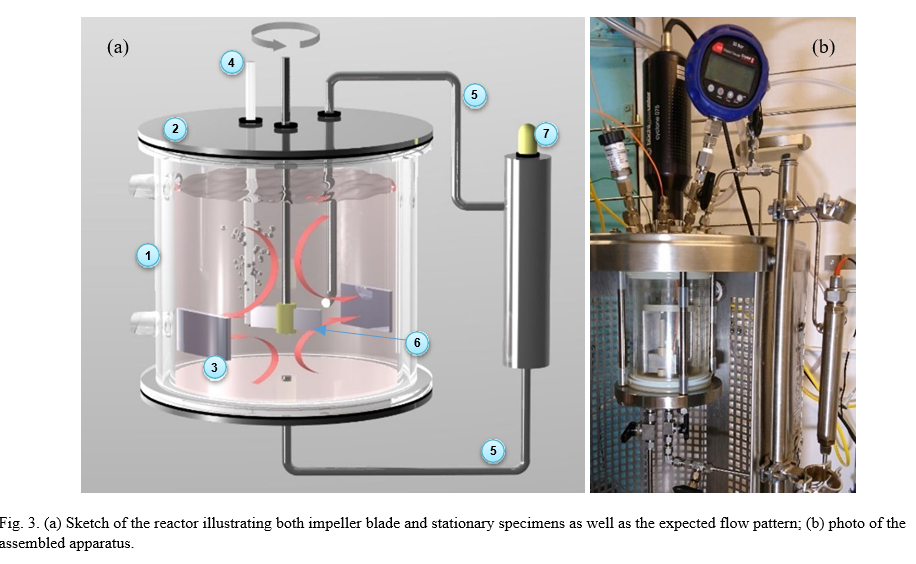
The experimental setup shown in Fig. 3, was built around a commercial glass autoclave (Buchi) optimized for erosion/corrosion studies: the apparatus allowed safe operation at the desired test conditions (up to 130 °C and 2 bara pressure) including overpressure relief, could entrain solids and keep them suspended and generate considerable shear stresses on the specimens; the flow patterns generated by the radial flow impeller design that were adequate for inducing the desired mechanical effects (with respect to flow, entrained particles and gas); allowed conditioning of test fluid (CO2 capture and release, O2 and N2 purging) and performing electrochemical and pH measurements.
The experimental chamber is a double-walled (jacketed) cylindrical glass autoclave (1) of ca. 1 liter total volume that can be heated by circulating heating medium from an external thermostated bath (not shown). Stainless steel lids (2) seal the ends and were outfitted with feedthroughs to provide the necessary inlets and outlets. The glass autoclave houses a custom-built cage that consists of two PEEK rings holding a set of four equally spaced radial baffles of stainless steel that serve as vortex-breakers (not shown for simplicity). Two sets of specimen holders are mounted on the rings allowing the placement of two diametrically opposed stationary specimens (3). The cage also provides stable positioning of the gas inlet tubing (4), the inlet for an external circulation loop (5) and the electrical connections to the stationary specimens, avoiding interference with the operation of the impeller. This arrangement allows positioning of two stationary specimens with their flat surfaces normal to the radial direction (i.e. facing impinging flow generated by the impeller), with electrical contact (stainless steel wire spring clamps) for electrochemical measurements.
The rotation assembly consists of a variable speed external Buchi rotator coupled to an internal shaft via air-tight coupling. Another specimen holder was manufactured in-house that allows rectangular specimens to be affixed to the end of the rotator shaft. This rotating specimen (6) acts as an impeller blade providing vigorous flow, shear, entrainment of suspended solids and entrainment of bubbles if desired. The rotating specimen has no electrical contact with any metallic parts. This means that undesired galvanic contacts are avoided, but electrochemical measurements cannot be performed on this specimen.
An external flow circuit (5) with a small reservoir housing a pH probe (7) was implemented to avoid damaging the pH probe at the highest test temperatures. The radial flow from the impeller impinges directly onto the inlet opening of the external flow circuit whereas the axial upwards flow from the bottom creates a sucking effect on the outlet of the external flow circuit situated centrally at the bottom of the autoclave. These two flow effects generate a continuous flow through the external circuit and chamber. A pH probe (and its internal Ag/AgCl reference electrode) can thus be used to monitor the actual solution conditions with minimal lag.
The desired gas or gas mixture was fed through a PEEK tube from central feeding lines . The gas outlet was a feedthrough on the top of the autoclave, equipped with a reflux condenser to reduce as much as possible escape of solvent vapor in high temperature tests. The outlet of the condenser was coupled to a membrane-type reductor that can be set to open at the desired overpressure. An additional relief gas outlet with manual ball-valve was also installed for rapid depressurization in case of clogging/malfunction of the reactor.
The test solution was loaded into the test chamber by a pneumatic pump through an inlet at the bottom of the autoclave.
3.2. Materials and methods
Test coupons (specimens) were cut from 2 mm thick sheets of certified 316L stainless steel. The specimens were abraded with P500 and P1000 SiC paper for uniformity, then degreased with acetone, rinsed with isopropanol, and blow dried. Between preparation and testing all specimens were allowed to rest in air overnight in a heated drying cabinet to allow ample time for spontaneous passivation of the surfaces. Used rich MEA solvent was used as provided by TCM.
At the time of the experimental work, it was not possible to purchase commercially available potassium bisulfite (KHSO3), therefore sodium bisulfite (NaHSO3) was used as oxygen scavenger. Due to the difference in molar mass caused by the different cation, the actual concentration was matched to the target concentration on molar basis as follows:
– target concentration: 5 mass% KHSO3 i.e. similar to plant conditions
– corresponds to: 0.416 mol/kg HSO3–
– corresponds to: 4.33 mass% NaHSO3
– resulting Na-content of the solution: 0.416 mol/kg (i.e. 0.96 mass%)
Commercially available fine SiO2 (Alfa Aesar, particle size range 19-37 µm) was chosen as an inert, insoluble and chemically stable abrasive material. Fine grain size was selected as it was considered more likely to be representative to solids that may form in the plant (analysis of actual solids from the plant was not available).
The electrochemical measurements were performed using a Gamry PCI4 potentiostat and a Gamry ECM8 multiplexer. The electrochemical measurements were set up in a three-electrode configuration. The stationary stainless steel specimens served as the working and counter electrodes. The Ag/AgCl electrode of a pH probe was used as the reference electrode in these measurements. The electrical connection to the specimens was provided by spring clamps manufactured of 316L wire to avoid unwanted galvanic effects.
4. Results and discussion
4.1. Electrochemical benchmark tests; behavior in MEA
One stationary specimen served as the working electrode whereas the other was used as the counter electrode in this test series. The tests were performed with used rich MEA as starting solution. The open circuit potential was monitored as the temperature was increased to 120 °C in 20 °C increments; potentiodynamic polarization measurements were performed at each temperature setting.
The open circuit potential (OCP) of the 316L stainless steel specimen recorded throughout the temperature ramping is shown in Fig. 4a. The potentiodynamic polarization measurements are marked by vertical lines in the figure (green – cathodic, orange – anodic). Black vertical lines indicate the time when the temperature setting was changed to the setpoint shown in the labels.
At the outset, in deoxygenated rich MEA at room temperature under gentle N2 bubbling the OCP was ca. -280 mV vs Ag/AgCl. As the temperature was increased the potential shifted in the negative direction in two apparent steps, stabilizing first around -475 mV vs Ag/AgCl at 60 °C and shifting in negative direction again as the temperature exceeded 80 °C.
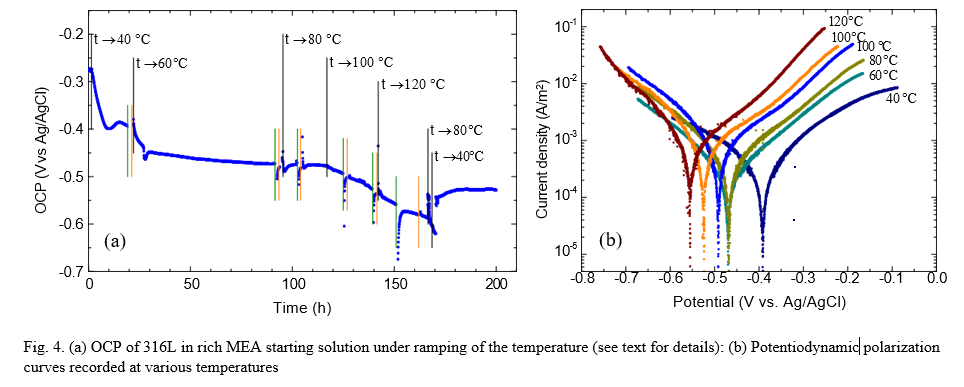
The potentiodynamic polarization curves (Fig. 4b) do not appear to have changed significantly in slope. Interestingly, up to 80 °C both the anodic and cathodic branch appears to shift towards more negative potentials (i.e., to higher current densities for the anodic branch and lower current density levels for the cathodic branch) resulting in no net change in the corrosion current density (i.e., corrosion rate). Above 80 °C, however, the anodic curves continue to shift while the cathodic lines nearly overlap, leading to a net increase of the corrosion current density and the corrosion rate (to still very low values of ca. 0.001 mm/y). It appears that the changes up to 80 °C are mechanistically different than those occurring at higher temperatures. A possible explanation (in addition to the intrinsic effect of the temperature) may be that at lower temperatures the shift in OCP may be related to dissolved CO2 (and pH), whereas at higher temperature the stripping of bound CO2 from the solvent also contributes. This is also apparent from the OCP at the end of the test being more negative than at the same temperature in the early phase, likely associated with the MEA having turned lean.
It does not appear, from the shape of the potentiodynamic polarization curves, that the state of the 316L specimen would be close or driven to potential regions associated with losing passivity or pitting. Post-exposure examination of the exposed specimens was, in this context, rather surprising: the impeller specimen (T01) and one stationary specimen (T02, used as the working electrode in the electrochemical measurements) were unaffected, still shiny without any signs of corrosion attack (see Fig. 5 for pictures showing the steel surfaces before and after exposure). The other stationary specimen, T03, however, used as counter electrode, completely lost its luster and some pitting could be observed.
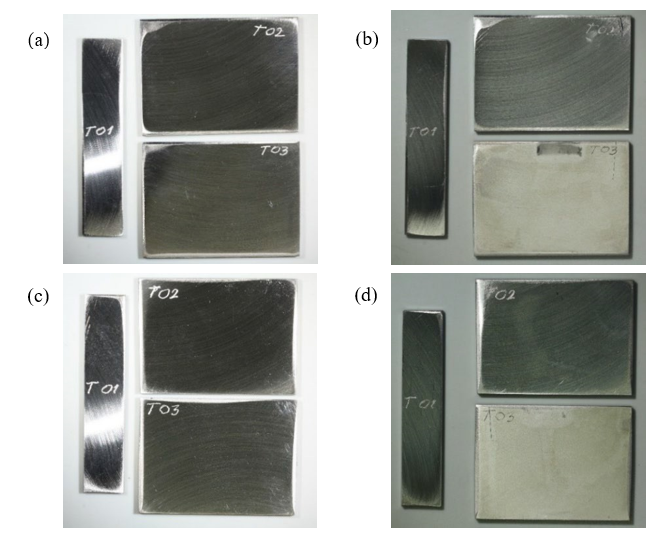
Fig. 5. Photographs of the two sides of the 316L specimens: (a) and (c) before; (b) and (d): after exposure in the electrochemical benchmarking test series.
The general corrosion affected the entire surface (i.e., both sides), but pits only developed in the central region of the side facing the impinging flow generated by the impeller. It should be noted that the specimens were also scanned with a profilometer before the exposure and were not entirely free of small pit-like defects. It appears, however that more defects/pits can be seen after the exposure (see example in Fig. 6).
Since two of the specimens (T01 and T02) were essentially unaffected by the conditions during the electrochemical benchmarking measurements or the long-term exposure, it is very likely that the electrochemical measurements have caused the observed corrosion to specimen T03. The passive layer may have been destabilized and the impinging flow may have enhanced the effect as evidenced by some pitting on the central region facing the flow. It is, however, not clear why T03 was so much more affected than T02; having been a counter electrode means that T03 was always polarized to yield the same magnitude of current with opposite sign. While the current flowing through T03 is in this fashion known, the exact potential it was polarized to in order to maintain than current is not known. It can be speculated that the potentials may not be far from those applied to the working electrode, considering that the exposed areas are essentially equal. The differences may lay in the fact that the anodic and cathodic polarization was not to the same extent on the working electrode, which means the counter electrode T03 was in fact polarized more in the cathodic (negative) direction than T02. The order of polarization may also play a role, the working electrode was exposed to the cathodic sweep first, so T03 was consequently polarized anodically first. After the first sweep some time was allowed for the working electrode to relax to close to the original OCP before the opposite scan. It is not known whether the counter electrode also relaxed to the OCP within the same time. None of these differences can at this point be confirmed as the cause of the corrosion on the counter electrode.
It is notable though that such corrosion did occur in the tested environment (without erosive particles), suggesting that destabilization of the passive layer by polarization is possible, even though in this case the potentials were far from the open circuit potential.
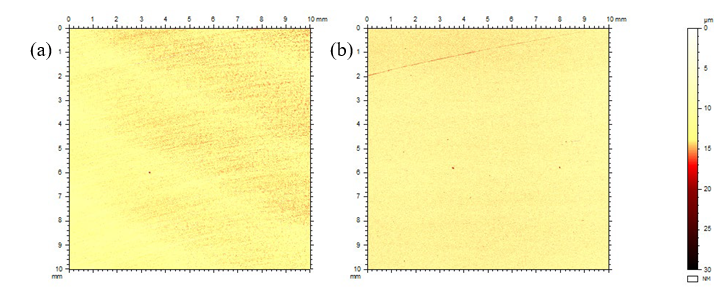
Fig. 6. Surface morphology of a small area in the center of the side facing the impinging flow of specimen T03 (counter electrode). (a) before exposure, (b) after exposure.
4.2. Erosion-corrosion in used rich MEA in the presence of NaHSO4 + NaHSO3
The test conditions were selected to simulate the chemical composition in used MEA containing added and reacted oxygen scavenger (bisulfite turned into bisulfate/sulfate) and excess oxygen scavenger (bisulfite). The test solution was based on used rich MEA as received from TCM. The pH of this stock was 8.76 at room temperature at the time the testing started.
One stationary specimen served as working electrode whereas the other was connected to the counter electrode lead. Only open circuit potential (OCP) measurements were performed in this test in order to minimize disturbances affecting the specimens. The results of the measurements are shown in Fig. 7, where vertical lines and corresponding labels indicate the various actions taken during exposure.
The starting solution was prepared by first dissolving the necessary quantity of NaHSO3 (50.13 g) into a fixed amount (1100 g) of lean solvent. Vigorous effervescence was observed upon mixing, possibly as a result of some CO2 being released. The pH decreased to 8.4, an effect in line with the expectation based on modelling.
An aliquot of 957.4 g starting solution was then loaded into the cell and purged with air for over 1.7 hours under continuous stirring to make sure the scavenger-oxygen reaction is quantitative, yielding the corresponding level of sulphate in solution according to the reaction shown in eq. (2). This step was performed at room temperature to avoid excessive evaporation and maintain a higher O2 solubility. The pH remained essentially unchanged around 8.4. The OCP in the air-saturated solution in the presence of (reacted) oxygen scavenger was in the range -170 to -180 mV vs. Ag/AgCl, i.e. around 100 mV more positive compared to the results recorded in the initial phase of the benchmark test.
Purging of the test chamber with CO2 was subsequently commenced in order to drive out excess oxygen and approach conditions similar to the cold rich solvent in the plant. Once the solvent was thoroughly purged with CO2 it is expected that only the reaction product KHSO4 was present (no reactants left). The test solution was brought to 40 °C and the pH was measured to be 8.1-8.2. The OCP displayed a monotonous shift in the negative direction. From this point on the cell was operated with little to no flow through the external loop to protect the pH electrode from the high temperatures while maintaining a conductive path for the electrochemical measurements. There were therefore no further pH readings taken from this point on.
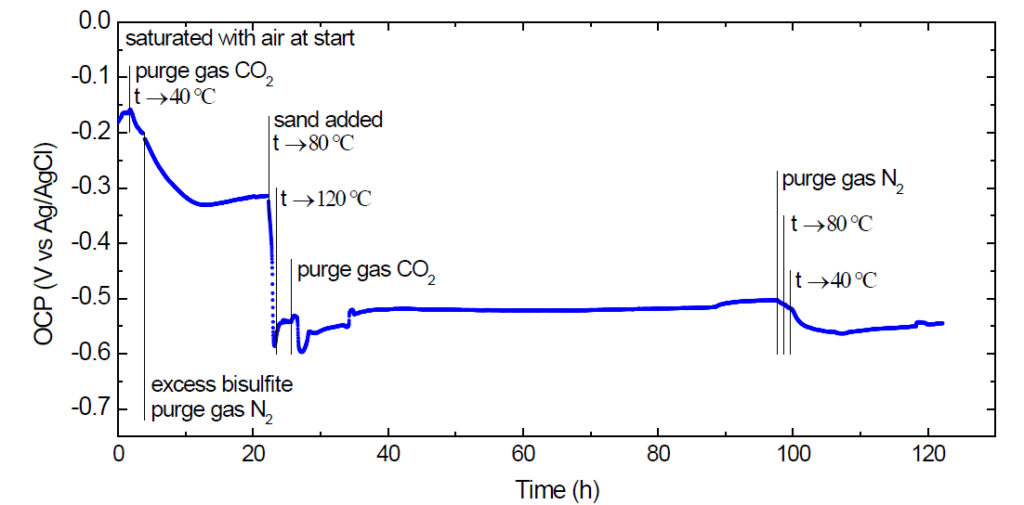
Fig. 7. OCP of 316L in rich MEA starting solution during erosion-corrosion testing at temperatures up to 120 °C.
Around the 4 hour mark the excess NaHSO3 was added to the cell (8.7 g yielding ca. 20% relative increase, corresponding to 1 mass% excess in addition to 5 mass% if it had been KHSO3). The purge gas was switched to N2 to allow the release of CO2 to proceed naturally upon subsequent increase in temperature. The OCP reached a minimum and then appeared to stabilize at ca. -315 mV vs Ag/AgCl.
After ca. 22 hours of exposure 5 g of fine sand was added into the cell and the temperature was ramped to 80 °C. As shown in Fig. 7, a rapid shift of the OCP in the negative direction started almost instantly. This can be, with good certainty, ascribed to the abrasive effect of the sand changing the state of the steel surface (and its passivating layer), since such an abrupt change is not expected solely due to increased temperature (not observed in the benchmarking test series). Further increase of the temperature to 120 °C did not bring about a further negative shift either.
After about 2 hours from setting the temperature setpoint to the target 120 °C (while still purging with N2) it was considered that the bound CO2 had been released from the solvent completely therefore the purge gas in the cell was switched to CO2 to better simulate plant conditions. In the plant the heat exchanger is continuously fed with rich solvent and the release of the bound CO2 can be considered a steady-state process in the vicinity of the hot surfaces. Purging CO2 into the cell was meant to mimic this presence of CO2 (dissolved and as bubbles) without expecting any uptake by the solvent. After a period with some variation, the OCP stabilized between -520 mV and -500 mV vs. Ag/AgCl. It is interesting to remark that the most negative potential observed after the abrasive particles were introduced was around -600 mV vs. Ag/AgCl, not very far from typical values during CO2-corrosion of carbon steel in aqueous solutions.
At the end of the test the cell was purged with N2 and cooled down. The OCP turned somewhat more negative, in other words it did not display any tendency to regain the state recorded at the start of the test.
After exposure all specimens appeared clearly affected by erosion-corrosion to varying degree, as shown in the photographs in Fig. 8. The sides of the stationary specimens facing the flow, shown in the upper right photo in the figure, seem to be more affected compared to the back sides. Areas on all specimens appear covered with a dark matte surface layer. Peculiarly, the appearance of specimen T05 (working electrode) and T06 (connected to the counter electrode lead) seem to be the inverse of each other: whereas a certain area on T05 has a dark film surrounded by shiny surface, the same region on T06 is lighter while the dark film covers the rest of the surface. These areas are likely within the zone where the impinging flow hits and has the most impact, yet it is unclear why the difference in appearance is so striking. Some dark film can also be observed on the back side of specimen T06 as well, suggesting that the erosion-corrosion affected area is not necessarily the same as the deposition/growth area of the dark corrosion product film, meaning that some transport of dissolved corrosion products must be occurring. This in turn points towards a possible mechanism involving erosion as cause of losing passivity, corrosion due to the chemical circumstances, some degree of transport of the corrosion products that precipitate/grow on areas governed by the flow patterns developing inside the cell. In addition, slight differences due to connections and electrochemical measurements may enhance or diminish the tendency to form layers.
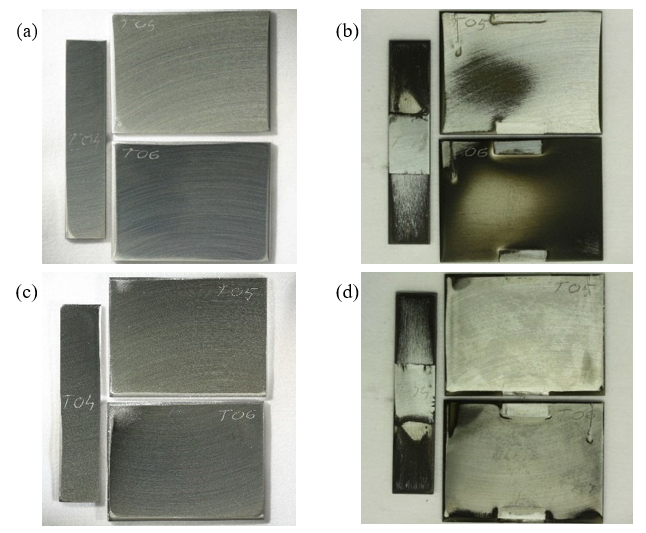
Fig. 8. Photographs of both sides of the 316L specimens: (a) and (c): before, and (b) and (d) after exposure in the erosion- corrosion test in used rich MEA in the presence of NaHSO 4 + NaHSO3
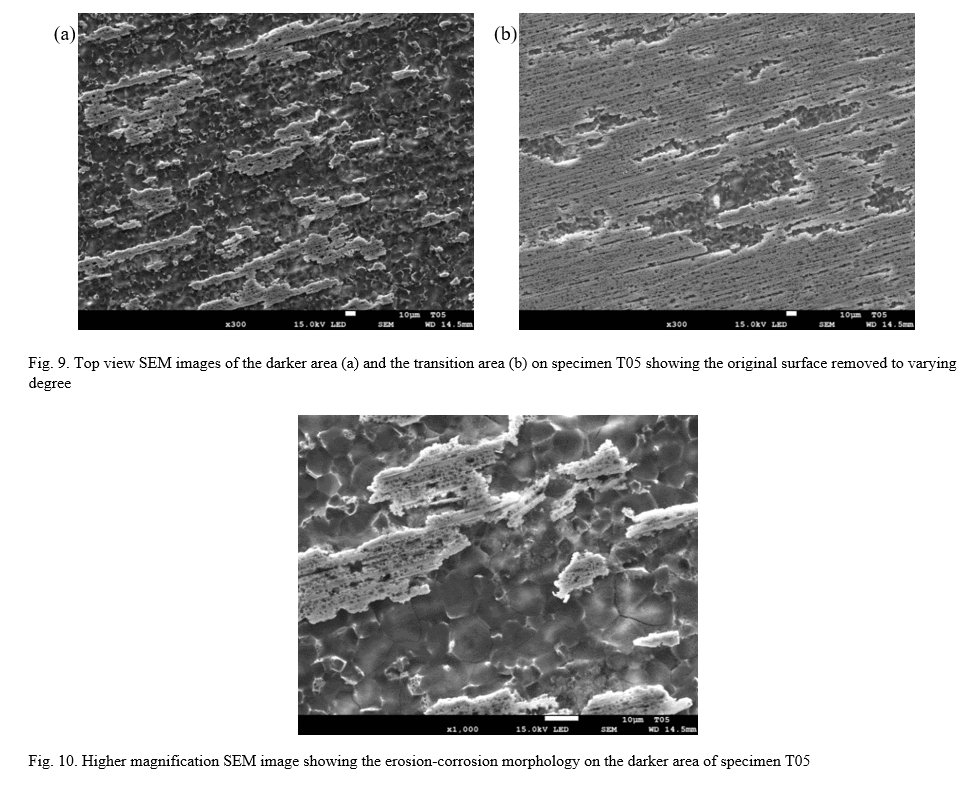
A top-view SEM image of the darker area on T05 is shown in Fig. 9a along with a transition region between the darker and shinier areas (b). It is clearly visible that the steel surface is damaged, with only small patches of what seems to be the original surface remaining on the most affected areas.
A higher magnification image shown in Fig. 10 shows more clearly the morphology of the damaged area and indicates the formation of a corrosion product film. Elemental analysis (EDS) could not reveal the exact composition of the corrosion product film due to it being very thin, allowing a large contribution to the signal from the underlying steel. Qualitatively, the darker areas (presumed covered by corrosion product film) show a clearly higher abundance of O, lower abundance of Fe and Ni, and comparable abundance of Mo. This suggests that the products are oxides, but even though they screen some of the signal from the underlying steel it is still not possible to ascertain which metal(s) are forming the oxides.
The surface of the darker area and its surroundings on specimen T05 were assessed by profilometry. As shown in Fig. 11, there is a general roughening and occasional deeper points (possibly small pits) of ca. 20-40 µm. Interestingly, this roughening effect appears to follow the original abrasion marks (compare Fig. 11 and Fig. 8), also discernible in the SEM images (Fig. 9).
Comparing the mass of the specimens before and after exposure also revealed significant material loss even without removing the corrosion products (preserved for further investigations). An erosion-corrosion rate is rather difficult to accurately evaluate because the material loss is clearly not evenly distributed over the exposed surfaces and it is uncertain over which time period the mass loss actually occurred. Nevertheless, even referenced to the entire exposed surface areas and averaged over the entire exposure time, the indicative figures obtained are still remarkably high for 316L stainless steel, i.e. 3.64 mm/y for T04 (impeller blade), 0.18 mm/y for T05 (stationary) and 0.45 mm/y for T06 (stationary).
The impeller blade specimen T04 has suffered the most severe damage. Very important to remark that this shows that flow conditions have a very large impact and that corrosion measurements are not necessarily a stimulant for the corrosion process, so experimental artifact from this point of view can be excluded.
The erosion-corrosion effect on the impeller blade specimen is not uniform either (Fig. 12). It is very interesting to observe that the most severe damage occurred on the trailing face, where a very deep attack developed near the shaft (the central, unaffected part) whereas the leading face shows a pattern in agreement with the expected flow pattern and impact of the suspended particles. This means that abrasion is not solely responsible for the damage, turbulence, eddies and possibly cavitation may also play a role enhancing the severity of the damage on the trailing face. More detailed profilometry results are shown in Fig. 13.
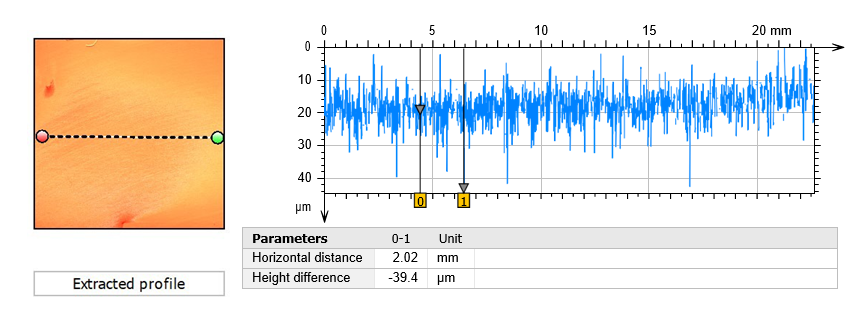
Fig. 11. Surface line profile of the darker region and its surroundings on the stationary specimen T05.
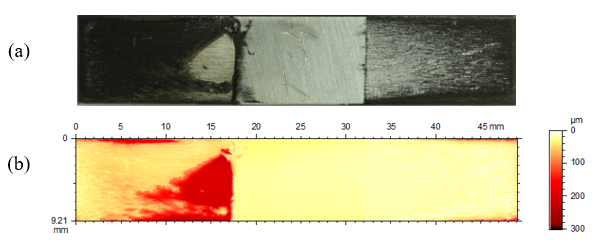
Fig. 12. Photo and surface height map of specimen T04. In this view the left side was the trailing face and the right side was the leading face during rotation.
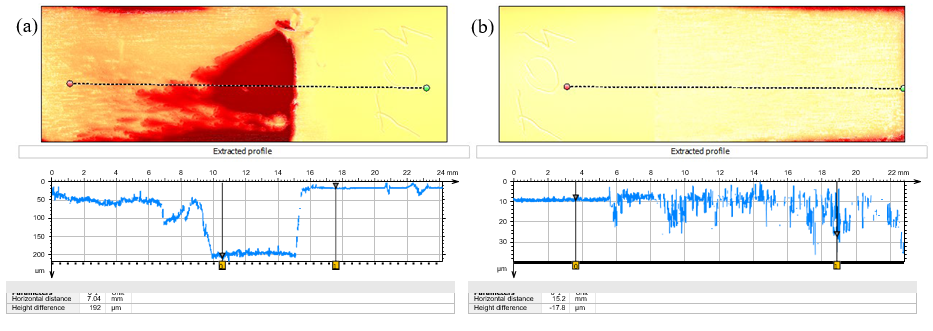
Fig. 13. Profilometry results for trailing (a) and leading (b) faces of specimen T04.
The profiles indicate that as much as nearly 200 µm of the thickness is lost in the deepest attack region, corresponding to 14.6 mm/y erosion-corrosion rate when referenced to the entire exposure time. There was comparatively much less material loss on the leading face, gradually increasing towards the end of the specimen. The difference between the corrosion morphology on the leading and trailing faces is also quite clear in the top-view SEM images (Fig. 14). The surface of specimen T06 with more abundant dark corrosion product film was analyzed using X-ray diffractometry (XRD). In addition to peaks associated with the substrate material (316L stainless steel) shown in Fig. 15a., several clear peaks were found. Identification of these peaks was not successful, as they were not found to match any obvious candidate in the available database.
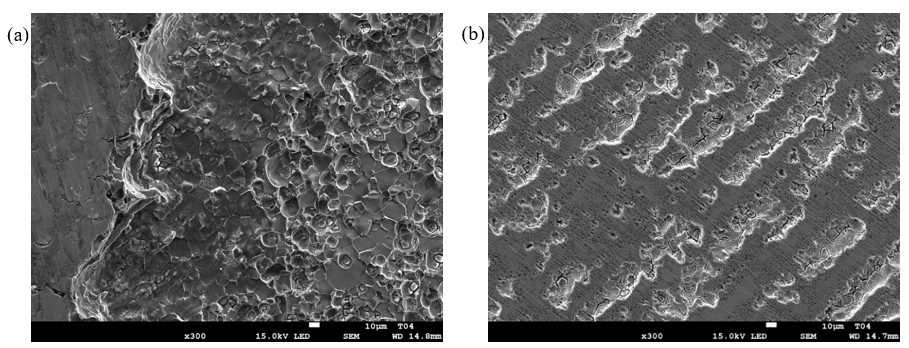
Fig. 14. Top view SEM images from the trailing face (a) and the leading face (b) of the impeller blade specimen T04.
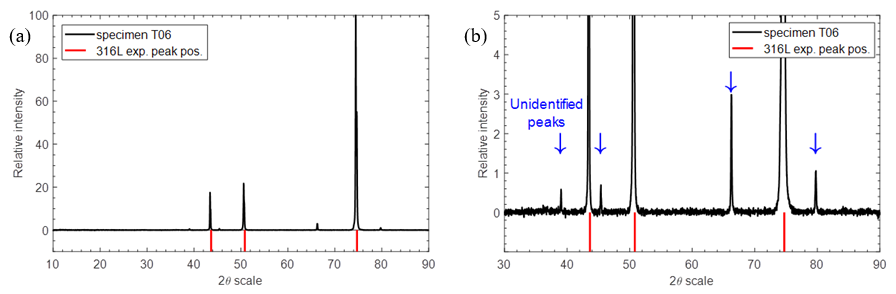
Fig. 15. XRD spectra collected on the dark region of specimen T06 (a); detailed view of unidentified peaks (b).
4.3. Erosion-corrosion in used rich MEA in the presence of NaHSO4 + O2
The test conditions were selected to simulate the chemical composition in used MEA containing added and reacted oxygen scavenger (bisulfite turned into bisulfate/sulfate) and excess oxygen. The test solution was based on used rich MEA as received from TCM. The pH of this stock was 8.70 at room temperature at the time the testing started.
One impeller blade specimen and two stationary specimens were exposed in this test series (see appearance before and after exposure in Fig. 16). In this series both stationary specimens served as the working electrodes connected to separate channels on the multiplexer. One of the stainless steel tubes in the cell was connected to the counter electrode lead. Only open circuit potential (OCP) measurements were performed in this test in order to minimize disturbances affecting the specimens.
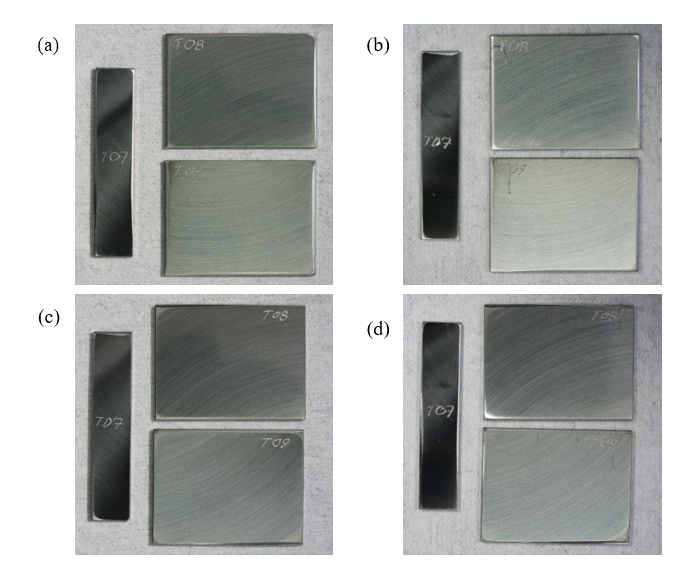
Fig. 16. Photographs of the 316L specimens before (a) and (c), and after exposure (b) and (d) in the erosion-corrosion test in used rich MEA in the presence of NaHSO4 + O2.
The results of the measurements are shown in Fig. 17, where vertical lines and corresponding labels indicate the various actions taken during exposure.
The starting solution was prepared by first dissolving into a fixed amount (1100 g) of lean solvent the necessary quantity of NaHSO3 (50.13 g). Vigorous effervescence was observed upon mixing also this time. An aliquot of 855.1 g starting solution was then loaded into the cell and purged with air at room temperature to make sure the scavenger- oxygen reaction is quantitative, i.e. all the added scavenger is reacted. Purging with air was maintained in order to achieve excess of dissolved O2 in the solution. After the fine-grained sand was introduced into the cell and vigorous rotation of the impeller was started, heating was started to a setpoint of 80 °C. The OCP displayed a shift towards more negative values. This trend continued also after the temperature setpoint was adjusted to 120 °C. At this point the purging gas was changed to a mixture of air and CO2 (1:3 by volumetric rate) to maintain the presence of CO2 and excess O2 in the cell at the elevated temperature. The OCP reached a minimum around -580 mV vs. Ag/AgCl for a very brief period of time and increased rather rapidly again stabilizing around -200 mV vs. Ag/AgCl after ca. 20 hours. The behavior is quite different from that observed in anoxic environment where quite negative potentials were recorded for a prolonged time period. This is illustrated in Fig. 18 comparing the development of the specimens’ potential under anoxic (left plot) and excess oxygen (right plot) environments in the first 40 hours after sand addition.
The results seem to support the erosion-induced damage to the passivating layer to occur; it may be envisioned that while repassivation is hindered in the absence of oxygen, it does take place with oxygen present, resulting in a consistently more positive open circuit potential.
Before ca. 80 hours of exposure the gas outlet pressure regulator malfunctioned leading to an increase of the total pressure to ca. 3.5 bar and stopping the gas purging. The supply of CO2 and O2 in this period was likely very limited, but not nil. The potential showed large variations but appeared to return to normal after the target conditions were restored. Regardless of what the effect of the clogged gas outlet may have been, the specimens were found to be practically unchanged when examined after the exposure, see Fig. 16.
It was noted that in this experiment foaming could be observed towards the end of the exposure. It is not clear whether this may have had any effect on the behavior of the solid particles, but the electrochemical data is in agreement with the erosive effect taking place. It was also noted that the cell content had a strong ammonia odor at the end of the test, indicating that oxidative degradation of the solvent has occurred to some extent. This is not unexpected in view of the constant oxygen supply into the solution at high temperature. While the degradation is neither further investigated nor quantified, the aspect of the specimens shows that it had no negative impact on the outcome of the test.
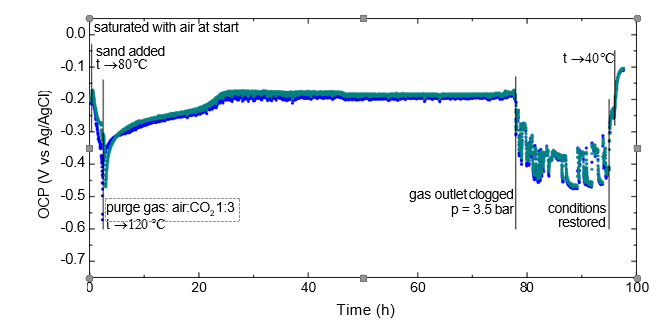
Fig. 17. OCP of 316L in rich MEA starting solution during erosion-corrosion testing at temperatures up to 120 °C.
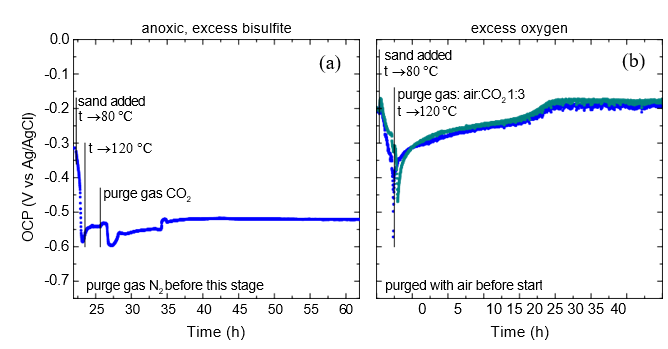
Fig. 18. Comparison of potential development under (a) anoxic and (b) excess oxygen environments in the first 40 hours after sand addition.
5. Conclusions
The laboratory tests performed in a customized erosion-corrosion setup were aimed at validating the hypothesis that erosion by solid particles combined with corrosiveness of the solvent is a plausible scenario for the reboiler damage experienced at TCM.
The results of the experiments can be summarized as follows:
– significant damage occurred with erosive action in used rich solvent with excess oxygen scavenger (i.e. anoxic conditions)
– the observations are in agreement with damage of passive film allowing activation of the corrosion process
– the results indicate that the surface likely fails to re-passivate in anoxic environment
– the same mechanism is not sustained in oxygenated environment where the surface is capable to repassivate
It can be concluded that the erosion-corrosion is valid and plausible. This mechanism may be the actual failure mode in the TCM reboiler.
Although not investigated specifically, some remarks can be made regarding the other hypotheses based on observations from this study:
– erosion-corrosion tests with excess O2 did not produce any damage; this suggests that erosion alone represents a lower risk
– the benchmark tests under anoxic conditions did cause alterations to the specimen surfaces, albeit likely in conjunction with the electrochemical measurements; still one could speculate that corrosivity may represent some risk on its own
Acknowledgements
The authors gratefully acknowledge the staff of TCM DA, Gassnova, Equinor, Shell and TotalEnergies for their contribution and work at the TCM DA facility. The authors also gratefully acknowledge Gassnova, Equinor, Shell, and TotalEnergies as the owners of TCM DA for their financial support and contributions. The contribution of Dr. Morten Tjelta (IFE) with XRD analyses is greatly appreciated.
References
[1] N. Enaasen Flø, L. Faramarzi, F. Iversen, E. Romslo Kleppe, B. Graver, H. Nornes Bryntesen and K. Johnsen, Assessment of Material Selection for the CO2 Absorption Process with Aqueous MEA Solution based on Results from Corrosion Monitoring at Technology Centre Mongstad, 14th International Conference on Greenhouse Gas Control Technologies, GHGT-14, (2018).
[2] A. Palencsár, R. Nyborg, N. Enaasen Flø, F. Iversen, B. Deleneuville, M. Bonis and V. Gregoire, Investigation of Corrosion-related Failure of Reboiler at Technology Centre Mongstad, The 10th Trondheim Conference on CO2 Capture, Transport and Storage; TCCS-10, SINTEF Academic Press (2019).