
3. Pilot-Scale Testing of Metal Organic Frameworks (MOFs) for Post-Combustion CO2 Capture at Technology Centre Mongstad (TCM) (2024)
Ahmad Wakaaa*, Blair McMastera, Ticiane Oliveiraa, Matthew Campbella, Guy Weireldb, Richard Blomc, Shreenath Krishnamurthyc, Arnaud Henrotinb, Nicolas Heymansb, Jose Casaband.
aTechnology Centre Mongstad, 5954 Mongstad, Norway;
bUniversity of Mons, Belgium;
cSINTEF Industry, Norway;
dMOFTECH, Belfast, UK

Abstract
The use of MOF materials for carbon capture is a promising technology towards climate neutrality. In this paper, the use of large-scale synthesized Al-MOF material for CO2 capture from TCM’s flue gases has been demonstrated. The material was loaded into an industrial-scale 3-column VPSA pilot plant using a 6-step cycle. The columns of 41 L were filled up with 17.5 kg pelletized MOF material each. A Design of Experiment (DoE) was developed based on previous studies at lab-scale pilot and implemented at the pilot plant. A VPSA pilot simulation, accounting for industrial conditions, was developed and used as the basis for the pilot plant operation. The CO2 purity and recovery obtained during simulations were 90% and 85%, respectively.
Keywords: CO2 capture, vacuum pressure swing adsorption, industrial pilot, MIL-160(Al), MOF4AIR project.
1. Introduction
Among the most promising technologies for CO2 mitigation is Carbon Capture and Storage (CCS), particularly in post-combustion processes prevalent in carbon-intensive industries. To the well-established industrial processes of sectors such as power plants, cement production, steel manufacturing and petrochemical industries, post-combustion technologies can be retrofitted with minimum economical and time penalty.
In the investigation of decarbonization alternatives the use of metal-organic frameworks (MOFs) is noticeable. MOFs are porous solids generated by the alternated arrangement of so-called building blocks of organic and inorganic components [1]. These building blocks are strongly bonded into a highly ordered 3D structure enabling the generation of the target porous solid where gas adsorption takes place. MOFs materials have been intensively studied for CO2 adsorption and separation due to characteristics such as high adsorption capacity, high CO2 affinity, material versatility and relatively straightforward regeneration of the adsorbent.
Although MOFs materials have been studied and tested at lab-scale with positive results, the comprehensive evaluation of MOFs for CO2 adsorption at industrial scale is still ongoing and results look promising so far. The impact of real industrial conditions on purity, productivity and energy consumption for these processes is yet to be understood. Addressing this issue, a consortium of 14 partners from 8 different countries have collaborated to establish the MOF4AIR project. The initiative aims to develop and demonstrate the performance of the most promising MOF materials in post-combustion CO2 capture contexts.
Technology Centre Mongstad (TCM) is one of the three selected demonstration sites to test the MOF-based CO2 capture technology as part of the MOF4AIR project. TCM is a pioneering facility located in Mongstad, Norway [2]. Established in 2012 through collaboration among major energy companies, including Gassnova (on behalf of the Norwegian state), Equinor, Shell, and TotalEnergies, TCM is dedicated to advancing carbon capture technologies. Serving as the world’s largest facility of its kind, TCM provides a crucial platform for research, development, and testing of carbon capture solutions. TCM’s state-of-the-art infrastructure allows companies and researchers to test and optimize CCS technologies before commercialization.
The test campaign at TCM has already began and numerous operational challenges have been observed. Pilot malfunctions, sensors defect, and extended waiting periods in resolving pilot problems, affected the production of valuable data. In this paper we will share the knowledge obtained from the MOF4AIR test campaign at TCM so far. The test aims to identify the optimum conditions for the MIL-160(Al) MOF-based CO2 capture system using the Vacuum Pressure Swing Adsorption (VPSA) process. Commissioning phase, operational challenges, process modifications and pilot improvements will be covered in detail. As well as the results of simulation model based on the data from the Université de Mons (UMONS) lab-scale pilot.
2. Methodology
2.1 MOF selection and validation
Based on an extensive review of the literature, a portfolio with the 24 most suitable MOFs candidates for CO2 capture was created. The selection criteria included CO2 capacity, CO2/N2 selectivity, heat of adsorption, and stability in the presence of contaminants. Additionally, the list was reviewed considering aspects such as patent situation, green synthesis, scalability and shaping and raw material costs. All selected materials meet the objectives of the capture process of achieving 95% CO2 purity and 90% CO2 recovery from flue gas, according to published data.
The 24 selected MOF candidates for CO2 capture were further narrowed to 17 candidate materials, which were synthesized on a 10 g scale for further performance comparison. All syntheses used simple reflux/mechanochemical technique employing green solvents such as water and alcohol in most cases. The crystallinity and purity of the synthesized materials were evaluated by Powder X-ray Diffraction (PXRD), Thermogravimetric Analysis (TGA), Fourier Transform Infrared Spectroscopy (FT-IR), and Nuclear Magnetic Resonance (NMR) spectroscopy. All samples were characterized for specific surface area and pore volume using N2 adsorption isotherm at 77 K. CO2/N2 selectivity and competitive adsorption of the samples was assessed through Ideal Adsorption Solution Theory (IAST) calculations, based on measured single-component isotherms at 298 K and up to 1 bar, assuming flue gas composition of 15 CO2:85 N2. Additionally, the samples were compared on: (i) stability to water; (ii) stability to contaminants; (iii) CO2 adsorption capacity at 0.1 bar and temperatures from 298 K and above; (iv) influence of water on CO2 adsorption capacity; and (v) enthalpy of adsorption. Finally, MIL-160(Al) was chosen for upscaling to 100 kg scale to be used in the pilot process.
2.2 Adsorption model
The adsorption process model is a set of partial differential equations accounting for the mass energy and momentum balances. The process model is well established in literature and is based on the following assumptions: 1. Axially dispersed plug flow 2. No radial gradients 3. Uniformity of adsorbent properties across the bed and 4. Validity of the Redlich-Kwong gas law [3]. Ergun equation is used for the momentum balance [4]. The adsorption rate equation was described by the linear driving force equation [5], [6]. The adsorption equilibrium was described by the extended Langmuir model [7], [8] and the sorption isotherms are provided in Table 1. The simulations assume a binary system containing N2 and CO2 and the presence of moisture is neglected in the process model. The VPSA pilot with 6-step cycle [9] was simulated with Aspen Adsorption© V14 software using the unibed approach [10] by saving and replaying the flow, temperature, composition and pressure of the streams for light and heavy reflux steps, and light product pressurization step. The system of equations was solved using the finite volume method [11]. The column was divided into 30 nodes with the Van Leer scheme for the computation of mass, momentum and heat balances. The heat transfer coefficient between solid and gas is estimated by the Martin correlation [12], the gas to inlet wall by the correlation of Yagi and Kunii [13], and the external wall to ambient by heat transfer model (natural convection, radiation and total) [14].
In addition, the vacuum pump characteristics of the pilot were introduced in Aspen Adsorption to accurately simulate the evacuation steps. The decrease of pressure is thus computed by the momentum balance with the pumping speed of the vacuum pump. Adsorption isotherm parameters, linear driving force coefficients, adsorbent geometry and properties (heat capacity, heat conductivity, etc.) were determined during the MOF4AIR project with adsorption isotherm and breakthrough curve measurements, and lab-scale pilot measurements.
Table 1: Parameters used in the extended Langmuir model
| CO2 | N2 | |
| qs [mmol.g-1] | 5.14 ± 0.14 | 5.14 ± 0.14 |
| b0 [bar-1] | 2.32×10⁻⁶ ± 1.80×10⁻⁶ | 3.93×10⁻⁵ ± 2.37×10⁻⁵ |
| ΔH [kJ.mol-1] | 34.01 ± 2.00 | 17.21 ± 1.56 |
2.3 VPSA pilot simulation
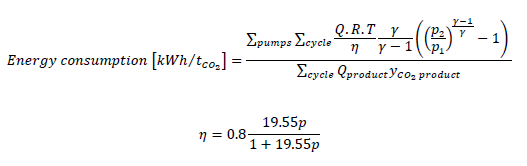
The VPSA pilot was simulated with a feed flow rate ranging from 50 to 100 Nm³.h-1 and three CO2 concentration (5, 10 and 15%). Four indicators are studied by simulation: CO2 recovery (the amount of CO2 retrieved compared to the amount in the feed), the purity of the CO2 retrieved, the productivity (amount of CO2 obtained per day for one cubic meter of adsorbent), and the energy consumption (energy required to capture one ton of CO2) [15], for the energy estimation, Equations 1 and 2 are used, with a vacuum pump efficiency which is dependent on the pressure [16]. Table 2 gives the parameters used for the simulation of the VPSA pilot.
To find the optimum conditions with a limited number of simulations, a surrogate model was constructed with 2000 simulations. Six variables were studied by constructing a latin-hypercube to have a good dispersion of the operating conditions which need to be simulated. The variables are: 𝑡𝐴𝑑 [40-200s], 𝑡𝐿𝑅 [15-160s], 𝑡𝐶𝑜𝐸 [5-25s], 𝑄𝑖𝑛𝑙𝑒𝑡 [50-100 Nm³.h-1], 𝑄𝐿𝑅 [1-20 Nm³.h-1], and CO2 concentration [5-15%]. The surrogate model selected is a two-layer feed- forward neural network with 40 neurons in the first layer and 30 neurons in the second. Hyperbolic tangent is used as the activation function of the neurons, and a regularization parameter is used during the fitting of the model to avoid overfitting. This model has been applied to numerous VPSA simulations showing a good agreement between direct simulation, and surrogate [17], [18], [19]. The python scikit-learn library was used to construct the surrogate model. The 2000 simulations points were divided in a training set (70%) and validation set (30%). For the training, a cross- validation procedure was used with 10 folds to increase the fitting quality of the model. The trained model is then used to determine the optimum operating conditions. For the multi-objective optimization, the Non-Dominated Sorting Genetic Algorithm II (NSGA-II) is used by using the pymoo library in python.
Table 2: Parameters used for the simulation of VPSA pilot.
| Parameter | Value | Source |
| 𝜀𝑎𝑑𝑠 [-] | 0.35 | Assumed |
| 𝜌𝑎𝑑𝑠 [kg.m-3] | 554.65 | Derived from mass and geometry |
| 𝜀𝑏𝑒𝑑 [-] | 0.3 | Derived from density of adsorbent and bed |
| 𝜌𝑏𝑒𝑑 [kg.m-3] | 385 | Measured |
| 𝑑𝑝 [m] | 0.00247 | Measured |
| 𝜙𝑎𝑑𝑠 [−] | 0.83 | Measured |
| 𝐷𝑚 [m².s-1] | 1.6×10⁻⁵ | [3] |
| L [m] | 0.58 | Specification of the pilot |
| dbed,in [m] | 0.3 | Specification of the pilot |
| dbed,out [m] | 0.306 | Specification of the pilot |
| Initial feed flow rate [Nm³/h] | 50-100 | VPSA pilot operating condition |
| Initial CO2 fraction [%] | 5-15 | VPSA pilot operating condition |
| Feed temperature [°C] | 30 | Assumed |
| Ambient temperature [°C] | 30 | Assumed |
| Feed pressure [bar] | 1.01 | Assumed |
| kLDF CO2 [s-1] | 0.0542 | Fitted from breakthrough curves |
| kLDF N2 [s-1] | 6.4778 | Fitted from breakthrough curves |
| ∆HCO2 [kJ.mol-1] | 29.37 | Obtained from adsorption isotherms with Clausius-Clapeyron method |
| ∆HN2 [kJ.mol-1] | 16.16 | Obtained from adsorption isotherms with Clausius-Clapeyron method |
| Cp,s [J.kg-1.K-1] | 1326 | Fitted from breakthrough curves |
| Cp,w [J.kg-1.K-1] | 500 | Assumed |
| 𝜆𝑠 [W.m-1.K-1] | 0.06 | [20] |
| 𝜆𝑤 [W.m-1.K-1] | 15 | Assumed |
| 𝜌𝑤 [kg.m-3] | 7990 | Assumed |
2.4 Pre-treatment pilot
The pilot plant developed for operation at TCM was designed based on the site’s post combustion flue gas streams compositions, impurities and flow rates. The plant consists of two main sections: a pre-treatment section and a Vacuum Pressure Swing Adsorption (VPSA) CO2 capture section. The pre-treatment section is further divided into three stages where (i) suspended particles are removed, followed by a (ii) a water removal stage and a (iii) contaminant removal stage. Additionally, a cooling water circuit operates simultaneously with the pilot plant to provide cool water for the heat exchangers.
2.5 VPSA pilot description
After the pre-treatment, the flue gas enters the VPSA section, which features three adsorption beds. These columns work concomitantly to adsorb CO2 from the gas stream in a continuous adsorption-desorption cycle. In a vacuum Pressure Swing Adsorption (VPSA) process, the process cycles between adsorption at high pressure and desorption is performed by applying vacuum [9], [11]. Both the purity and the recovery of the CO2 are not only governed by the operating conditions of the VPSA processes (step duration, vacuum pressures etc.), but also depend on the adsorbent itself. Therefore, efficient optimization of the process is necessary to minimize the energy penalty of the VPSA process [21], [22].
The VPSA cycle process implemented at TCM was inspired from previous lab-scaled tests for a continuous treatment of the flue gas [9], [11], [23], [24]. The pilot comprises of a 3-bed, 6-step cycle, adapted from the lab-scaled VPSA pilot selected for MOF4AIR [23]. The 3 adsorption beds, with 41 L each, were filled up with approximately 17.5 kg of the MOF material MIL-160(Al). Temperature sensors were installed at the bottom and top of each column to monitor the adsorption profile. Also, at the bottom and top of each column, there are three openings connecting the columns to the inlet supply line, product line, and depleted line. These openings also link the columns to each other, allowing a total of 6 different steps in the VPSA configuration. A schematic diagram of the cycle steps in each column during continuous adsorption-desorption process is shown in Figure 1.
The steps can be described as following:
• Light Reflux (LR): in this step, part of the waste stream of the column in adsorption is flushed downwards through the column. Most of the waste stream is composed of nitrogen and helps recover the remaining CO2 in the bed.
• Light Product Pressurization (LPP): in this step, the same waste stream is introduced to the column, now with the bottom end closed. This step aims to increase the pressure in the column up to adsorption pressure, sharpening the CO2 front in bottom of the bed [9].
• Adsorption (Ad): flue gas is fed to the column from the bottom end upwards. Adsorption takes place while flue gas is fed continuously pushing the CO2 front upwards in the bed.
• Rinse (R): in this step, the CO2 in the LR effluent is introduced right after adsorption step is finished. This serves as a heavy reflux increasing CO2 loading in the bed and both recovery and purity of the product.
• Co-current Evacuation (CoE): a light vacuum is applied at the light-product end of the bed. This reduces the amount of nitrogen in the column therefore increasing purity.
• Counter current Evacuation (CcE): in this step, a high vacuum is applied to recover the adsorbed CO2 .
• Idle: this step is a break period necessary for VPSA optimization during continuous adsorption-desorption process.
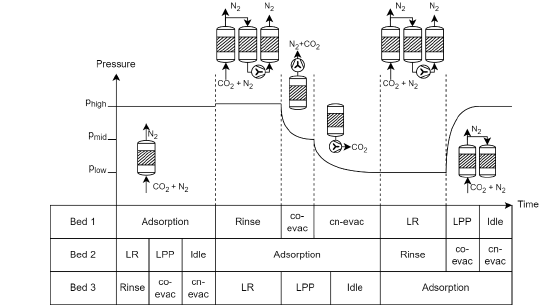
Figure 1. Schematic diagram of the3-bed 6-step VPSA cycle implemented at TCM.
The relationship and boundaries implied for the step durations were then tested over simulations to develop a Design of Experiment (DoE). A total of 315 different experiments were obtained in the DoE when targeting CO2 purity and recovery higher than 95% and 90%, respectively. Each experiment contains a different combination of the parameters like 𝑡𝐴𝑑 , 𝑡𝑅, and 𝑡𝐶𝑜𝐸 , used as input in the VPSA pilot plant at TCM. In contrast to the laboratory test conditions, parameters such as adsorption pressure (𝑃𝐴𝑑 ), co-current evacuation pressure (𝑃𝐶𝑜𝐸 ), counter current evacuation pressure (𝑃𝐶𝑐𝐸 ) and reflux flow rate (𝑄𝐿𝑅), could not be easily modified. These, although obtained through simulations, were passive variables, exclusively monitored to be within the desirable range.
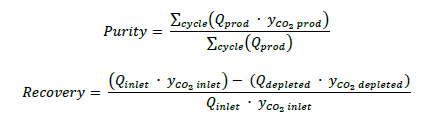
The experiments selected from the DoE and tested at TCM’s pilot plant were evaluated through the two main project KPIs: CO2 purity and CO2 recovery. Purity values were calculated as in Equation 3 where 𝑄𝑝𝑟𝑜𝑑 is the flow rate in the product line and 𝑦𝐶𝑂2 𝑝𝑟𝑜𝑑 is the CO2 concentration in the line. Both values are obtained only during CcE step. Recovery is calculated as in Equation 44 44 where 𝑄𝑖𝑛𝑙𝑒𝑡 is the inlet flow rate, 𝑄𝑑𝑒𝑝𝑙𝑒𝑡𝑒𝑑 is the depleted gas flow rate, 𝑦𝐶𝑂2 𝑖𝑛𝑙𝑒𝑡 is the CO2 concentration in the flue gas after pretreatment and prior to entering the VPSA pilot and 𝑦𝐶𝑂2 𝑑𝑒𝑝𝑙𝑒𝑡𝑒𝑑 is the CO2 concentration of the depleted stream. The depleted or waste stream carries all the CO2 that was not captured during VPSA process. This stream includes CO2 that was not adsorbed during the adsorption step and any CO2 waste that could possibly come out from the rinse step.
2.6 Breakthrough experiments
For the performance of breakthrough experiments a dedicated testing procedure was developed, and the pilot was operated in manual mode. At a manual pilot operation, the original pilot pumps could not be used for regeneration, as in the automatic VPSA cycle. To do so, a small vacuum pump was coupled to the bottom of the columns, applying vacuum for several hours. Valves were controlled manually, and the regeneration process monitored by CO2 sensors in the feeding and product lines. Once the material was activated, N2 was introduced to the columns to restore pressure. The evacuation procedure was then repeated, and columns were re-filled with N2 and kept under pressure during idle pilot periods.
3. Test Campaign
3.1 Results of the VPSA simulation model
The model constructed with the training set of the simulations of the VPSA was first compared with the validation set. Figure 2 gives a graphical comparison of the performance of the surrogate model, showing a good agreement between the validation points, and the predicted values by the model. The R² value for the three indicators is higher than 99% with 99.84% for purity, 99.93% for recovery, and 99.90% for energy consumption. Productivity was not computed by the surrogate model since this indicator can be obtained from the recovery.
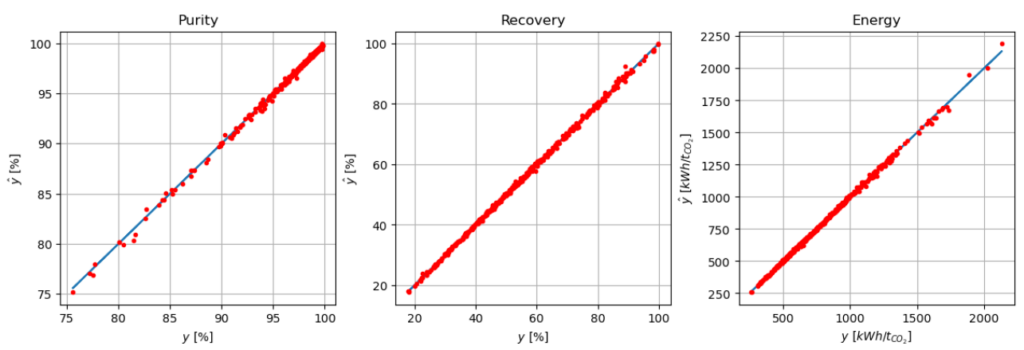
Figure 2: Actual versus predicted value by the surrogate model for purity, recovery and energy consumption of the industrial pilot.
Pareto plots were determined from the surrogate model for different feed flow rates and feed CO2 concentrations. Figure 3 shows the purity-recovery pareto obtained with NSGA-II when changing the flow rate and CO2 concentration in the feed. As observed, the pareto fronts are almost independent of the CO2 concentration, especially at 80 Nm³/h of feed flow rate where the three curves are overlapping. At 50 Nm³/h, the 5% concentration is performing slightly better than the 10% and 15% case. As the feed flow rate increases, the pareto fronts are shifted to the left meaning that lower recovery can be obtained. High purity (> 95%) can be obtained with all the paretos.
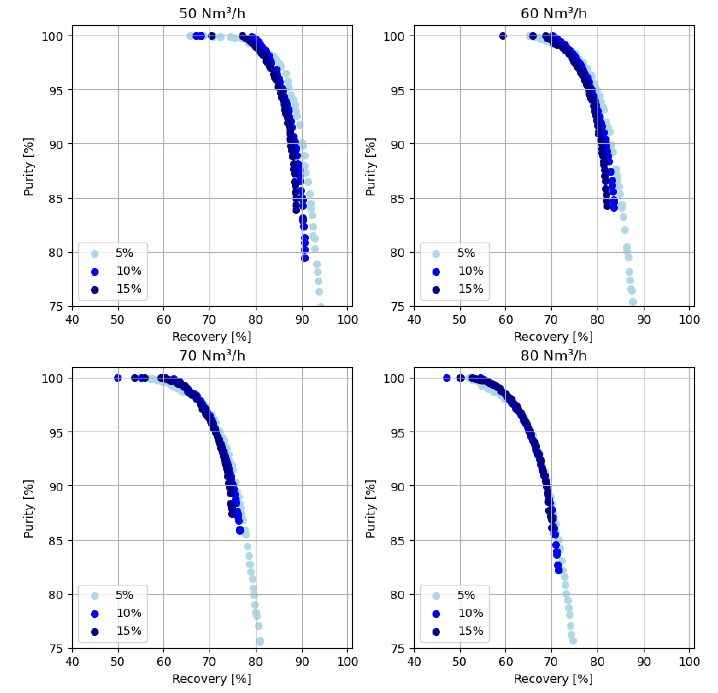
Figure 3: Pareto of purity and recovery obtained for a feed flow rate of 50, 60, 70, 80 Nm³/h, and different feed CO2 concentrations. Light blue = 5% CO2, blue = 10% CO2, dark blue = 15% CO2.
Table 3: Results of optimization for a purity of at least 90% and recovery of at least 85%.
| Case | 5% | 10% | 15% |
| Adsorption time [s] | 96 | 69 | 55 |
| Light reflux time [s] | 68 | 43 | 26 |
| Co-current evacuation time [s] | 8 | 6 | 5 |
| Feed flow rate [Nm³/h] | 57 | 55 | 54 |
| Light reflux flow rate [Nm³/h] | 8.5 | 6.2 | 5.7 |
| Purity [%] | 90 | 90 | 90 |
| Recovery [%] | 85.01 | 85.01 | 85 |
| Energy [kWh/tCO2] | 1054 | 530 | 354 |
| Productivity [tCO2/(m³ads.day)] | 0.93 | 1.8 | 2.64 |
The targets of a CO2 capture process (purity > 95% and recovery > 95%) cannot be reached (Figure 3), especially for the recovery. Nevertheless, optimum energy consumption and productivity can be found for a recovery of a least 85% and a purity of 90%. NSGA-II was used for this task by adding a constraint to recovery and purity, and by minimizing energy consumption and maximizing productivity. Table 3 gives the operating conditions for 5%, 10% and 15% CO2 in the flue gas. For the three cases, the purity and recovery are equal to the minimum bound imposed by the optimization. The feed flow rate is around 55 Nm³/h for the three concentrations. The adsorption time decreases as the concentration increases which is logical since the bed is saturated faster at 15% than 5%. Light reflux time, 𝑡𝐿𝑅, and co-current evacuation time, 𝑡𝐶𝑜𝐸, follow the same trend. Energy consumption decreases as the CO2 concentration increases to reach a value of 354 kWh/tCO2 for the 15% case. Since the amount of CO2 captured decreases when the inlet concentration decreases, it is logical to find higher energy consumption. Productivity follows the same reasoning with higher productivity for higher inlet concentration.
3.2 Breakthrough curves
Breakthrough curves were measured separately in each of the 3 columns of the VPSA pilot at TCM using a 14% CO2 concentration gas source with a flow rate of 50 Nm3/h. Figure 4 shows the adsorption profile of the MIL-160(Al) material inside column 302. These are compared with inlet CO2 concentration during experiment and the breakthrough curve obtained during testing at UMONS under same operation conditions. Temperature profile during breakthrough experiment was monitored at top and bottom of the adsorption bed (Figure 4b). The plateau observed at 12.4% followed by the gradual increase after the temperature drop is typical of adiabatic systems and agrees literature [11]. The obtained breakthrough curves showed no indication of any structural defects or moisture adsorption allowing the start of the test campaign.
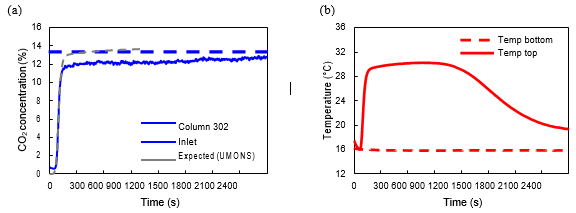
Figure 4. Breakthrough curves measured on MIL-160(Al) after material was loaded into the pilot plant. The adsorption profile (a) measured individually for column 302 (solid blue line) is compared with average inlet CO2 concentration during experiment (dashed blue line) and expected values obtained by test at UMONS (dashed grey line). Temperature profile (b) is giving by comparing observed temperature at the bottom of the column (dashed red line) and top of the column (solid red line). Flue gas was introduced from bottom to top.
3.3 Initial results of the VPSA pilot
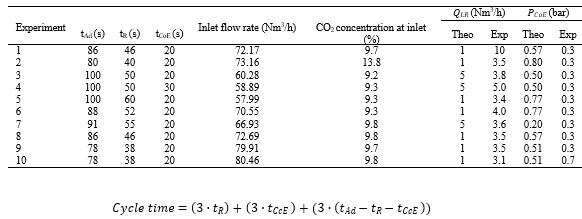
Several small issues were encountered during the test campaign which reduced the effective testing time to a few weeks. During this time, 10 different experiments selected from the DoE ran continuously for a period longer than 8 hours. The input parameters used for each experiment are shown in Table 4. The immediate number received from CO2 sensors and flowmeters were used to evaluate the evolution of the adsorption cycles and estimate when the experiment reached a steady state. The experiment was kept going allowing the collection of at least 7200 seconds of data under steady state. The data was then used to calculate CO2 purity and recovery as well and to compare simulation and experimental results as shown in Table 4. Inlet flow rate and CO2 concentration were averaged through the total 7200 seconds of experiment, once the flue gas inlet into the pilot was continuous. The 𝑄𝐿𝑅 and 𝑃𝐶𝑜𝐸 observed values were obtained per cycle and the cycle time was calculated as in Equation 5.
Table 4. Main experiment parameters obtained during test campaign at TCM.
The relationships between parameters imposed by the optimization of the VPSA cycle resulted in the impossibility of controlling the counter current evacuation time (𝑡𝐶𝑐𝐸 ). This was generated by simulations and ranged up to 60 seconds. In practice, 𝑡𝐶𝑐𝐸 shorter than 10 seconds was not sufficient for complete product recovery, while 𝑡𝐶𝑐𝐸 longer than 40 seconds was causing the pump to running dry and consequently trip, aborting the experiment. Simulations have set an optimum range for 𝑃𝐶𝑐𝐸 of around 1 bar. The overload of the CcE vacuum pump was causing pressures to go down to 0.031 bar.
Due to such limitation, the experiments selected from the DoE and tested at the pilot plant were primarily based on the CcE step duration. Experiments 1 to 10 had a 𝑡𝐶𝑐𝐸 ranging from 16 to 30 seconds. A proportional difference was observed between 𝑄𝐶𝑐𝐸 and 𝑡𝐶𝑐𝐸 when comparing experiment with inlet flow rate of 60, 70 and 80 Nm3/h. Experiments 4, 1 and 10 ran with 𝑡𝐶𝑐𝐸 of 20 seconds and presented maximum 𝑄𝐶𝑐𝐸 averaging in 5, 10 and 15 Nm3/h respectively. However, the same relation was not observed for the CO2 concentration in the product line during CcE step. For the same experiments, 4, 1 and 10, CO2 concentration averaged 40.4%, 24.7% and 42.1% respectively.
An important relationship between co-current evacuation time (𝑡𝐶𝑜𝐸 ) and pressure (𝑃𝐶𝑜𝐸 ) were also observed during experiments. Pressure at the CoE line was controlled by the vacuum pump VP-302, which was oversized for its purpose. Average CO2 concentration in the CoE line reached up to 14.6% during experiment 4, the experiment with the longer 𝑡𝐶𝑐𝐸 . However, concentrations did not go down when comparing the other 9 experiments with a shorter evacuation time. A modification in VP-302 was implemented right after experiment 9 was completed. The modification included a recycling connection tube, bringing flow from the exit and back to the inlet of the pump. This approach decreased the 𝑄𝐶𝑜𝐸 from 6.3 Nm3/h bar to 1.2 Nm3/h and raised 𝑃𝐶𝑜𝐸 from approximately 0.3 bar to 0.7 bar. The impact of such modification was observed when running experiment 10, which has the exact same parameters, and the CO2 concentrations in the CoE line dropped from 6.3% to 2.3%.
The main KPIs, CO2 recovery and purity, used during test campaign, were strongly affected by both non-ideal performance of the vacuum pumps and incorrect values provided by the CO2 sensors. Unfortunately, the fault with the CO2 sensors was only identified after all the 10 studied tests had been completed. The defect on the CO2 sensors was spotted during maintenance of the vacuum pumps in the VPSA pilot and due to the nature of the malfunction, no possible data correction could be conducted.
To enhance test results, a structured troubleshooting approach has been implemented to address issues with the defective equipment. This includes replacing the CO2 sensors and the CO2 product stream flowmeter, as well as revising formulas used for CO2 recovery and purity, among other adjustments. A new series of tests was conducted in mid to late November, yielding significant improvements. Notably, around 90% CO2 recovery was achieved, along with promising outcomes regarding the feasibility of producing a high-purity CO2 stream. However, additional work is required to verify these results and assess the performance of certain equipment.
3.4 Operation experience
The design of the MOF4AIR pilot plant for TCM proved to be a delicate and highly complex system. During commissioning phase, numerous small issues arose, and no straightforward approach was possible due to the pilot plant’s singular nature and functional deviations of the standard designs previously encountered by the team. The team actively engaged in communication and close collaboration with the different project partners for problem-solving. However, logistic and supply chain delays resulted in long idle periods for the pilot plant and a considerable delay of the test campaign agenda.
In the few weeks where the pilot plant was under normal operation, several small issues prevented a complete run of the individual experiments designed in the DoE. Considerable low values of CO2 purity and recovery were immediately observed during the first tests, indicating imperfect test conditions and the need for finer tuning of the pilot plant components. Data loss, pump malfunctions, unexpected shutdowns, and plant trips yielded unreliable data during the first few weeks of testing.
The complexity of manual process modifications was also a topic for concerns and delays. This can be exemplified by the adjustment of a bypass valve in the line connecting the waste stream from the adsorption column to the light reflux stream. This modification aimed to improve 𝑃𝐶𝑜𝐸 and 𝑄𝐿𝑅 values to match simulation outputs and reach the target KPIs. The bypass valve regulates the 𝑄𝐿𝑅, directly influencing recovery, purity and energy consumption. A manual modification of the valve aperture resulted in a brief increase in CO2 recovery at the cost of decreased in purity. Several weeks were spent attempting to achieve the optimum aperture of the bypass valve as well as on optimization of the 𝑡𝐶𝑜𝐸 , balancing vacuum pump capacity with step duration. Additionally, the column volume and pump capacities directly influenced the target KPIs as well as restricted the range of test parameter adjustments.
4. Conclusion
During the VPSA pilot test at TCM, several operational challenges and technical issues arose, which needed to be addressed. Troubleshooting these problems not only resolved the issues but also led to a deeper understanding of the pilot plant, ultimately enhancing its performance and achieving around 90% CO2 capture recovery. Further tuning of the pilot plant conditions and equipment has shown promising results, indicating that achieving approximately 95% CO2 purity in the CO2 stream is feasible. This work is scheduled for Q1 2025 in close collaboration with UMONS and SINTEF. The results of the VPSA pilot test at TCM will be published in the near future.
5. Acknowledges
This project has received funding from the European Union’s Horizon 2020 research and innovation program under grant agreement No. 837975. We acknowledge TCM – Technology Centre Mongstad for hosting the industrial pilot plant, EDIBON for building and installation of the pilot plant and MOFTECH for supplying the absorbent used in the pilot plant. We acknowledge the crucial collaboration of UMONS and SINTEF throughout the entire testing phase.
6. References
[1] P. D. C. Dietzel, V. Besikiotis, and R. Blom, “Application of metal–organic frameworks with coordinatively unsaturated metal sites in storage and separation of methane and carbon dioxide,” J Mater Chem, vol. 19, no. 39, pp. 7362–7370, 2009, doi: 10.1039/B911242A.
[2] “Technology Centre Mongstad | Carbon technology testing,” Oct. 2024. [Online]. Available: https://tcmda.com/
[3] K. R. Cox and W. G. Chapman, “The Properties of Gases and Liquids, 5th Edition By Bruce E. Poling (University of Toledo), John M. Prausnitz (University of California at Berkeley), and John P. O’Connell (University of Virginia). McGraw-Hill: New York. 2001. 768 pp. $115.00. ISBN 0-07-011682-2.,” J Am Chem Soc, vol. 123, no. 27, p. 6745, Jul. 2001, doi: 10.1021/ja0048634.
[4] S. Ergun, “Fluid flow through packed columns,” 1952. [Online]. Available: https://api.semanticscholar.org/CorpusID:135806248
[5] S. Sircar and J. R. Hufton, “Why Does the Linear Driving Force Model for Adsorption Kinetics Work?,”
Adsorption, vol. 6, no. 2, pp. 137–147, 2000, doi: 10.1023/A:1008965317983.
[6] Ralph T. Yang, “Gas_Separation_by_Adsorption_Processes,” 1987, doi: 10.1016/C2013-0-04269-7.
[7] D. M. Ruthven, Principles of adsorption and adsorption processes, First. Nashville: John Wiley & Sons, 1984.
[8] D. D. Do, “Fundamentals of Diffusion and Adsorption in Porous Media,” 1998. [Online]. Available: https://api.semanticscholar.org/CorpusID:99768889
[9] M. Khurana and S. Farooq, “Simulation and optimization of a 6-step dual-reflux VSA cycle for post- combustion CO2 capture,” Chem Eng Sci, vol. 152, pp. 507–515, 2016, doi: https://doi.org/10.1016/j.ces.2016.06.033.
[10] L. Jiang, V. G. Fox, and L. T. Biegler, “Simulation and optimal design of multiple-bed pressure swing adsorption systems,” AIChE Journal, vol. 50, no. 11, pp. 2904–2917, Nov. 2004, doi: https://doi.org/10.1002/aic.10223.
[11] S. Krishnamurthy et al., “CO2 capture from dry flue gas by vacuum swing adsorption: A pilot plant study,”
AIChE Journal, vol. 60, no. 5, pp. 1830–1842, May 2014, doi: https://doi.org/10.1002/aic.14435.
[12] H. Martin, “Low peclet number particle-to-fluid heat and mass transfer in packed beds,” Chem Eng Sci, vol. 33, no. 7, pp. 913–919, 1978, doi: https://doi.org/10.1016/0009-2509(78)85181-1.
[13] S. Yagi and D. Kunii, “Studies on heat transfer near wall surface in packed beds,” Aiche Journal, vol. 6, pp. 97–104, 1960, [Online]. Available: https://api.semanticscholar.org/CorpusID:98080043
[14] F. P. Incropera and D. P. DeWitt, “Fundamentals_of_Heat_and_Mass_Transfer,” 1996, doi: 10.1016/j.applthermaleng.2011.03.022.
[15] C. A. Grande, “Advances in Pressure Swing Adsorption for Gas Separation,” ISRN Chemical Engineering, vol. 2012, pp. 1–13, Dec. 2012, doi: 10.5402/2012/982934.
[16] R. T. Maruyama, K. N. Pai, S. G. Subraveti, and A. Rajendran, “Improving the performance of vacuum swing adsorption based CO2 capture under reduced recovery requirements,” International Journal of Greenhouse Gas Control, vol. 93, p. 102902, 2020, [Online]. Available: https://api.semanticscholar.org/CorpusID:214396522
[17] Z. Wang, Y. Shen, D. Zhang, Z. Tang, and W. Li, “A comparative study of multi-objective optimization with ANN-based VPSA model for CO2 capture from dry flue gas,” J Environ Chem Eng, vol. 10, no. 3, p. 108031, 2022, doi: https://doi.org/10.1016/j.jece.2022.108031.
[18] A. Streb and M. Mazzotti, “Performance limits of neural networks for optimizing an adsorption process for hydrogen purification and CO2 capture,” Comput Chem Eng, vol. 166, p. 107974, 2022, doi: https://doi.org/10.1016/j.compchemeng.2022.107974.
[19] K. N. Pai, V. Prasad, and A. Rajendran, “Generalized, Adsorbent-Agnostic, Artificial Neural Network Framework for Rapid Simulation, Optimization, and Adsorbent Screening of Adsorption Processes,” Ind Eng Chem Res, vol. 59, no. 38, pp. 16730–16740, Sep. 2020, doi: 10.1021/acs.iecr.0c02339.
[20] A. A. Permyakova et al., “Synthesis Optimization, Shaping, and Heat Reallocation Evaluation of the Hydrophilic Metal-Organic Framework MIL-160(Al).,” ChemSusChem, vol. 10 7, pp. 1419–1426, 2017, [Online]. Available: https://api.semanticscholar.org/CorpusID:5184001
[21] A. K. Rajagopalan, A. M. Avila, and A. Rajendran, “Do adsorbent screening metrics predict process performance? A process optimisation based study for post-combustion capture of CO2,” International Journal of Greenhouse Gas Control, vol. 46, pp. 76–85, 2016, doi: https://doi.org/10.1016/j.ijggc.2015.12.033.
[22] A. Nalaparaju, M. Khurana, S. Farooq, I. A. Karimi, and J. W. Jiang, “CO2 capture in cation-exchanged metal–organic frameworks: Holistic modeling from molecular simulation to process optimization,” Chem Eng Sci, vol. 124, pp. 70–78, 2015, doi: https://doi.org/10.1016/j.ces.2014.09.054.
[23] A. Henrotin et al., “Lab-scale pilot for CO2 capture vacuum pressure swing adsorption: MIL-160(Al) vs zeolite 13X,” Carbon Capture Science & Technology, vol. 12, p. 100224, 2024, doi: https://doi.org/10.1016/j.ccst.2024.100224.
[24] R. Haghpanah, R. Nilam, A. Rajendran, S. Farooq, and I. A. Karimi, “Cycle synthesis and optimization of a VSA process for postcombustion CO2 capture,” AIChE Journal, vol. 59, no. 12, pp. 4735–4748, Dec. 2013, doi: https://doi.org/10.1002/aic.14192.
[25] T. T. T. Nguyen, G. K. H. Shimizu, and A. Rajendran, “CO2/N2 separation by vacuum swing adsorption using a metal–organic framework, CALF-20: Multi-objective optimization and experimental validation,” Chemical Engineering Journal, vol. 452, p. 139550, 2023, doi: https://doi.org/10.1016/j.cej.2022.139550.