
3. Atmospheric emissions of amino- methyl-propanol, piperazine and their degradation products during the 2019–20 ALIGN-CCUS campaign at the Technology Centre Mongstad (2021)
Baptiste Languillea, Audun Dragesetb, Tomas Mikovinya, Erika Zardina, Christophe Benquetb,c, Øyvind Ullestadb,d, Magnus Aronsonb,d, Eirik Romslo Kleppeb,d, Armin Wisthalera*
aUniversity of Oslo, Department of Chemistry, P.O. Box 1033 Blindern, 0351 Oslo, Norway bTechnology Centre Mongstad (TCM), 5954 Mongstad, Norway cTotal E&P Norge, Finnestadveien 44, Dusavik, 4029 Stavanger, Norway dEquinor ASA, PO Box 8500, 4035 Stavanger, Norway *Corresponding author

Abstract

In the frame of the 2019-20 ALIGN-CCUS campaign, the amine plant at the Technology Centre Mongstad (TCM) was operated with the CESAR 1 solvent, i.e. an aqueous solution of 2-amino-2-methylpropan-1-ol (AMP) and piperazine (PZ), for removing carbon dioxide from the flue gas of Equinor’s combined cycle gas turbine plant. An online Proton-Transfer-Reaction Time-of- Flight Mass Spectrometer (PTR-TOF-MS) was used for quantifying atmospheric emissions of AMP and PZ, as well as emissions of amine degradation products and solvent impurities. Mean and median AMP levels emitted to the atmosphere over an operational period of 13 weeks were 562 and 377 ppb, respectively. PZ emissions to the atmosphere were much lower, with mean and median levels being 6.0 and 0.4 ppb, respectively. Three small carbonyl species (formaldehyde, acetaldehyde, acetone) were emitted at levels of tens to hundreds of ppb. Nitrogen-containing degradation products and impurities of solvent amines with mean emission levels >1 ppb included the following compounds: monomethylamine (MMA), formamide (FA), morpholine (MOR), 4,4- dimethyloxazolidine (DMO), 2-methyl-2-(methylamino)propan-1-ol (MeAMP), 4-acetylmorpholine (AMOR) and a compound with a molecular sum formula of C8H14N2, which we tentatively assigned to an alkylated imidazole or pyrazole. Low (<5 ppm) emissions of AMP were associated with a low flue gas temperature (<38 °C) and large temperature gradient between the two water wash sections.
1. Introduction
Amine-based post-combustion carbon capture (PCCC) is the technologically most mature solution for removing carbon dioxide (CO2) from a flue gas stream. The reduction in CO2 emissions comes, however, at the expense of amine emissions to the atmosphere. Atmospheric oxidation processes may partially transform the emitted amines into nitrosamines and nitramines [1], which are substances with known carcinogenic or potential carcinogenic properties. Since it is not possible to monitor and surveil nitrosamines and nitramines at ambient sub-ng/m³ levels, exposure to nitrosamines and nitramines is usually calculated taking into account dispersion and atmospheric processing of emitted amines. A key input parameter to such calculations is the emission rate of solvent amines and of smaller amines formed during solvent degradation. Amine emission data are thus of pivotal importance for ensuring an environmentally safe operation of an amine-based PCCC plant. A recent review by Scottish Environment Protection Agency [2] concludes that there is limited open source data available on amine emissions to the atmosphere and that most available data is based on capture solvents such as monoethanolamine (MEA) that are not necessarily representative of the mix of solvents used in state-of-the-art PCCC plants.
The Technology Centre Mongstad (TCM) (www.tcmda.com) in Norway is one of the world’s leading facilities for testing and improving CO2 capture technologies. TCM’s tasks also include the assessment of amine emissions to the atmosphere and the development of emission reduction strategies. Only few results from the emission measurements have, however, hitherto been disclosed. This is because detailed emission data would reveal the chemical composition of the solvent, which is, in most cases, confidential business information. Therefore, only MEA emission data are currently available in the open literature [3, 4].
ALIGN-CCUS (Accelerating Low CarboN Industrial Growth through Carbon Capture Utilisation and Storage) is a project financed through the first ERA-NET Co-fund ACT program funded by nine European countries and the European Union Horizon 2020 program. The ALIGN consortium includes 31 partners from industry, research and academia and has considerable involvement of industrial companies and an enterprise organization. The ALIGN- CCUS project aims at accelerating the transition of current industry and power sectors into a future of continued economic activity and low-carbon emissions, in which carbon capture, utilization and storage (CCUS) plays an essential role. For optimizing and reducing costs of PCCC, the ALIGN consortium has implemented test programs at four different pilot plants and testing facilities including TCM, the SINTEF pilot rig at Tiller/Trondheim in Norway, RWE’s Coal Innovation Centre at Niederaussem in Germany, and the Pilot-scale Advanced CO2 Capture Technology (PACT) facilities in Sheffield in the United Kingdom. TCM’s contribution to the ALIGN-CCUS project is aimed at bridging knowledge gaps as well as reducing HSE, technical and financial risks of technology upscaling.
In the 2019-20 ALIGN-CCUS campaign at TCM, flue gas from Equinor’s combined cycle gas turbine (CCGT) plant in Mongstad was treated with the aqueous 2-amino-2-methylpropan-1-ol (AMP) / piperazine (PZ) (CESAR 1) solvent. The CESAR 1 solvent was selected due to its lower energy consumption and higher stability as compared to MEA. Among the topics of the study were emission control and monitoring as well as solvent consumption. The main goal of the campaign was to demonstrate that this advanced amine solvent can be used at a large scale and with a real flue gas.
Results from the ALIGN-CCUS project are in the open domain, and we are herein reporting, for the first time, atmospheric emission data of AMP, PZ and their degradation products.
2. Method
The ALIGN-CCUS 2019-2020 campaign was carried out at TCM from September 12, 2019 to January 10, 2020. Flue gas from Equinor’s CCGT plant in Mongstad was treated in TCM’s amine plant operating with the CESAR 1 solvent. The chemical-analytical set-up to measure atmospheric emissions of amines, amine impurities and amine degradation products is described in detail in a companion paper [5]. Herein, we only use the data collected with an online Proton-Transfer-Reaction Time-of-Flight Mass Spectrometer (PTR-TOF-MS) [3]. The calibration of AMP and PZ is also described in the companion paper. Formaldehyde, acetaldehyde and acetone as well as acetonitrile were calibrated using a dynamically diluted calibration gas standard (Apel-Riemer Environmental, Inc., Miami, FL, USA). All other compounds are reported as acetone-equivalents, i.e. the acetone response factor was used for signal quantification. Reported volume mixing ratios have an accuracy of ±10% for calibrated compounds, and ±50% for compounds reported as acetone-equivalents.
3. Results and discussion
3.1 Atmospheric emissions of AMP and PZ
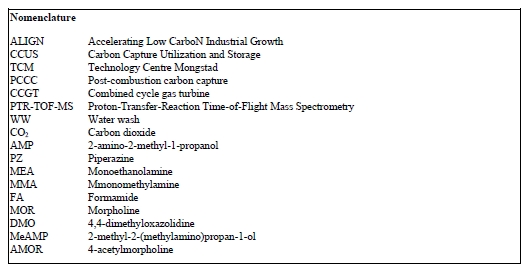
Figure 1 shows the distribution of AMP and PZ volume mixing ratios, respectively, as measured during the 2019- 2020 ALIGN-CCUS campaign at TCM. Mean and median AMP levels emitted were 562 and 377 ppb, respectively. PZ emissions were much lower, with mean and median levels being 6.0 and 0.4 ppb, respectively. The mean value is significantly higher than the median value because of sporadic PZ bursts. No experimental data are available in the open literature to compare our data with. Kolderup et al. [6] carried out modeling simulations and estimated total AMP and PZ emissions in the 0.55 – 30 ppm range. The AMP levels observed in this study were similar to MEA levels found in previous work at TCM [7, 4, 8]. Notably, AMP emissions were typically three orders of magnitude higher than PZ emissions. Khakharia et al. [9] reported an AMP-to-PZ emission ratio of 26, while Mertens et al. [10] found two orders of magnitude higher AMP emissions as compared to PZ. This discrepancy cannot be explained by the AMP-to-PZ-ratio in the solvents (3 M AMP and 1.8 M PZ in the Mertens et al. study [10]; 3.6 M AMP and 0.9 M PZ in the Khakharia et al. study [9]; 3 M kg-1 AMP and 1.5 M kg-1 PZ in the CESAR 1 solvent). The low PZ emission levels observed during the ALIGN-CCUS campaign can be explained by a low entrainment rate of PZ into the gas phase and/or more efficient scrubbing of PZ in the water wash sections.
3.2 Atmospheric emissions of amine degradation products and impurities
10 amine degradation products and 1 solvent impurity were emitted to the atmosphere with a mean and median volume mixing ratio above 1 ppb during the ALIGN-CCUS 2019-2020 campaign (Figure 2). Three small carbonyl species (formaldehyde, acetaldehyde, acetone) were emitted at levels of tens to hundreds of ppb, with acetone reaching the highest levels. It was observed previously [12, 13] that acetone is a major decomposition product of an aqueous AMP/PZ blend. Seven of the remaining species that were emitted to the atmosphere included one nitrogen atom: monomethylamine (MMA), formamide (FA), morpholine (MOR), 4,4-dimethyloxazolidine (DMO), 2-methyl-2- (methylamino)propan-1-ol (MeAMP), and 4-acetylmorpholine (AMOR). The remaining compound has a molecular sum formula of C8H14N2, which we tentatively assign to an alkylated imidazole or pyrazole. Notably, MMA was emitted at a mean level of almost 20 ppb. Wang [12] expected MMA to be formed from AMP degradation but did not detect it. Wang [12] also observed the formation of formamide when exposing AMP to UV radiation. MeAMP is a common impurity of AMP and DMO has been observed as a decomposition compound in the liquid phase [12]. But so far, they have not been reported as being released to the atmosphere. MOR, AMOR and C8H14N2 have not been reported previously. It is also noteworthy that 1-nitrosopiperazine was detected in the emitted flue gas. A tentative quantification puts emission levels well below 1 ppb, but more calibration work is needed for quantifying nitrosamines.
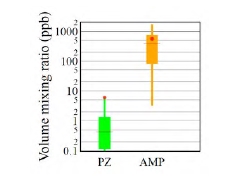
Fig. 1. Distribution of volume mixing ratios of PZ and AMP emitted to the atmosphere when flue gas from Equinor’s CCGT plant in Mongstad was scrubbed of CO2 in TCM’s amine plant operating with the CESAR 1 solvent. Boxes represent 25th and 75th percentiles, the horizontal line is the median, the dot is the mean, and whiskers represent 5th and 95th percentiles.
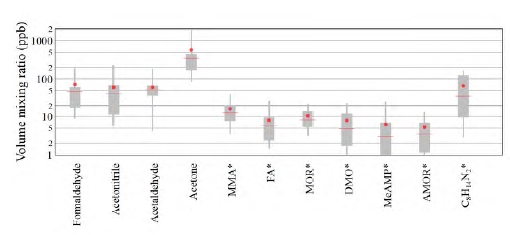
Fig. 2. Distribution of the 10 amine degradation products and 1 solvent impurity (MeAMP) that were emitted to the atmosphere with a mean level. > 1 ppb. Boxes represent 25th and 75th percentiles, the horizontal line is the median, the dot is the mean, and whiskers represent 5th and 95th percentiles. Compounds marked with an asterisk (*) are reported as in acetone-equivalent mixing ratios (see text).
3.3 Impact of the operational parameters of the plant
The operating parameters of the amine plant obviously influence the level of emissions. Mertens et al. [10] found that emissions depend upon the flue gas temperature and the temperature gradient over the water wash (WW) section. Our initial analysis thus focused on the effect of these two parameters on atmospheric emissions. Figure 3 (upper panel) shows that high (>5 ppm) AMP emissions were associated with high (>38 °C) flue gas temperatures. Figure 3 (lower panel) on the other hand shows that high AMP emissions only occurred when the temperature gradient between the two WW sections was low. Emissions of PZ and degradation products exhibited similar trends. More details will be disclosed in a forthcoming paper.
Our findings are thus in agreement with the observations by Mertens et al. [10], and this information may be used to mitigate emissions from amine plants. Previous work [9, 11] has, however, also shown that other parameters such as solvent temperature, pH and CO2 content significantly impact atmospheric emissions. The effect of additional parameters will be investigated in future work.
Finally, we would like to point out that the results shown here were obtained when the amine plant was operated with flue gas from the CCGT plant. This flue gas has a low acidic content, which prevents the formation of aerosol particles (“mist”) in the absorber column. Currently ongoing studies indicate that emission profile changes significantly when the amine plant runs on the other flue gas available at TCM, which is from the Residue Fluid Catalytic Cracker (RFCC). The results from these ongoing studies will be presented in future work.
Fig. 3. Scatter plots of AMP emissions versus flue gas temperature (upper panel) and AMP emissions versus the temperature gradient over the water wash sections (lower panel). Data associated with flue gas temperatures below 25 °C were not included in the analysis. Such low temperatures only occur during the plant warm-up and not during regular plant operation.
Conclusions
We herein report, for the first time, the levels of AMP and PZ as well as of their degradation products that are emitted into the atmosphere from a PCCC plant, which was operated on the CESAR 1 solvent. Significant emissions of AMP and of two small reactive carbonyls (formaldehyde, acetaldehyde) will need to be considered in any atmospheric impact assessment study, while minor emissions of other degradation products (in particular of 1- nitrosopiperazine) warrant further investigations. We also characterized the impact of specific plant parameters on emissions and found that high (>5 ppm) AMP emissions were associated with a high flue gas temperature (>38 °C) and small temperature gradient between the two water wash sections. A more in-depth analysis of the collected data will allow us to give recommendations for mitigating emissions from amine-based PCCC plants operating on the advanced CESAR 1 solvent.
Acknowledgements
ACT ALIGN-CCUS Project No 271501. This project has received funding from RVO (NL), FZJ/PtJ (DE), Gassnova (NO), UEFISCDI (RO), BEIS (UK) and is co-funded by the European Commission under the Horizon 2020 programme ACT, Grant Agreement No. 691712 (www.alignccus.eu).
The authors gratefully acknowledge the staff of TCM DA, Gassnova, Equinor, Shell and TotalEnergies for their contribution and work at the TCM DA facility. The authors also gratefully acknowledge Gassnova, Equinor, Shell, and Total as the owners of TCM DA for their financial support and contributions.
References
- Nielsen CJ, Herrmann H, and Weller C. Atmospheric chemistry and environmental impact of the use of amines in carbon capture and storage (CCS). Chem. Soc. Rev., 41 :6684–6704, 2012.
- SEPA Scottish Environment Protection Agency. Review of amine emissions from carbon capture systems. Stirling, UK, pages 1–86, 2015.
- Zhu L, Schade G, and Nielsen CJ. Real-time monitoring of emissions from monoethanolamine-based industrial scale carbon capture facilities. Environmental science & technology, 47, 11 2013.
- Morken A, Pedersen S, Kleppe ER, Wisthaler A, Vernstad K, Ullestad Ø, Flø NE, Faramarzi L, and Hamborg ES. Degradation and emission results of amine plant operations from MEA testing at the CO2 Technology Centre Mongstad. Energy Procedia, 114:1245–1262, 07 2017.
- Languille B, Drageset A, Mikoviny T, Zardin E, Benquet C, Ullestad Ø, Aronson M, Kleppe ER, Wisthaler A. Best practices for the measurement of 2-amino-2-methyl-1-propanol, piperazine and their degradation products in amine plant emissions, 15th International Conference on Greenhouse Gas Control Technologies, GHGT-15, 15th 18th March 2021 Abu Dhabi, UAE
- Kolderup H, Silva E, Mejdell T, Tobiesen A, Haugen G, Hoff KA, Josefsen K, Strøm T, Furuseth O, Hanssen KF, Wirsching H, Myhrvold T, and Johnsen K. Emission reducing technologies amine. SINTEF Materials and Chemistry, pages 1 – 123, 2011.
- Morken A, Nenseter B, Pedersen S, Chhaganlal M, Feste JK, Tyborgnes RB, Ullestad Ø, Ulvatn H, Zhu L, Mikoviny T, Wisthaler A, Cents A, Bade O, Knudsen J, Koeijer G, Pedersen OF, and Hamborg ES. Emission results of amine plant operations from MEA testing at the CO2 Technology Centre Mongstad. Energy Procedia, 63: 6023–6038, 12 2014.
- Zhu L, Mikoviny T, Morken AK, Tan W, and Wisthaler A. A compact and easy-to-use mass spectrometer for online monitoring of amines in the flue gas of a post-combustion carbon capture plant. International Journal of Greenhouse Gas Control, 78:349 – 353, 2018.
- Khakharia P, Brachert L, Mertens J, Anderlohr C, Huizinga A, Fernandez ES, Schallert B, Schaber K, Vlugt TJH and Goetheer E. Understanding aerosol based emissions in a post combustion CO2 capture process: Parameter testing and mechanisms. International Journal of Greenhouse Gas Control, 34:63 – 74, 2015.
- Mertens J, Knudsen J, Thielens ML, and Andersen J. On-line monitoring and controlling emissions in amine post combustion carbon capture: A field test. International Journal of Greenhouse Gas Control, 6:2–11, 01 2012.
- Fulk SM and Rochelle GT. Quantification of gas and aerosol-phase piperazine emissions by FTIR under variable bench-scale absorber conditions. Energy Procedia, 63:871 – 883, 2014. 12th International Conference on Greenhouse Gas Control Technologies, GHGT-12.
- Wang T. Degradation of Aqueous 2-Amino-2-methyl-1-propanol for Carbon Dioxide Capture. PhD thesis, 2013.
- Wang T and Jens KJ. Oxidative degradation of aqueous PZ solution and AMP/PZ blends for post-combustion carbon dioxide capture. International Journal of Greenhouse Gas Control, 24:98 – 105, 2014.