
6. Ambient Measurements of Amines by PTR-QiTOF: Instrument Performance Assessment and Results from Field Measurements in the Vicinity of TCM, Mongstad (2016)
Tomáš Mikovinya, Claus J. Nielsena, Wen Tana, Armin Wisthalera*, Liang Zhua, Anne Kolstad Morkenb, Terje Niøten Nilsenb
aDepartment of Chemistry, University of Oslo, P.O. Box 1033 Blindern, 0315 Oslo, Norway bCO2 Technology Centre Mongstad (TCM DA), 5954 Mongstad, Norway *Corresponding author

© 2017 The Authors. Published by Elsevier Ltd. This is an open access article under the CC BY-NC-ND license. Peer-review under responsibility of the organizing committee of GHGT.
Abstract
A PTR-QiTOF instrument was deployed in the field in the vicinity of the CO2 Technology Center Mongstad (TCM) for measuring amines in ambient air. The observed single-to-double-digit pptv levels of dimethylamine (DMA) and trimethylamine (TMA) are comparable to natural background values reported in the literature for these species. No indication was found that these small alkylamines stem from industrial activities at Mongstad. Monoethanolamine (MEA) was observed at single-digit pptv levels, but further analytical work is needed to validate measurements at such low concentrations. No indication was found that small enhancements in ambient MEA levels were caused by emissions from TCM. No other industrial amines (2-amino-2- methylpropanol, diethylamine and piperazine) were detected in ambient air. According to the current state of knowledge, the observed levels of amines pose no harm to human health or the environment.
1. Introduction
Amine-based capture of carbon dioxide (CO2) results in the release of trace amounts of amines to the atmosphere. While amines are nowadays routinely monitored in stack gas, the detection of amines under highly diluted atmospheric conditions remains an analytical challenge [1]. Proton-Transfer-Reaction Mass Spectrometry (PTR-MS) has been successfully used for on-line monitoring of amines in stack gas [2,3] and in atmosphere simulation chambers [4,5,6]. Recently, the ultra-sensitive proton-transfer-reaction quadrupole ion guide time-of-flight mass spectrometer (PTR-QiToF-MS) has become available [7], which is capable of detecting trace gases at single-digit pptv levels (1 pptv = 1 pmol mol-1 = 10-12 v/v). In the present study, we have used this novel analytical tool for carrying out exploratory measurements of amines in ambient air in the vicinity of the CO2 Technology Centre Mongstad (TCM).
2. Methods
Ambient air measurements were carried out at Sunsbø (60°46’10.1″N, 5°09’08.6″E), Sande (60°50’56.6″N, 5°00’21.0″E) and Mongstad West (60°48’45.7″N, 5°00’43.4″E) from Aug 6 – 28, Aug 28 – Sept 10 and Sept 10 – 25, 2015, respectively. The geographic location of the three measurement sites and of TCM is shown in Figure 1.
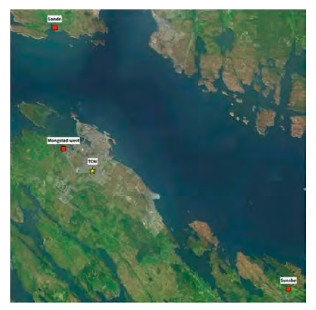
Fig. 1. Geographical map showing the locations of the measurement sites at Sunsbø, Sande and Mongstad West and of the Technology Center Mongstad (TCM).
PTR-MS is an on-line chemical ionization (CI) technique for atmospheric trace gases that has been routinely deployed in atmospheric chemistry field studies over the past decade [8]. Only recently, the ultra-sensitive PTR- QiTOF-MS instrument version has become available which detects gaseous analytes at single-digit pptv-levels [7].
We operated the PTR-QiTOF instrument in the routine mode of operation recommended by the manufacturer (H3O+ CI; drift tube pressure 3.8 mbar, drift tube temperature 60 °C, reduced electric field strength 120 Td with 1 Td = 10-17 V cm2). Mass spectra were recorded in the m/z 15 to m/z 510 range, but only selected signals corresponding to protonated methylamine, dimethylamine (DMA) and ethylamine, trimethylamine (TMA), monoethanolamine (MEA), 2-amino-2-methylpropanol (AMP), diethylamine and piperazine, respectively, were analyzed in detail. The list of target amines was taken from a previous study [1]. The PTR-TOF Data Analyzer v4.44 was used for data analysis [9]. 2-minute and 1-hour averages were generated from the data output.
An optimized inlet system was used for minimizing inlet losses of amines. Ambient air was sampled at a flow rate of 12 liters per minute trough a passivated stainless steel tube (material: SilcoNert® 2000, outer diameter: 6.35 mm, length: 115 cm, temperature: 60 °C). The PTR-QiTOF instrument sub-sampled a flow of 0.5 liters per minute through a heated capillary (material: PEEK, outer diameter: 1.59 mm, temperature: 60 °C). No evidence for inlet losses was found when ambient air was spiked with known amounts of DMA and TMA at pptv levels.
Amine-free air generated from compressed and catalytically cleaned (Pt/Pd at 325 °C) ambient air was periodically (every 12 hours for 30 minutes) fed to the inlet system for instrumental background determination.
Instrumental response factors for DMA, TMA and MEA were calculated from ion-molecule reaction kinetics using the molecular properties reported previously [4,5,6]. The estimated accuracy of the reported volume mixing ratios is ±20% for volume mixing ratios above 10 pptv.
TCM is part of a large industrial complex (refinery, power plant, oil terminal) at Mongstad which is located in a pristine coastal environment. Oil and gas tracers were used for distinguishing between periods when the outflow from the Mongstad complex was advected to the sampling sites and periods when natural background air was sampled. TCM was in operation during the ambient air measurement campaign, with MEA being used for CO2 capture.
3. Results
AMP, diethylamine and piperazine were not detected at levels above 10 pptv in the recorded mass spectra. It was not possible to measure these species at single-digit pptv levels due to mass spectral interferences. The PTR-QiTOF instrument, in its routine mode of operation, was not capable of detecting methylamine. The abundant O + signals distorted the mass spectrum in the region where methylamine is detected.
The hourly average time series of DMA, TMA and MEA are shown in Figures 2a, 2b and 2c, respectively. The color-coded data points identify the time periods when the outflow from the Mongstad industrial complex was advected to the sampling site.
DMA was observed at single-digit pptv levels, which is at or close to the instrumental detection limit. The detection of amines at such low concentrations is an analytical challenge and all single-digit pptv data reported herein should be taken with caution. More analytical validation work is needed in this concentration regime. The 2- minute average data show episodic short-term enhancements in the 10 to 22 pptv range at all three measurement sites. These enhancements were found both in natural background air and in the outflow from the Mongstad complex.
TMA levels were typically close to zero, with the exception of an episode lasting from Sept 1 to 12 when hourly average volume mixing ratios up to 49 pptv were recorded. Enhanced levels of TMA were observed at the Sande and the Mongstad West site, both in natural background air and in the outflow from the industrial site.
MEA levels were also in the single-digit pptv range. Yet again, these concentrations should be interpreted with caution. A 1-2 pptv enhancement was observed in the period from Aug 31 to Sept 10, both in natural background air and in the Mongstad outflow. This comes as a surprise as MEA is not believed to have natural sources. Further research is warranted to confirm these findings and exclude potential signal interferences for MEA.
The time series data indicate that amine levels were not enhanced in the Mongstad outflow as compared to natural background conditions. This is also reflected in the overall statistical analysis summarized in Table 1.
4. Discussion and Conclusions
A PTR-QiTOF instrument was successfully deployed in the field for the first time to measure amines in ambient air. The observed single-to-double-digit pptv levels of DMA and TMA are comparable to coastal background values reported in the literature for these species [10]. No indication was found that these small alkylamines stem from industrial activities at Mongstad. According to the current state of knowledge, the observed levels of alkylamines pose no direct or indirect harm to human health or the environment.
TCM was operating on MEA during the ambient measurements. Single-digit pptv levels of MEA were observed in ambient air, but no indications were found that these small enhancements were caused by emissions from TCM. Further analytical work is, however, needed to validate MEA measurements at such low concentrations. No other industrial amines (AMP, diethylamine and piperazine) were detected.

Fig. 2. Hourly average time series of DMA, TMA and MEA amine as measured at Sunsbø, Sande and Mongstad West in August and September of 2015. The color-coded data points identify the time periods when the Mongstad outflow was advected to the sampling sites.
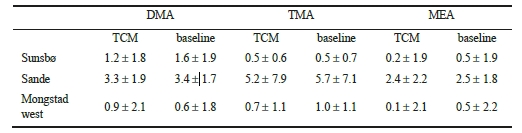
Table 1. Average mixing ratios (in pptv) of DMA, TMA and MEA as observed at the Sunsbø, Sande and Mongstad West sites, respectively, when the Mongstad plume was advected and under natural background conditions. No statistically significant enhancement of amines was found in the outflow from the Mongstad industrial complex as compared to natural background conditions.
References
- Vik AF, Rostkowski P. Amines in ambient air at TCM – Monitoring program May 2012 – April 2013, NILU Report OR 31/2015 (2015)
- Zhu L, Schade GW, Nielsen CJ. Real time monitoring of emissions from monoethanolamine-based industrial scale carbon capture facilities. Environ Sci Technol. 2013; 47, 14306-14314
- Morken AK, Nenseter B, Pedersen S, Chhaganlal M, Feste JK, Tyborgnes RB, Ullestad Ø, Ulvatn H, Zhu L, Mikoviny T, Wisthaler A, Cents T, Bade OM,GKnudsen J, de Koeijer G, Falk-Pedersen O, Hamborg ES. Emission results of amine plant operations from MEA testing at the CO2 Technology Centre Mongstad. Energy Procedia 2014; 63, 6023–6038
- Nielsen CJ, D´Anna B, Bossi R, Bunkan AJC, Dithmer L, Glasius M, Hallquist M, Hansen AMK, Lutz A, Salo K, Maguta MM, Nguyen Q, Mikoviny T, Müller M, Skov H, Sarrasin E, Stenstrøm Y, Tang Y, Westerlund J, Wisthaler A. Atmospheric Degradation of Amines (ADA). Summary report from atmospheric chemistry studies of amines, nitrosamines, nitramines and amides, University of Oslo, Oslo, Norway 2012; ISBN 978-82-992954-7-5, http://urn.nb.no/URN:NBN:no-30510
- Nielsen CJ, D’Anna B, Karl M, Aursnes M, Boreave A, Bossi R, Bunkan AJC, Glasius M, Hansen AMK, Hallquist M, Kristensen K, Mikoviny T, Maguta MM, Müller M, Nguyen Q, Westerlund J, Salo K, Skov H, Stenstrøm Y, Wisthaler A. Atmospheric Degradation of Amines (ADA). Summary report: Photo-oxidation of methylamine, dimethylamine and trimethylamine, NILU Report OR 2/2011
- Nielsen CJ, D’Anna B, Dye C, George C, Graus M, Hansel A, Karl M, King S, Musabila M, Müller M, Schmiedbauer N, Stenstrøm Y, Wisthaler A. Atmospheric Degradation of Amines (ADA). Summary report: Gas phase photo-oxidation of 2-aminoethanol (MEA), NILU Report OR 8/2010
- Sulzer P, Hartungen E, Hanel G, Feil S, Winkler K, Mutschlechner P, Haidacher S, Schottkowsky R, Gunsch D, Seehauser H, Striednig M, Jürschik S, Breiev K, Lanza M, Herbig J, Märk JL, Märk TD, Jordan A. A Proton Transfer Reaction-Quadrupole interface Time-Of-Flight Mass Spectrometer (PTR-QiTOF): High speed due to extreme sensitivity. Int J Mass Spectrom 2014; 368:1–5
- De Gouw J, Warneke C. Measurements of volatile organic compounds in the earth’s atmosphere using proton-transfer-reaction mass spectrometry, Mass Spectrom Rev 2007; 26, 2:223–257
- Müller M, Mikoviny T, Jud W, D’Anna B, Wisthaler A. A new software tool for the analysis of high resolution PTR-TOF mass spectra, Chemom Intell Lab Syst 2013; 127:158–165
- Ge X, Wexler AS, Clegg SL. Atmospheric amines – Part I. A review, Atmos Environ 2011; 45:524-546