TCM
 

Results from testing of a Brownian diffusion filter for reducing the aerosol concentration in a residual fluidized catalytic cracker flue gas at the Technology Centre Mongstad (2018)

Gerard Lombardoa,c*, Muhammad Ismail shaha,c, Berit Foståsb, Odd Arne Hvidstenb,c, Leila Faramarzib,c, Thomas de Cazenovec, Hélène Lepaumierd, Pieter Rogiersd

aGassnova SF, Dokkvegen 10, 3920 Porsgrunn, Norway bEquinor ASA, PO Box 8500, 4035 Stavanger, Norway cTechnology Centre Mongstad, 5954 Mongstad, Norway dLaborelec, Rodestraat 125, 1630 Linkebeek, Belgium *Corresponding author

Operation of amine absorbers with a flue gas containing sulfuric acid aerosols and dust particles is a challenge. After the installation of a Brownian diffusion filter upstream the absorber the aerosols are reduced and TCM has been able to operate the amine plant with the residual fluidized catalytic cracker flue gas. The Brownian diffusion filter efficiency is assessed based on  the number particle concentration and aerosol size distribution. The tests at TCM demonstrate that more than 95 % of the  aerosols were removed. The growth of the aerosols with moisture from the flue gas is fast and is not detected by the instrumentation installed at TCM. The water captured by the Brownian diffusion filter confirms that the mass concentration of  the aerosols captured is between 1000 and 5000 mg/Sm3 of flue gas.

1.  Introduction

The Technology Centre Mongstad (TCM) is the world’s leading facility for verifying and improving CO2 capture technologies. TCM is located at Mongstad, one of Norway´s most complex industrial facilities. TCM has been operating since autumn 2012, providing an arena for qualification of CO2 capture technologies on an industrial scale. In autumn 2017, Gassnova (on behalf of the Norwegian state), Equinor (formerly Statoil), Shell and Total entered into a new ownership agreement securing operations at TCM until 2020. The owners of TCM started their most recent monoethanolamine (MEA) test campaign in June 2017 where a large number of public, industrial, research and academic stakeholders were involved [1]. The campaign included demonstration of a model-based control system, dynamic operation of the amine plant, investigating amine aerosol emissions and specific tests targeted at reducing the cost of CO2 avoided. Through the testing, both flue gas sources currently available at TCM were used. These sources are the combined cycle gas turbine (CCGT) based heat and power plant (CHP) and the residual fluidized catalytic cracker (RFCC). They provide flue gases with a wide range of properties and a CO2 content from 3.6 to 14 %. TCM is located next to the Equinor refinery in Mongstad. The Mongstad refinery is the source of both flue gases supplied to TCM.

During the MEA campaigns in 2017 and 2018 TCM executed a series of tests to capture CO2 from residual fluidized catalytic cracker flue gas. It was first of its kind test campaigns at TCM where CO2 is captured from RFCC flue gas treated with a Brownian diffusion filter. A previous MEA test campaign was conducted while capturing CO2 from combined cycle gas turbine flue gas mixed with RFCC flue gas and recycled CO2. A pilot Brownian diffusion filter was tested in this previous campaign. Results of the previous campaign are documented at the GHGT-13 [2]. The new learning’s related to the Brownian filter efficiency and aerosol properties are reported in this paper. These learning’s are valuable for the design of flue gas treatments upstream or downstream of amine absorbers. The impact of flue gas pretreatment by the BD filter on the MEA emissions is reported separately [3].

2. Process description

In December 2016, a Brownian diffusion filter was installed between the RFCC direct contact cooler (DCC) and the amine absorber. The vessel for the Brownian diffusion Filter includes a high efficiency demister and twenty-one filters filled with fibers typically called candles. A simplified sketch of the BD filter unit is given in the figure 1.


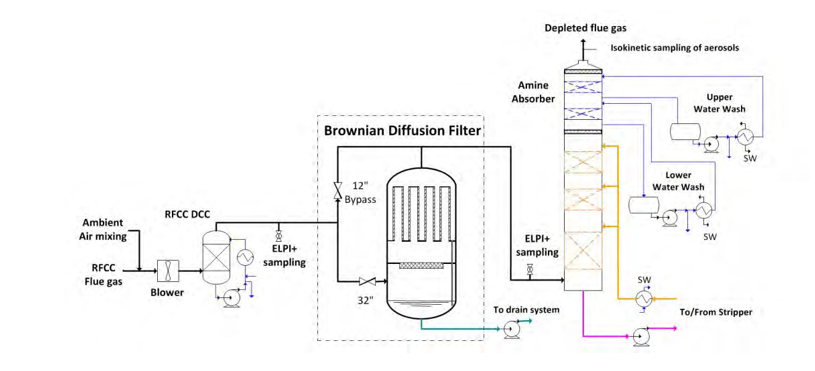
Figure 1. Simplified flow diagram of the Brownian diffusion Filter.

A detailed description of the BD filter unit is given in the following sections.

2.1 Functional description of the BD filter and design capacity

The main design parameters are:

  • Design flue gas flow rate: 35,000 Sm3/h
  • Maximum allowable differential pressure of the demister: 12 mbar
  • Maximum allowable differential pressure of the candles: 30 mbar

Based on the operation experience acquired since the installation of the filter, a maximum RFCC flue gas flow of 40,000 Sm3/h to 45,000 Sm3/h is possible but the filter efficiency is slightly reduced.

The particles are captured by fibers and each particle captured grows by further accumulation until droplets are formed. When the weight of the droplets is sufficient, a water film occurs, flowing down to the bottom of the candles. During operation, the candles are partly filled with the water accumulated. The liquid collected downstream the candles is drained to the bottom of the vessel. A pump controls the level of the vessel.

2.2 Typical aerosol description at TCM

The table 1 describes the total number concentration and weight concentration of aerosols in the flue gas.


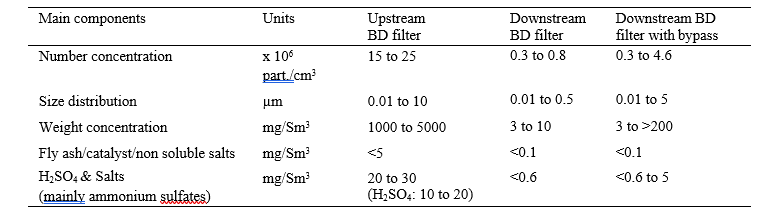
Table 1. Typical aerosol parameters at TCM.
 

Upstream the filter, the RFCC flue gas contains a high number of particles between 10 nm and over 5 µm diameter, and the composition is expected to be similar to the flue gas from a coal power plant without fabric filters. As illustrated in figure 2 the particle size distribution is variable upstream the BD filter. The variation of aerosol size distribution is caused by the fluctuations of the operation parameters of the refinery and mainly by the steam injection in the flue gas upstream of the RFCC DCC. At TCM, the steam injection is necessary in order to keep the temperature and moisture constant in the flue gas. The size distribution of the RFCC flue gas has been checked during several campaigns, before the installation of the BD filter, upstream and downstream the RFCC DCC and downstream of the absorber. The similarity between the measured size distributions suggests that a BD filter may be also applicable at the absorber outlet.

The flue gas composition downstream the candles at TCM is expected to be similar to coal flue gas treated with a conventional electrostatic precipitator and an additional flue gas purification unit as a fabric filter or advance purification systems as a wet electrostatic precipitator (WESP). The BD filter bypass allows higher particle concentrations to the absorber.


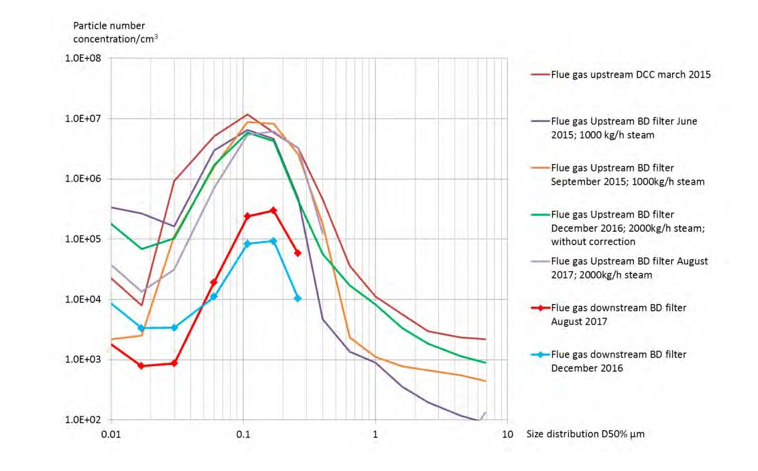
Figure 2. Typical size distribution upstream and downstream the BD filter.

2.3 Installation and mechanical design of the candles

The entire vessel including candles and demister is designed and delivered by Begg Cousland Envirotec Limited (United Kingdom). The candles are fixed to a main support plate as described in figure 3. The flue gas inlet is located at the bottom of the vessel, upstream of the demister and the flue gas is distributed to each candle through the openings in the main support plate.


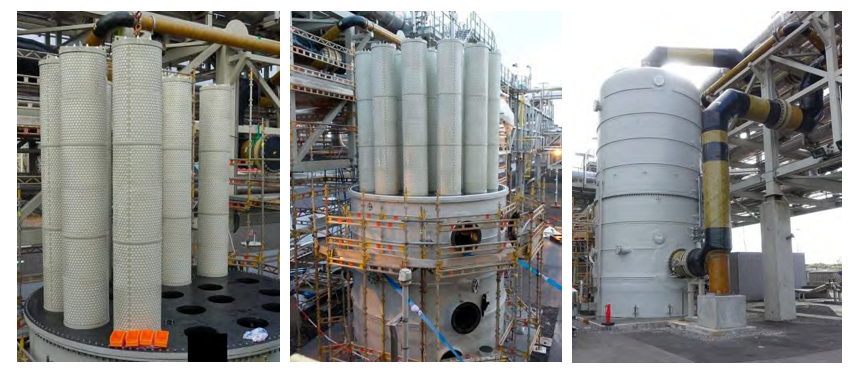
Figure 3 Installation pictures. To the left: main support plate of the candles. To the right: the flue gas inlet is located at the bottom of the vessel.

An isometric view of the RFCC flue gas treatment system is presented in figure 4. The bypass to the filter is located in the pipe rack. In order to minimize the capture of aerosols above 1 µm to the bypass, the connection of the bypass to the main duct is not isokinetic (branch tee) and the velocity to the bypass is low compared to the main flow to the filter.


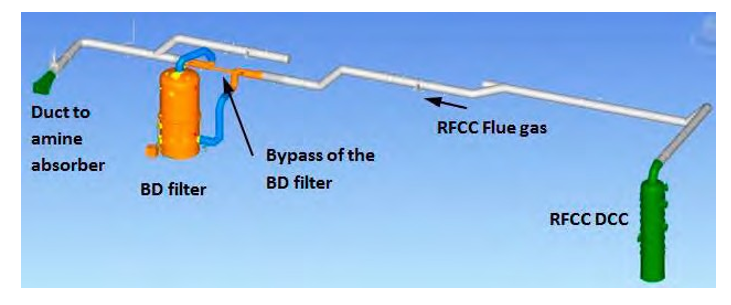
Figure 4. Isometric view of the RFCC flue gas treatment system.

2.4 Candle description

The thickness of the candle bed fibers is 50 mm and the total filtration area of the 21 candles is 135 m2. The inlet velocity to the filtration area is 7.2 cm/s. The design is optimized, based on the results from the pilot tests from various fiber types and suppliers.

The capture efficiency of the BD filter is approximately 97 % of the particle number based on 35,000 Sm3/h of flue gas with 20 x 106 particles/cm3. The number concentration downstream the candles is 0.3 x 10⁶ particles/cm3 with clean candles and 0.7 x 10⁶ particles/cm3 with used candles. The capture efficiency of the particles with a diameter between 10 nm and 70 nm is decreasing with higher flue gas flow. The life span of the candles may be reduced by the accumulation of catalyst particles. The life span of the candles shall be confirmed by further tests at TCM.

2.5 Installation and mechanical design of the demister

The demister installed upstream the candles is described in figure 5. The purpose of the demister is to minimize the catalyst particles accumulation in the candles. A Scanning Electron Microscopy with an Energy Dispersive X- ray spectrometer (SEM-EDX) was used to measure the elemental composition of the deposits and catalyst in the aerosols. As the catalyst particles are mainly detected in aerosols of 1 µm or above, a high efficiency demister is required.


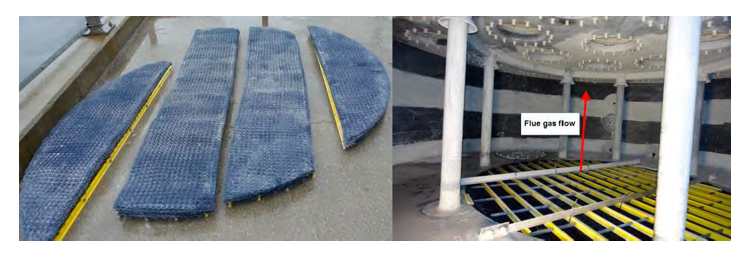
Figure 5. High efficiency demister. To the left: demister pads disassembled for cleaning operation. To the right: the demister pads are located under the yellow support grid. The candle support plate with the openings to the candles is visible at the top of the picture.

The demister is 2.45 m diameter, 120 mm thick and includes several diverse layers of polypropylene mesh. The demister is arranged in five sections and each section divided in a lower and upper bundle. The inlet velocity to the demister is 2 m/s. A demister is usually designed to remove liquid particles, but at TCM the demister is operated with catalyst particles and the demister requires periodic cleaning. At 35,000 Sm3/h, the mass of catalyst particles captured in the vessel is between 1 and 2.5 kg/day. Dry or accumulated catalyst particles require a disassembling of the demister and a manual cleaning with pressurized water. A cleaning is typically performed after a campaign period of 2 months. The operation parameters of the demister are critical in order to avoid dry areas and accumulation of catalyst. The accumulation of catalyst is likely limited at high water load and flooding conditions in the demister bed. A complete spare part of the demister is available at TCM in order to minimize the shutdown period during cleaning operation. A shutdown of 4 to 6 hours is usually necessary for a replacement of the demister.

3. Campaigns and test summary

A brief overview of the different tests conducted is given below and test results are detailed out in the following sections.

  • From 16 to 22 December 2016: BD filter start-up/test and efficiency measurements with the use of ELPI+ (Electrical low pressure impactor: refer to section 6)
  • From 24 to 30 January 2017: pressure drop tests of BD filter
  • From 21 February to 25 April 2017: BD filter tests and proprietary solvent campaign with RFCC flue gas
  • From 24 July to 17 November 2017: BD filter tests, MEA 3 test campaign and efficiency measurements with the use of ELPI+

4. Demister and Candle filter pressure drop

The pressure drop test results for are summarized in the table 2. At constant temperature and gas phase composition, the pressure drop through the candles and the demister is directly proportional to the flue gas flow and increasing with the mass of aerosols captured.


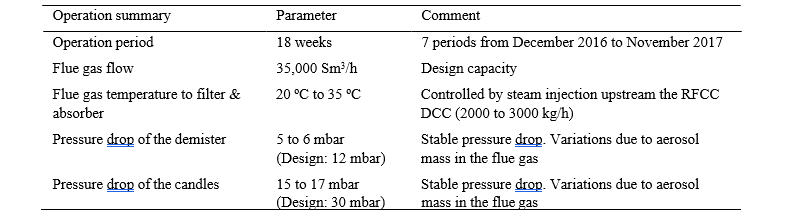
Table 2. Demister and Candle filter pressure drop

The efficiency of the demister secures a lower pressure drop of the candles than measured during the pilot tests in 2015. The water load in the demister and the accumulation of catalyst particles establish flooding conditions in the demister and high capture efficiency for aerosols above 1 µm. Due to the flooding conditions, water droplets are entrained from the demister to the candles.

The accumulation of catalyst particles in the candles is confirmed by the inspections of January, April, August and November 2017. However, the accumulation looks limited and no increase of pressure drop is observed. The  life span of the candle will be estimated during the future campaigns with RFCC flue gas.

5.  Mass of aerosols captured based on the liquid level measurements of the BD filter vessel

The mass of aerosol captured by the demister and the candles is estimated based on the liquid level measurement of the BD filter vessel.

The liquid accumulation in the filter vessel may be caused by:

  • Aerosols captured
  • Water condensation from the flue gas in the ducts and in the BD filter vessel. Based on the temperature decrease between the DCC and the inlet to the absorber, the maximum water condensation is estimated to 30 kg/h. A water condensation of 10 to 20 kg/h is confirmed during the tests with ambient air instead of flue gas.
  • Liquid entrainment from the DCC. The tests with ambient air from 20,000 Sm3/h to 55,000 Sm3/h confirm that there is no entrainment of liquid from the DCC if the flow rate is limited to 45,000 Sm3/h.

At the design flow of 35,000 Sm3/h, the estimated capture rate is summarized in the table 3. The average concentrations of sulfate salts and sulfuric acid are based on laboratory water analysis from the vessel.


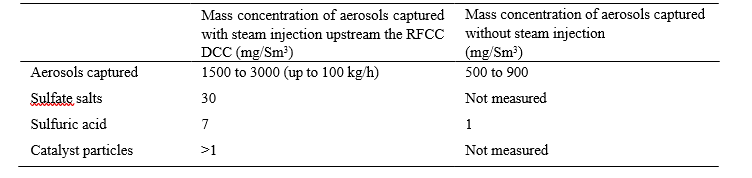
Table 3. Mass concentration of aerosols captured.

As described in the section 8, the mass concentration of water in the aerosols captured is higher than estimated with the ELPI+ measurements (50 to 500 mg/Sm3). A substantial number of aerosols with a diameter between 2 and 10 µm are necessary to explain the mass of aerosols captured in the vessel. The capture rate measured by the liquid level of the vessel confirms that the ELPI+ is not designed for the detection of large aerosols mainly composed of water. The salts and sulfuric acid concentrations are in accordance with the previous flue gas measurements between 2013 and 2015. Most of the catalyst particles are eliminated with the vessel drain and the mass cannot be estimated. A mass concentration of 1 to 3 mg/Sm3 of catalyst particles is estimated based on the previous flue gas isokinetic gravimetric sampling.

6. ELPI+ technology

6.1 Introduction

Based on weight concentration, the high efficiency of Brownian diffusion filters is well established. Most of the authority regulations are based on weight concentration and manual isokinetic sampling. The weight of aerosols under 0.5 µm is insignificant, but these aerosols may grow in the absorber, hence the efficiency based on weight is not satisfactory for amine absorbers. Therefore, the efficiency of the Brownian diffusion filter has been determined based on the particle number concentration and particle size distribution measured upstream and  downstream the BD filter unit. The particle number concentration and particle size distribution are estimated with ELPI+ measurements performed by Engie Research and Technologies.

Working principle of the ELPI+:

  1. Particle charging
  2. Size classification in a cascade impactor (14 size classes)
  3. Electrical detection with sensitive electrometers

6.2 ELPI+ description and limitations for the measurements of aerosols with high load of water

As described in the figure 6, the ELPI+ measurements require usually a dilution of the sample with dry air in order to avoid water condensation on the EPLI+ stages. The particle size distribution and number concentration may be modified by this dilution if the aerosols contain large particles with mainly water.


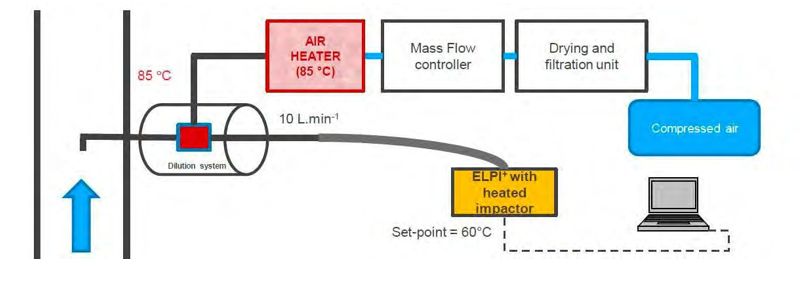
Figure 6. ELPI+ sampling system.

In the range of 10 nm to 1 µm, the ELPI+ (Electrical low pressure impactor) is applicable to estimate the efficiency of the Brownian diffusion filter based on the particles number concentration, but the impact of following limitations shall be evaluated during the measurements:

  • Impactor loading: if a measurement continues a long period or sampling is made from a high particle concentration, the high amount of collected particles can have a negative effect on the impactor performance. As a rule of thumb, 1 mg of particles per one impactor stage can be used as an absolute maximum value.
  • The sampling to the ELPI+ is not isokinetic upstream the filter. With the dilution system used, an isokinetic sampling to the ELPI+ is not reliable or complex. However, as demonstrated by previous studies [4, 5], the effect of non-isokinetic sampling of aerosols on the observed sizes is not important since most of the aerosol size is smaller than 0.5 µm.
  • Fine Particle Correction: diffusion causes the impact of the smallest particles on a too early stage, leading to an overestimation of the particle size. An algorithm is used to correct the ELPI+ readings. It is possible to calculate both uncorrected and corrected particle size distributions.
  • Aerosols above 2 µm, composed only of water are unstable and easy to evaporate. This type of aerosols may be a challenge for ELPI+ measurements.

7. Results from ELPI+ measurements just after the first startup of the BD filter

The ELPI+ measurements completed just after the first startup of the BD filter are summarized in the table 4.


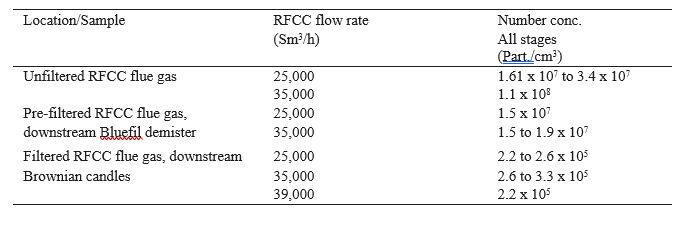
Table 4. ELPI+ measurements of December 2016.

Comments to the results:

  • Relatively large variations are measured for the RFCC flue gas, as previously observed since the first measurements in 2015: from 12 to 34 million particles/cm3
  • Due to turbulent weather conditions with outdoor sampling with the ELPI+, unstable measurements are experienced.
  • As the particles above 1 µm are not detected; the efficiency of the demister could not be demonstrated for these particles.
  • The large number of particles for the unfiltered RFCC flue gas is due to particles of 0.01 µm size.
  • As expected, the efficiency of the Brownian diffusion candle filter is decreasing at higher flow rates for the smaller aerosol diameters.

The filter performance has been demonstrated at different flue gas flow rates. Results are summarized in the table 5 below.


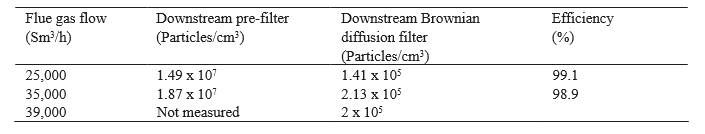
Table 5. Filter performance at start up (December 2016).

An overall efficiency of 99 % is confirmed for the particles > 20 nm. As the candles are new and not saturated with aerosols, a higher efficiency than measured during the pilot test is confirmed (Pilot test efficiency: 98 %). The efficiency is slightly decreasing at higher flue gas flow

8. Results from ELPI+ measurements in August 2017

8.1 Aerosols size distribution of the RFCC flue gas before filtration

Figure 7 shows that for all samplings, the size distribution of the RFCC flue gas before filtration is similar in the range from 0.06 to 0.2 µm. The variation of size under 0.06 µm is caused by the operation at the refinery as well as the ELPI+ sampling system, i.e. the number of small aerosols is varying with dilution effect, algorithm for small particle correction or unstable conditions. Above 0.2 µm, the particle size is increasing quickly with steam injection and temperature control of the flue gas. In addition, the ELPI+ algorithm for small particle correction removes most of the particles detected by the ELPI+.

The mass of aerosols in one cubic of flue gas could be assessed based on the ELPI+ measurements considering:

  • The number of particles and size distribution.
  • Spherical particles with 1000 kg/m3 as density.

Based on ELPI+ measurements, the mass concentration of aerosols is estimated at 20 mg/Sm3 by taking into account small particle correction and 500 mg/Sm3 without small particle correction. These values are much lower than the actual mass captured by the candles. In August 2017, the average mass concentration captured was 1600 mg/Sm3. A typical size distribution of 1600 mg/Sm3 is shown in the figure 7 and addition of 45,000 particles/cm3 above 1 µm is sufficient to simulate the missing weight. This number is negligible compared to the total number of particle measured (1.5 x 10⁷ particles/cm3).


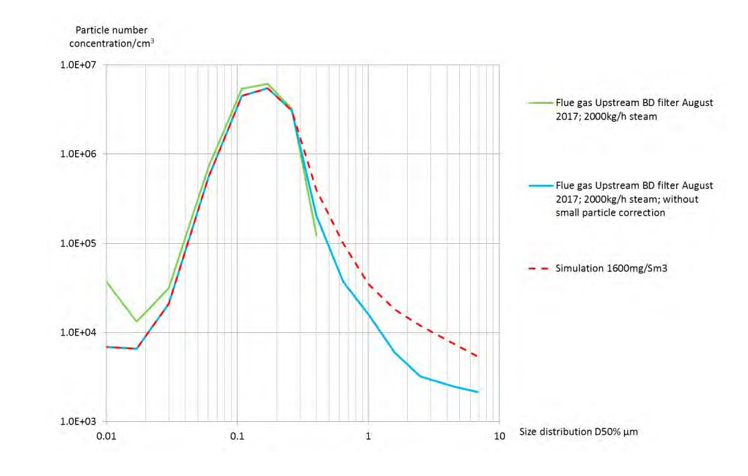
Figure 7. Summary of the measurements of the size distribution upstream the Brownian diffusion candles.

8.2 Particle number concentration of the RFCC flue gas after filtration

As summarized in tables 6, 7 and 8 in order to confirm the filter efficiency, the same test procedure for the ELPI+ measurements as in December 2016 was repeated in August 2017. The bypass of the filter and the impact to the aerosol concentration are also evaluated.


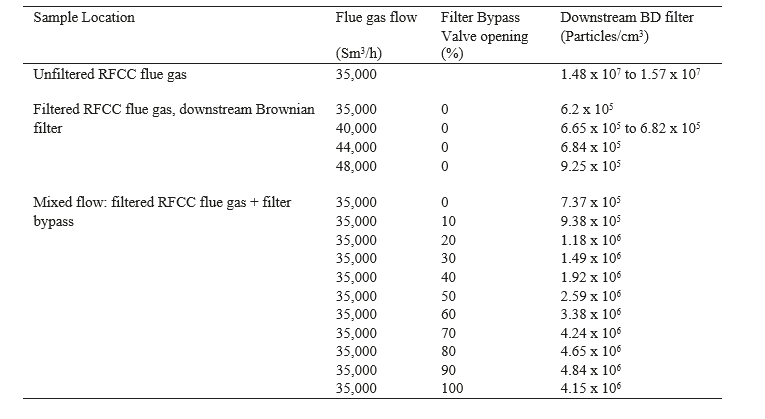
Table 6. ELPI+ measurements in August 2017 with DB filter bypass in operation. The lower particle number at 100 % opening of the bypass is likely caused by the position of the disk of the butterfly valve and a higher pressure drop.

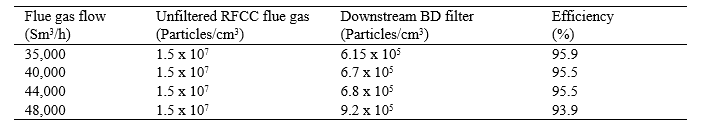
Table 7. Filter performance in August 2017

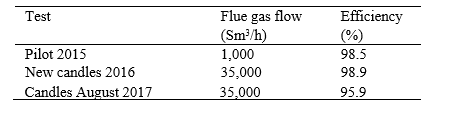
Table 8. Comparison of the filter performance to previously measured efficiencies

Comments to the efficiency results:

  • The stability of the ELPI+ measurements at the BD filter inlet is challenging and variable.
  • The inlet concentration is not checked simultaneously with the outlet concentration. The number of particles of the unfiltered RFCC flue gas is assumed based on previous measurements.
  • The mass of particles at the filter inlet is highly variable with the steam injection and the number of particles is variable with the refinery operation. Any effect of the steam injection has not been studied.

A lower efficiency after a period of operation with RFCC flue gas is experienced and may be caused by:

  • Higher water load to the candles (steam injection and variable efficiency of the demister)
  • Progressive accumulation of sulfuric acid in the new candles. The accumulation is normally stabilized by drainage of the candles after several weeks of operation.
  • Candles partially blocked by catalyst particles or non-soluble salts: the accumulation is confirmed by inspections, but does not look significant.
  • An inspection performed in 2018 confirms that a leakage occurs in the upper part of the bed for some candles. Due to gas flow, operating conditions being above the maximum design rate and the filters being overloaded with liquid being carried over from the lower demister, the fiber beds have compressed. Further tests shall be performed in 2018 after repair the fiber beds.
  • Further measurements and periodic inspections are necessary in order to estimate the life span of the candle fibers and confirm the efficiency.

9. Capacity of the BD filter bypass

The purpose of the BD filter bypass, see figures 1 and 4, is to control the aerosol concentration to the absorber in order to test the robustness of solvents for the limitation of emissions. As the flow to the DB filter bypass is not proportional to the valve opening, flue gas flow to the bypass is estimated. Methodology of the calculation is as follow:

  • The total flow to the bypass and the filter is measured and controlled by the fan velocity
  • At constant temperature and flue gas composition the gas flow rate to the filter is proportional to the pressure drop of the candles. Thus, the flow to the candles can be based on the candle pressure drop.
  • The pressure drop of the candles has been verified at various flue gas flows
  • The flow to the bypass is estimated based on the total flow and on the flow to the candles

Several tests are performed. The figure 8 describes the average gas flow to the bypass at various bypass valve opening.


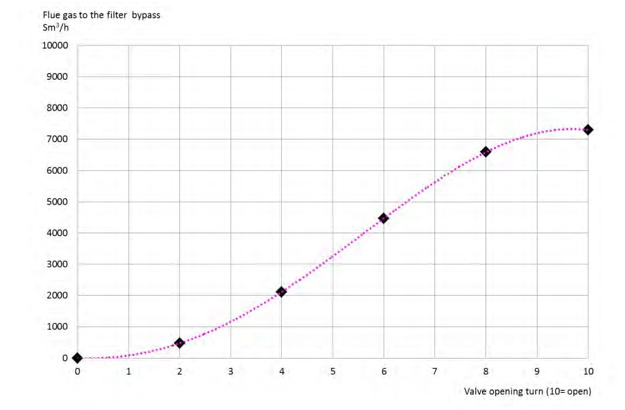
Figure 8. Flue gas flow to the bypass as a function of the butterfly valve opening. The dotted line is a polynomial trend of the test results.

As expected and confirmed by the figure 9, for aerosols under 1µm of diameter, the total particle concentration is proportional to the bypass flow. Several ELPI+ measurements are performed in order to confirm the reliability of the particle concentration in the flue gas upstream the absorber as a function of the flue gas flow to the bypass.


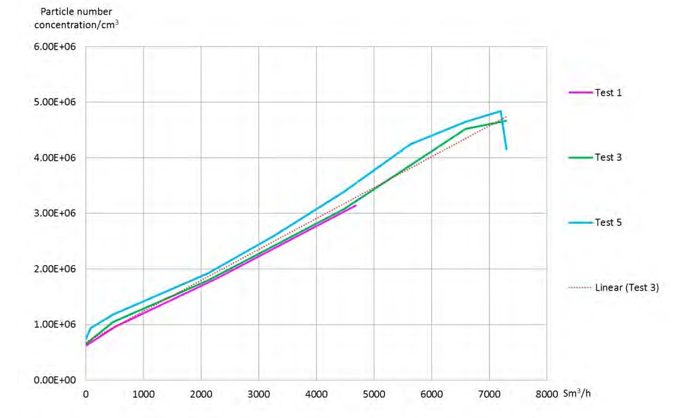
Figure 9. Flue gas flow to the bypass as a function of the particle number concentration.

Figure 10 shows a constant size distribution of the aerosols downstream the BD filter in the most of range measured by the ELPI+. No particles above 0.5 µm are measured. Without small particle correction, even if the number of large particle is overestimated, the number of particles above 0.5 µm is not significant (<1000).


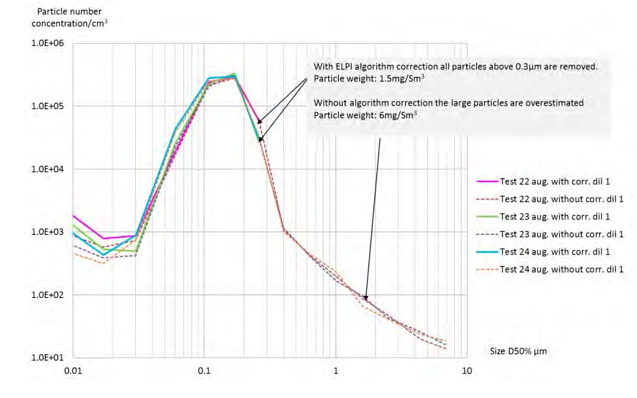
Figure 10. Particle size distribution downstream the BD filter without bypass

As shown in figure 11, the size distribution of the RFCC flue gas downstream the BD filter and after the open bypass is similar in most of the ranges measured by the ELPI+, but the particle number concentration increases with the valve opening. With small particle correction, no particles above 0.4 µm are measured. Without small particle correction, the number of particles above 0.4 µm is significant (>10,000). Consequently, the number of particles above 0.4 µm cannot be confirmed. At higher flue gas flow to the bypass, it is possible that a higher number of the larger particles are entrained to the bypass.


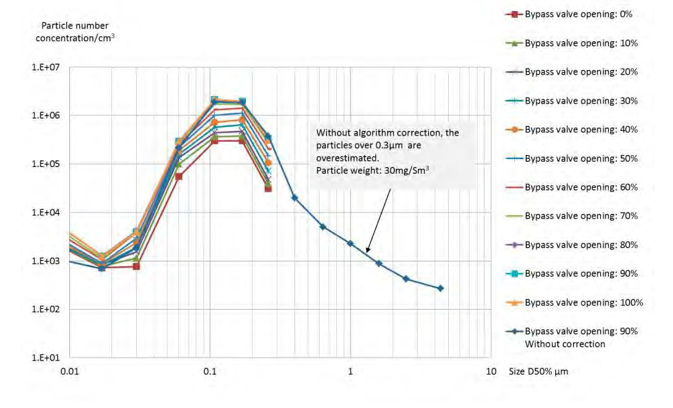
Figure 11. Particle size distribution downstream the BD filter with bypass.

10.  Conclusion

The efficiency of the BD filter system installed at TCM allows the operation of the amine absorber with the RFCC flue gas without breaching the TCM amine emission permit. With the BD filter bypass, various particle concentrations may be generated and controlled in order to test the sensibility of the amine solvents to the aerosols. The test flexibility of the Technology Centre Mongstad is increased, allowing the simulation of different flue gas compositions with aerosols. During a test campaign, the efficiency of the filter is stable, even with fluctuations of the flue gas composition and the presence of components like SO2. Furthers tests are necessary in order to confirm the following items:

  • Effect of the accumulation of catalyst particles in the BD filter
  • Effect of high and variable aerosol mass to the BD filter
  • Estimate the life span of the candles
  • Demister efficiency

The removal of aerosols and fly ash in a flue gas is usually and preferably performed by electrostatic precipitators (ESP) and fabric filters, but the tests at TCM suggest that a BD filter may be applicable in specific full scale projects. The BD filter may be installed upstream or downstream of the absorber if the fly ash concentration is minimized upstream of the BD filter as achieved at TCM.

The ELPI+ (Electrical low pressure impactor) is reliable to measure the aerosol number concentration. However, in the specific case of aerosols above 2 µm diameter composed only of water, the ELPI+ is not applicable since these aerosols are unstable and easy to evaporate. An assessment of the accuracy of the correction algorithm for the fine particles used to correct the ELPI+ readings may be necessary, especially for aerosols above 1 µm of diameter in a flue gas.

11. Acknowledgements

The authors gratefully acknowledge the staff at TCM DA, Gassnova, Equinor, Shell and Total for their contribution and work at the TCM DA facility. The authors also gratefully acknowledge TCM owners and the  Climit Demo project AeroSolve (616125) for their financial support and contributions.

  1. The open-source centre at TCM. https//catchingourfuture.com/
  2. Lombardo G, Fostås BF, Shah MI, Morken AK, Hvidsten OA, Mertens J, Hamborg ES. Results from aerosol measurement in amine plant treating gas turbine and Residue Fluidized Catalytic Cracker flue gases at the CO2 Technology Centre Mongstad. Energy Procedia. Volume 114; 2017. p. 1210-1230.
  3. Shah MI, Lombardo G, Fostås BF, Benquet C, Morken AK. CO2 capture from RFCC flue gas with 30 wt% MEA at Technology Centre Mongstad, process optimization and performance comparison. (to be presented at GHGT-14, 2018, Melbourne, Autralia)
  4. Mertens J, Lepaumier H, Desagher D, Thielens ML. Understanding Ethanolamine (MEA) and ammonia emissions from amine based post- combustion carbon capture: lessons learned from field tests. Internat. J. Greenhouse Gas Control. 2013, 13, 72-77.
  5. Mertens J, Brachert L, Desagher D, Thielens ML, Khakharia P, Goetheer E, Schaber K. ELPI+ measurements of aerosol growth in an amine absorption column. Internat. J. Greenhouse Gas Control. 2014, 23, 44-50.

Results from aerosol measurement in amine plant treating gas turbine and Residue Fluidized Catalytic Cracker flue gases at the CO2 Technology Centre Mongstad (2016)

Gerard Lombardoab*, Berit F. Foståsac, Muhammad Ismail Shahab, Anne Kolstad Morkena,c Odd Arne Hvidstena,c, Jan Mertensd, Espen Steinseth Hamborga,c

aCO2 Technology Centre Mongstad (TCM DA), 5954 Mongstad, Norway bGassnova SF, Dokkvegen 10, 3920 Porsgrunn, Norway cStatoil ASA, PO Box 8500, 4035 Stavanger, Norway dEngie Research and Technologies, Simon Boulivardlaan 34, 1000 Brussels, Belgium *Corresponding author


©
2017 The Authors. Published by Elsevier Ltd. This is an open access article under the CC BY-NC-ND license
(http://creativecommons.org/licenses/by-nc-nd/4.0/).
Peer-review under responsibility of the organizing committee of GHGT-13.

This work discusses the relation between flue gas particle content, mainly related to sulfuric acid aerosols and dust, and corresponding MEA emissions. The work lays grounds for future necessary pre-treatment options  for  various  flue gases  with high aerosol content in order to operate post-combustion amine plants with minimum emissions.

In 2015, the CO2 Technology Center Mongstad (TCM DA), operated a test campaign using aqueous monoethanolamine (MEA) solvent at 30 wt%. The main objective was to demonstrate and document the performance of the TCM DA Amine Plant located    in Mongstad, Norway. Two weeks were dedicated to the aerosol measurement testing.

1.  Introduction

The CO2 Technology Centre Mongstad (TCM DA) is located next to the Statoil refinery in Mongstad, Norway. TCM DA is a joint venture set up by Gassnova representing the Norwegian state, Statoil, Shell, and Sasol. The facility run by TCM DA entered the operational phase in August 2012 and it is one of the largest post-combustion CO2 capture test centres in the  world. A unique aspect of the facility is that either a flue gas slipstream from a  natural gas turbine based combined heat and power (CHP) plant or an equivalent volumetric flow from a residual fluidized catalytic cracker (RFCC) unit can be used for CO2 capture. The CHP flue gas contains about 3.5% CO2   and the RFCC flue gas contains about 13-14% CO2. One of the main test plants at TCM DA is a highly flexible and well-instrumented amine plant. The amine plant was designed and constructed by Aker Solutions and Kværner to accommodate a variety of technologies, with capabilities of treating flue gas streams of up to 60,000 standard cubic meters per hour. The plant is being offered to vendors of solvent based CO2 capture technologies to, among others, test; (1) the performance of their solvent technology, and (2) technologies aimed to reduce the  atmospheric  emissions and environmental impact of amines and amine based degradation products from such solvent based CO2 capture processes. The objective of TCM DA is to test, verify, and demonstrate CO2 capture technologies suitable   for deployment at full-scale. Up to now the vendors Aker Solutions, Alstom, Cansolv Technologies Inc. and Carbon Clean Solutions Ltd. have successfully used the TCM DA facilities to verify their CO2 capture technologies.

TCM has so far not been able to operate the amine plant with the RFCC flue gas, due to amine emissions above the TCM emission permit. The high emissions are caused by sulfuric acid aerosols and dust particles present in the flue gas, which is a general phenomenon also observed in other amine plants [9]. To provide for testing with RFCC gas in the amine plant, TCM will install a Brownian Diffusion Filter (BD) to control the particle concentration in the RFCC flue gas and allow for testing at varying particle concentrations. In order to reduce risk, different types of BD filters have been tested in a pilot unit at TCM. Initial testing to evaluate the maximum aerosol number concentration acceptable for operation with a solvent based on MEA was also performed. Results from initial testing are reported   in this paper. The relation between flue gas particle concentration and emissions of amine and amine degradation products will be further investigated by TCM.

From July to October 2015 TCM DA, in collaboration with partners, operated a test campaign with CHP flue gas using the non-proprietary aqueous monoethanolamine (MEA) solvent at 30 wt%. Two weeks of the campaign was dedicated to MEA aerosol testing with RFCC flue gas mixed with CHP flue gas.

2.  Amine plant overview

2.1 Flow diagram of the tests.

The amine plant test is performed with mixing of a controlled fraction of RFCC gas into the CHP (Combined  Heat and Power) flue gas, while doing measurement of particle concentration in the gas upstream the absorber and continuous MEA emission measurement at the absorber outlet. The CO2 concentration in the CHP flue gas is  adjusted between 3.7% and 12.8% by a recycle of captured CO2.

The flue gas bypass between RFCC and CHP flue gas is equipped with a flow measurement. The aerosol number concentration and particle size distribution is measured at the absorber inlet with an electrical low pressure impactor (ELPI+, Dekati Ltd.)

The amine and other emissions out of the absorber stack were monitored by the following online analyzers:

  • Fourier Transform Infrared Spectroscopy (FTIR), Model: Gasmet FCX
  • FTIR, Model: Finetec Anafm 2000
  • Proton Transfer Reaction – Time of Flight – Mass Spectrometry (PTR-TOF-MS), Model: PTR-TOF 8000 The analyzer at TCM are described in publication [22]

A Pilot Brownian filter is operated on a side stream of the RFCC flue gas (Figure 1) while doing measurement of particle concentration upstream and downstream the pilot filter with an electrical low pressure impactor (ELPI+, DekatiLtd.).


Figure 1. Simplified flow diagram for TCM amine plant prepared for aerosol tests

2.2 Challenges related to aerosol emission measurements.

Aerosol measurements are more complex than gas composition measurements and require the comparison of multiple technologies in order to validate the results. The limitation and benefits of various systems tested at TCM  are discussed:

  • Online ELPI+
  • Online FTIR
  • Online PTR-TOF-MS
  • Isokinetic sampling [14]

For aerosols, the variable reliability of the various systems is documented [21].

2.2.1 Online ELPI+

An Electrical Low pressure Impactor (ELPI+) [6, 7, 21] measures the particle size distribution and total number concentration of the particles. As most of the particles above a critical size will grow in the absorber, the measurement of the particles upstream the absorber is a valuable data that may be correlated to the amine emissions  at the top of the absorber at various process parameters and various solvents. As the flue gas is at saturation with a relative low water concentration and a relative high concentration in sulfuric acid in the aerosols, the  measurement  of the ELPI+ is reliable and the influence of the dilution during the measurements is acceptable [7].

In the absorber beds, the water concentration of the flue gas is high and variable with possible  supersaturation  due to the absorber temperature bulge usually observed during CO2 absorption. As a dilution of the sample is necessary for ELPI+ measurement, the effect of the sample dilution may be substantial for high water concentrations in the flue gas. The results may be assessed at various dilution factors, but the measurement incertitude’s remain significant at high water concentration in the flue gas.

The weight distribution of the particles and the concentration of amines in the droplets are necessary for an estimation of the aerosol growth in the absorber. As the concentration of amines in the aerosols is not available, an ELPI+ is not suitable to estimate the weight of amines in the aerosols based on the calculated weight distribution of the particles.

At the stack of the absorber, ELPI+ size distribution measurements are more reliable due to the lower water concentration in the flue gas. Based on the emission results from the FTIR or isokinetic sampling, the masse of amines in the aerosols may be calculated and compared to the weight distribution from the ELPI+. From this comparison, an average concentration of the amine in the aerosols may be estimated.

In case of high emissions due to amines in aerosols, the measurement period is limited due to the accumulation of aerosols on the filters of the ELPI+.

2.2.2 Online FTIR

A Fourier Transform Infrared Spectroscope (FTIR) does not directly measure aerosols but only gaseous compounds. The vaporization of the aerosols is therefore necessary for the quantification of amine emissions via aerosols.

At TCM the FTIR sample line is 101meter long. The line temperature is controlled and may be adjusted from 120ºC to 160ºC. The sample pump ensures under pressure (-0.4barg) in the sample line. This arrangement secures an adjustable vaporization of the aerosols in accordance to the amine properties.

General limitations of FTIR’s:

  • If a specific amine is present in both the aerosols and as a gaseous compound in the flue gas, the FTIR cannot distinguish if the emissions are cause by the aerosols or by the gaseous compound. The FTIR results will be limited to the total concentration of the vaporized amine in aerosols and gaseous compound in the flue gas.
  • The vaporization of the amine in the aerosols may be highly variable with temperature, amine properties (surface tension), salts and other components that cannot be vaporized from the aerosols. A complete vaporization of the aerosols is usually not feasible.
  • If a high temperature is required to vaporize most of the amines in the aerosols, amine decomposition products may be generated in the sample line to the FTIR.
  • In case of high emissions, coalescence of aerosols on the sample line walls/bends and accumulation of liquid may occurs. Emissions are underestimated and may be detected after the end of the actual test.
2.2.3 Online PTR-TOF-MS

As a FTIR, the Proton Transfer Reaction Spectroscope does not directly measure aerosols but only gases. The same limitations as FTIR above apply.

2.2.4 Isokinetic sampling

Several procedures are applicable:

  • Anderson Cascade Impactor (ACI): tests at TCM are described in a publication [13]. The procedure is complex and comprehensive and requires specific experience by trained operators. Emissions are quantified as mass of aerosols for a particle size distribution. Amine emissions via aerosols are usually not measured.
  • Impingers with absorption in liquid: this procedure is described in publication [14]. Tests at TCM confirm that the results for aerosols are not reliable.

General limitations of isokinetic sampling’s:

  • The results are only known after the test period and as an average of a sampling period during stable operation. The consequences of the adjustment of operation parameters cannot be directly evaluated. The interpretation of the tests results is delayed and a prolonged test period is required.
  • As the isokinetic sampling requires a sequence of several manual operations, the accuracy and repeatability may be limited. Several measurements are usually necessary to confirm an average value.

The following operations may affect the accuracy for aerosol measurements:

  • Control of isokinetic sampling and sample flow measurement at low and variable velocity in the absorber
  • Condensation/vaporization in sampling line/changing atmospheric conditions
  • Control of the velocity in the impinger. Aerosols not captured in the impingers
  • Transport of samples to laboratory and chemical reactions in transport period
  • Analysis of the samples at the laboratory and calculation of the aerosols based on flow measurements and concentrations.

Isokinetic samplings are compulsory for the validation of the online instrumentation at the beginning of each campaign with a new amine solvent, new equipment or unproved process parameters. This validation is critical for the reliability and guarantee of the campaign results and compliance to the emission permit.

3. Purpose of the tests

3.1 Test 1: amine plant emissions

The purpose of the test is to evaluate the maximum aerosol number concentration acceptable for operation with a solvent based on MEA.

The emissions from the absorber with aqueous MEA solvent have been investigated by utilizing the high flexibility of the amine plant at TCM by variation of the following main parameters:

  • Sulfuric acid aerosol in the inlet flue gas: number concentration and particle size distribution by mixing small fractions of the RFCC flue gas into the gas turbine flue gas
  • CO2 inlet flue gas concentration by CO2 product stream recycling
  • Lean MEA inlet temperature to the absorber and hence absorber temperature profile
  • Water wash cooling temperature

3.2 Test 2: Pilot Brownian filter efficiency

A pilot Brownian filter was previously tested at TCM in collaboration with Aker Solutions [17].

Several types of pilot Brownian filters of 1000Sm3/h of flue gas are now tested at TCM in order to assess the installation of a future Brownian filter unit capable of treating 35000 Sm3/h of RFCC flue gas. The purpose of the future unit is to reduce and control the concentration of aerosols in the RFCC flue gas inlet to the amine absorber. This installation will allow TCM to remove almost all aerosols or adjust the aerosol concentration and particle size distribution at various CO2 concentrations for future tests in order to investigate aspects such as:

  • Sensitivity of a specific solvent to the aerosols
  • Aerosol emissions due to degradation products
  • Understanding of aerosol mechanism for various advanced solvents
  • Recommendations for future flue gas treatment, amine absorber equipment and operation parameters.
  • Assessment of the required flue gas treatment required for a specific coal power plant with a known range of aerosols, oxygen and CO2 concentration.

The pilot is installed in order to check the efficiency of a Brownian filter based on the number particles and particle size distribution. The Brownian filter efficiency is usually reported by the mass of aerosols captured in the filter. This method is relevant for reporting sulfuric acid emissions, but is not sufficient to evaluate  low  concentration of aerosols downstream the filter and the consequences of aerosol growth in the absorber.

A Brownian filter is suitable for test purposes of the amine absorber at TCM for the RFCC flue gas:

  • A high discharge pressure is available with the existing fan
  • The concentration of particles/fly ashes is limited at TCM
  • High concentrations of aerosols can be controlled by bypass of the Brownian filter

4.  Results of the tests and parameters

4.1 Results of the amine emission tests

In this section, main results from MEA aerosol testing are summarized. The operating conditions for each sequence of test are described in the following paragraphs. The conditions are chosen close to  the  optimum operation conditions for an amine absorber with MEA as described in TCM DA publications [15, 16].

TCM DA received a temporary emission permit from the Norwegian Environmental Agency in order to conduct the given tests. The temporary permit allowed an increase of the MEA emissions from the current 6 ppmv to 500 ppmv for maximum 4 days of testing with RFCC flue gas. The limit of amine emission was not exceeded during the tests.

4.1.1 Properties of the CHP flue gas mixed with a fraction of RFCC flue gas

The particle size distribution of the aerosols is quite similar when different fractions of RFCC gas are mixed into the CHP as seen on Figure  2. The total number concentration is roughly proportional to the mixing ratio, but at  lower RFCC flue gas flow, the number concentration of larger particles decreases due to the piping arrangement at the connection between the main RFCC duct and the bypass line to the CHP flue gas. At high velocity in the main RFCC duct and lower velocity in the bypass pipe, large particles remain in the main RFCC duct.

Typical Flue gas composition is given in Table 1.


Table 1. Typical Composition of the CHP flue gas with CO2 recycle mixed with a fraction of RFCC flue gas.

Figure 2. ELPI+ measurements. Size distribution of the aerosols in the mixed RFCC flue gas flow ratios into 30 000 Sm3/ of CHP
4.1.2 Correlation between particle concentration and MEA emissions

The correlation between particle concentration and MEA emissions was studied at three different CO2 concentrations (3.7 %, 8% and 12.7% CO2). At each concentration the effect of different particle concentrations was investigated by varying the mixing fraction of RFCC gas into the CHP gas. The lean amine temperature into the absorber was adjusted to keep the temperature difference between the maximum absorber bulge and the lean amine entering the absorber almost the same independent of CO2 concentration. All test runs were performed at an absorber packing height of 18m. The upper 6 m of packing was not loaded with solvent. The parameter settings for each test are included in Table 2. Results of the correlation between particle concentration and MEA emissions are plotted in Figure 3.

At 3.7% CO2 (no CO2-recycling) and the process conditions given in Table 2, there is a linear correlation   between particle concentration in the absorber inlet gas and MEA emissions as seen in Figure 3a (upper left). At particle concentrations <100 000 particles/cm3, no MEA emissions was measured. The emission of MEA is below 3 ppmv at 150 000 particles/cm3. When the concentration increases above 250 000 particles/cm3, the regular discharge permit of 6 ppmv is exceeded.

The next test was conducted with CO2-recycling to around 8 vol % CO2 in the gas upstream the absorber. Results are plotted in Figure 3b (upper right). The MEA emissions correlates to the particle concentration and it is still linear up to around 500 000 particles/cm3, then a nonlinear correlation is observed with higher  emissions. However, at  these process conditions the emission of MEA was still below 3 ppmv at around 500 000 particles/cm3, indicating a higher tolerance to aerosols in the gas at 8% CO2 compared to 3.7% CO2. At close to 1 mill particles/cm3 emission above 6 ppmv was observed.


Table 2. Parameter settings for testing effect of particle concentration in flue gas on MEA emissions.

Figure 3. Correlation between particle concentration and MEA emissions at three different CO2 concentrations. a) Upper left: Normal CHP absorber conditions with 3.7% CO2. b) Upper right: CHP with CO2-recycle to 8.0% CO2. c) Lower left: CHP with maximum CO2 recycle to 12.7% CO2

The CO2-recycling was then increased to 12.7% CO2, resulting in higher temperatures  in the absorber due to  more reactions taking place. Testing of the effect of particle concentrations in the flue gas on MEA emissions was conducted. Results are plotted in the Figure 3c lower left. As can be seen from the figure,  there are more scattering  in the data during this test. This is probably caused by analytical challenges due to the high temperature and water content of the gas leaving the absorber (refer to section 2.2). The effect of particle concentration on emission is comparable to what was observed at 8%, but again much less than at lower CO2 concentration. At these conditions, the emission of MEA is below the 6 ppm limit at 600 000 particles/cm3, and above 6 ppm at 1 mill particles/cm3 in the absorber inlet gas, if the PTR-TOF-MS instrument is most trusted.

4.1.3 Effect of cooling the gas at the top of the absorber on MEA emissions

For each CO2 concentration, the effect of increased cooling of the gas at the top of the absorber on the MEA emissions was investigated at a constant particle concentration in the gas. Cooling was done either by reducing the temperature of the lean solvent entering the absorber or by reducing the temperature in the lower  water  wash  section. The effect of the lean amine temperature is shown in Figure 4. The effect of moving the cooling up to the lower water wash section was tested for the 8% CO2 case only. Results are shown in Figure 5.

The particle concentration in the gas was kept constant at 540 000 particles/cm3 for testing at 3.7% CO2 and at  950 000 particles/sm3 for testing at 8.0 and 12.7% CO2. In each case, the lean amine temperature was changed step-vise to investigate impact on MEA emissions. The lower water wash temperature was kept constant at 30°C for the 3.7% CO2 case and at 45°C for the cases with higher CO2 concentrations. The other parameters  were kept at the  same levels as given in Table 2 above. However, the difference between the maximum absorber bulge temperature and the lean amine temperature increased as the lean amine temperature was step-vise reduced.

As can be seen in Figure 4, the MEA emissions increases when the temperature of the lean amine is reduced for tests with 3.7% CO2 and 8% CO2. For the 12.7% CO2 case, there are more scattering in the data but no significant effect of reducing the lean amine temperature on MEA emissions was seen in the temperature window explored. However, at the end of the test when the lean amine temperature was further decreased to 30°C, a significant plume was observed and the on-line analyzers indicated MEA emissions above 20-30 ppmv.


Figure 4 Effect of lean amine temperature on MEA emissions. a) Upper left: At 3.7% CO2 and 540 000 particles/cm3 . b) Upper right: At 8.0% CO2 and 950 000 particles/cm3. c) Lower left: At 12.7% CO2 and 950 000 particles/cm3

The effect of decreasing the temperature in the lower water wash on MEA emissions was then examined for the 8% CO2 case at the same concentration of 950 000 particles/cm3 in the gas. The lean amine temperature was set to 55°C, which is 11°C below the maximum absorber bulge temperature, resulting in a temperature of the gas into the lower water wash section of 60°C. The water wash section was operated at 45° and 35°C, respectively and MEA emissions were measured. Results are shown in Figure 5. There is a tendency of increased MEA emissions when the temperature of the water was reduced, however the effect is not as pronounced as when reducing the lean amine temperature (Figure 4b).

The effects of particle concentration, CO2 concentration and temperatures in the absorber and water wash system on MEA emissions will be further investigated by TCM.


Figure 5 Effect of the temperature in the lower water wash on MEA emissions for case with 8% CO2 and 950 000 particles/cm3.

4.2 Results of the filter tests

4.2.1 Brownian diffusion filter description

In a fiber filter, particles may be captured by three collection mechanisms:

  • Brownian diffusion: the smaller particles get random motion by collision with surrounding gas molecules. Higher random motion and longer residence time facilitates the capture of the particle to a fiber. Velocities between 5  and 10cm/s are necessary for high efficiency. Maximum velocity is 25cm/s.
  • Interception: particles with higher momentum do not follow the gas stream around a fiber and are captured to the fiber by interception. Efficiency increases with the gas and particle velocity. Once a particle touches the surface of the collecting target, it adheres by weak Van Der Waals forces. Velocities between 0.2 and 1m/s are necessary for high efficiency.
  • Direct impaction: The particle is intercepted from the gas stream if there is not enough space between two fibers or if the particle touches a fiber as it passes closed enough. Efficiency increases with the particle diameter and is constant for a velocity above 1m/s.

In a Brownian diffusion filter the main particle capture is achieved by the first collection mechanism.

A typical candle filter is illustrated in Figure 6. Small droplets will coalesce together in larger droplets until the collected liquid trends to flow in the same direction as the gas and fibers and drains out of the fiber bed by gravity to the bottom of the candle filter. A typical industrial candle is 600mm diameter and 3.6m height with a  candle thickness between 50mm and 100mm. For practical application, the number of candle is increased until the required area and gas velocity are achieved.


Figure 6. Typical Candle Filter
4.2.2 Flue gas Composition and aerosols upstream and downstream the Brownian filter

The efficiency of any flue gas treatment upstream an amine absorber cannot be evaluated  by a single parameter,  as for example, the “equivalent SO3” concentration in the flue gas. The total number concentration, the size distribution of the aerosols and the composition of aerosols are the main critical parameters. For similar gas composition from various coal power plants, the aerosol properties may be highly variable from plant to plant and during the life time of each power plant.

Aerosols in the RFCC flue gas are mainly aqueous particles with some sulfuric acid, salts, catalyst particles and  fly ashes. Scanning electron microscope analyses (SEM) performed at TCM confirms that fly ash concentration is low and has a similar composition as a typical flue gas from a coal power plant. At TCM, fly ashes are mainly found in aerosols in the range of 1µm diameter. The typical composition of the RFCC flue gas is defined in Table 3.


Table 3. Typical Composition of the RFCC flue gas upstream and downstream the BD filter.

As shown in Figure 7 the particle size distribution of the RFCC flue gas at TCM is close to coal power plant flue gases [19, 20].


Figure 7. Comparison of RFCC flue gas and flue gas from a coal power plant
4.2.3 Overall efficiency

The overall efficiency of the Brownian diffusion filters tested at TCM is higher than 98% based on the particle number concentration. This efficiency is checked at TCM for several types of Brownian filters. The efficiency of a Brownian diffusion filter is variable with the particle size. Figure 8 illustrates that a lower velocity increases efficiency for smaller particle size. Higher velocity increases efficiency for larger particle size. This is in accordance with the three collection mechanisms of the filter candles:

  • Brownian diffusion: requires high residence time/low velocities; high efficiencies for smaller particles (<0.1µm)
  • Interception: requires higher velocities
  • Impaction: high efficiency for larger particles (>0.5µm)

Figure 8. Size distribution upstream and downstream the BD filter and comparison with CHP mixed with RFCC flue gas

As illustrated in Figure 8 , the particle size distribution of the following flue gases is similar:

  • CHP flue gas mixed with a fraction of RFCC flue gas
  • RFCC flue gas after a Brownian diffusion filter

Above 0.5µm, the number of particles is negligible (<100particles/cm3)

As illustrated in Figure 9, the efficiency of the various filters is variable. Some Brownian filters may reduce the number particles to less than the detection limit of the ELPI+ (approximately 10 000 particles/cm3). The main differences between the types of Brownian diffusion filter are the filter density, fiber diameter and fibers weave. Generally, more fibers and higher pressure drop will result in higher efficiency. Specific fibers weave and layers reduce pressure drop.

At the first start up the filter bed is dry and requires to be saturated with liquid from the aerosols. The pressure drop increases slightly during this period. After saturation, the pressure drop of Brownian diffusion filters is essentially proportional to the flue gas flow rate and velocity to the candle filters, due to the laminar flow inside the filter bed.

During 3 months of operation, the pressure drop of the test pilots at TCM was constant and no increase due to fly ashes or accumulation of solid particles in the filter bed was noticed.

The typical pressure drop is around 25mbar at an average velocity of 7cm/s based on the average of the inlet and outlet surface of the candle filters. The optimized velocity is specific to each type of candle  filter/vendor and  required efficiency.

As an example, for the candle filter from the Figure 9:

  • Up from 3.5 to 7cm/s the efficiency decreases slightly, but the filter area required at 3,5cm/s is the double than at 7cm/s. The cost of the filter is almost proportional to the area required.
  • From 7 to 10cm/s, the captured particles and efficiency are constant but pressure drop increases with the velocity.

Figure 9. Typical particle total Number Concentration downstream the pilot BD Filter

The Brownian filter tests at TCM confirm that a suitable efficiency is achieved for the RFCC flue gas and testing with RFCC flue gas may be performed at TCM within the present emission permit.

The installation of Brownian filters may be applicable to specific refinery flue gases if the fly ash concentration is limited.

5.  Aerosol emissions: discussions and interpretation of the results

5.1 Kelvin effect and literature

When an interface gas/liquid is flat, the condensation of gas to the liquid is generally given by the equilibrium concentration of vapor pressure at given temperature and pressure. The kelvin effect expresses that the  vapor pressure over a curved interface is always higher for the same component than over a flat interface. The kelvin equation gives the critical particle size or minimum particle diameter of a liquid [2, 4, 18]:

d* is a function of the particles, gas composition and properties.

Where:

d* = Particle diameter [m]
σ = Surface tension of liquid drop [N/m]
M = Average molecular weight of the condensable liquid [kg/Kmol.]
ρ = Liquid density [kg/m3] T = Temperature [ºK]
R = Universal gas constant [J/Kmol./ºK]
p = Sum of the partial pressures of all condensable components in the mixture [Pa]
p0 = Corresponding sum of partial pressure when saturated (equilibrium conditions) [Pa] The saturation of the gas mixture is S = p/p0. The gas phase is supersaturated if S > 1

The kelvin equation indicates that:

  • Very small droplets (for example < 0.1µm) are stable, and a large supersaturation is necessary for formation of new droplets or growth of existing droplets.
  • Between 0.1µm and 1µm, aerosol growth may occur with supersaturation of water or amine vapor.
  • Above 1µm, supersaturation is not necessary. These relatively large droplets may be considered as a flat surface. Aerosol growth may occur at once saturation is achieved.

5.2 Assumed aerosol mechanism

The challenge for amine absorbers is the evaluation of the chemical processes in the critical  section where the  flue gas that has been heated by chemical reactions, is cooled by the incoming lean amine (section 2 in Figure 11). The chemistry of the amine in the aerosols is similar to the lean solvent film of the packing, but the consequences of the variable aerosol diameter are new parameters. The experience acquired at TCM with MEA and various advanced solvents suggests that the chemical process in the aerosols is a major parameter. Similar aerosol mechanisms are described in multiple recent publications [1, 2, 3].

Figure 10 illustrates the assumed mechanisms for aerosols chemistry:

  • Phase 1: Aerosol growth by water and eventual homogeneous nucleation in case of high supersaturation. The aerosol growth by water from gas phase is dependent of the supersaturation. The diameter of the aerosol increases in a short time, likely lower than 0.5second [18].
  • Phase 2: Aerosol growth by amine. Due to the kelvin effect, the aerosol growth by amine from gas phase is

dependent of the supersaturation and begins at once for large particles or as soon as a critical diameter is achieved (probably from 0.2µm to 1µm for MEA). The aerosol growth by amine may be continuous until equilibrium and saturation of amine in the aerosols.

  • Phase 3: Large aerosols are considered as flat surfaces. Free amine with high activity like MEA captures CO2 in the aerosols. Reaction kinetics is critical due to the short residence time.
  • Phase 4: Due to the formation of salts, additional free amine is absorbed in the larger aerosols

Figure 10. Description of assumed aerosol mechanisms

The major parameters for aerosol mechanisms are:

  • The initial size of the aerosol and the growth rate with water is a major parameter. For example, a flue gas with large number of aerosols between 0.3µm and 1µm may cause high emissions.
  • The difference of temperature between the lean and the flue gas is the main cause of the supersaturation of the components in the gas phase. The supersaturation of a component is not necessary related to the concentration of the component in gas phase. Without supersaturation, even with high concentration of amines (>1000ppmv) aerosols may not cause emissions. With supersaturation, even at low concentrations (<5ppmv), special amines may produce emissions. For advanced amines, decomposition products can typically be the cause of substantial aerosol emissions.
  • The effect of lean solvent loading is probably significant but is not yet evaluated at TCM.
  • Additional components in the aerosols may modify the chemistry and reaction kinetics: H2SO4, salts, fly ashes/catalyzer particles [10]

5.3 Amine absorber profile and main mechanism with MEA

As many parameters with opposite effects will modify the supersaturation in the amine absorber, the behavior of aerosols is complex. In order to illustrate the  mechanisms in an amine absorber, the typical temperature profile of  the amine absorber at TCM is described in Figure 11 and the main operation parameters are listed in Table 4.


Table 4. Operation condition of the absorber

The absorber upper packing for CO2 absorption is not operated and the lean solvent feed is located above the middle packing of 6m height. The lower packing height is 12m. Temperature measurements are located every meter of the packing at four horizontal locations. This arrangement allows a suitable validation of the simulation models.

The aerosol mechanisms are specific in each of the following sections of the absorber:

  • Section 1: In the packing under the bulge, 5000kg/h of CO2 is absorbed and temperature increases in the lean solvent. The lean solvent heats the flue gas. Flue gas temperature is lower than the liquid solvent (7ºC to 1ºC). Up to 7000kg/h of water and 30kg/h of MEA are vaporized from the liquid. The larger aerosol droplets may also vaporize some water. Some limited mass of MEA may be absorbed in large aerosols (>1 µm) if saturation is achieved locally (cold walls, flue gas distribution, defective solvent distribution in the packing). It is expected   that most of the aerosol composition remains unchanged.
  • Section 2: starts from just below the maximum temperature in the absorber (bulge temperature) and finished at  the elevation corresponding to a stable flue gas temperature. Below the lean solvent distributor, the relative cold solvent cools down the flue gas. Up to 2500kg/h of water and some solvent previously vaporized are condensed again in the liquid solvent. Due to sudden cooling, the concentration of condensable components in the gas phase exceeds the corresponding concentration in vapor–liquid equilibrium (VLE). The gas phase is supersaturated  with high MEA concentration in gas phase. This section is critical, in a short residence time; the water particles diameter will increase with water and become saturated with amines. The chemistry in the droplets will be  critical for the growth of the aerosols with amines. Above the lean feed, the temperature decreases until equilibrium conditions are achieved. The effect of the equilibrium condition is not yet evaluated in the tests, but may be critical for emissions.
  • Section 3: Most of the remaining amines in vapor phase are absorbed in the lower water wash. Some water previously vaporized is condensed. Sudden cooling shall be avoided otherwise, the same mechanism as Section 2 occurs.
  • Section 4: The last traces of amines in vapor phase are absorbed in the upper water wash. The remaining water previously vaporized is condensed. Sudden cooling is applied in order to keep the water balance of the plant. The aerosol diameter will increase with water but without additional amine capture.
  • Stack: Most of the amine captured by aerosols in section 2 and eventually in section 3 will be emitted at the stack of the absorber. The typical efficiency of demisters and packing is poor or insignificant for such aerosols.

Figure 11. Temperature profile of the absorber at 12.8% CO2 inlet

The results from testing show that the emissions of MEA increases as the particle concentration in the flue gas increases. This indicates that the extent of aerosol based emissions depends strongly on the number concentration of particles in the flue gas.

With the same particle concentration, the aerosol mechanisms are likely different for the cases at 3.7% CO2 and 12.7% CO2, see Table 2, test conditions a) and c):

  • At 3.7% CO2 the typical MEA concentration in the gas phase in the bulge area is 20 to 30 ppmv. The emissions due to aerosols are also 20 to 30 ppmv. It is likely that most of the MEA in gas phase is condensed in aerosols in section 2. Both homogeneous nucleation of MEA and a substantial condensation on aerosols may be considered.
  • At 12.7% CO2 the typical MEA concentration in the gas phase in the bulge area is 300 to 500 ppmv. The

emissions due to aerosols are limited to less than 5 ppmv. The particle growth by water and MEA condensation are likely limited by the gradual temperature decrease above the bulge temperature.

Minor variations in dominant process parameters may increase or decrease aerosol emissions as several competitive mechanisms are involved. As illustrated in Figure 3, MEA emissions are lower at 8% CO2 and 12% in the flue gas than compared to the test at 3.7% CO2 concentration. This trend is dissimilar to published results obtained at slightly different process parameters [1, 2, 5, 12]. The higher emissions at low CO2 concentration were thus not expected. The following hypotheses are possible, but are not yet confirmed since advanced simulations are not available:

  • The chemistry in the lean solvent solution may contribute to less amine condensed on the aerosols: at higher CO2 concentration, kinetics and driving forces in the top of the absorber increases. Amine condensing from the vapor phase to the liquid lean reacts faster with CO2, supersaturation decreases.
  • The chemistry in the aerosol may also generate a decrease of emissions: at higher CO2 concentrations, the solubility of CO2 decreases with the higher flue gas temperature and less CO2 is absorbed in the aerosols. The droplets are saturated in free amine and no more amines are absorbed.

6.  Conclusions and recommendations

6.1 Conclusion of the tests at TCM

As described in this work, an appropriate description and composition of the flue gas is necessary to assess the risks of emissions associated to aerosols. The description should include gas components, aerosol size distribution and number concentration, and composition of the trace components in the aerosols, measured at the expected pressure and temperature of the flue gas at the inlet of the absorber.

Testing was conducted in the TCM amine plant to evaluate the maximum aerosol number concentration in the   flue gas, acceptable for operation with MEA within TCM DA’s emission permit. When operating the plant with flue gas from the natural gas fired power plant, no aerosol emission occurs. As a fraction of the flue gas from the residual fluidized catalytic cracker (RFCC) was added, the MEA emissions increased significantly. A strong correlation between particle concentration in the flue gas and MEA emission was found. The effect was more pronounced when the CO2 concentration in the gas was reduced. The control of the lean amine temperature and the water wash temperature are effective measures to reduce the emissions. With the particle size distribution tested at TCM, a concentration of 500 000 particles/cm3 is acceptable for operation of the RFCC flue gas.  A Brownian  Diffusion (BD) filter will be installed to reduce the particle concentration below this level and by-pass possibilities will enable for future testing at a large range of particle concentrations. Pilot testing at TCM has demonstrated high efficiency  for BD filters with the RFCC flue gas.

6.2 Recommendation for future CO2 capture plant based on MEA or advanced solvents

6.2.1 Operation parameters of CO2 capture plants

As demonstrated in the test at TCM, in case of aerosols in the flue gas, the lean temperature and the water wash temperature requires to be optimized. The eventual energy penalty and mitigation design will be assessed in future works at TCM.

The effect of other operation parameters as CO2 concentration, CO2 capture rate or lean loading cannot be predicted by simple assessments. The validation of a simulation tool for aerosols specific to each solvent is essential for the extrapolation of the tests results from a pilot to a full-scale plant.

Tests results at TCM may be a basis for future works in order to validate simulations tools and confirm the major mechanisms of aerosol growth.

6.2.2 Process equipment for aerosol mitigation upstream the amine absorber

As illustrated for MEA in this work, the sensitivity of a specific solvent at various aerosol concentrations may be assessed. Based on sensitivity studies for a specific solvent, the works at TCM may contribute to specify the requirements downstream the flue gas treatments in order to minimize the risk of emissions. Typical flue gas treatments are as for example:

  • Wet Electrostatic Precipitator (WESP) [8, 11]
  • Flue gas desulfurization (FGD) [11]
  • Bag house filter [19, 20]
6.2.3 Process equipment for aerosol mitigation in the amine absorber

The test results from the Brownian diffusion filters confirm a large  variability of pressure drop an efficiency of  the various fibers and the opportunity to improve the technology is confirmed. Future works are recommended in order to evaluate the pressure drop and efficiency of impaction candles and high efficiency demisters with coalescer materials and flushing systems. As these equipment’s are specifically designed to remove particles between 1 and 5µm, they may reduce a large fraction of the aerosol emissions at a relatively low price. Such equipment’s are currently not demonstrated in amine absorbers.

Future works at TCM will include specific high efficiency demisters.

6.2.4 Process equipment for aerosol measurements in the amine absorber

The works at TCM confirm the need for reliable measurements of emission due to aerosols. Based on the experience of the tests, the combination of the following measurements is recommended:

  • Isokinetic sampling for the validation of the online instrumentation for aerosols.
  • Sampling line to online instrumentation with temperature control suitable for an acceptable vaporization of the aerosols.
  • FTIR for online measurements of amine from vaporized aerosols

An isokinetic sampling procedure based on a train of impinger jet was recently developed at TCM based on the experiences of the MEA campaign and further tests with advanced amines. This specific system is able to quantify both the vapor and aerosol emissions with reliable accuracy. Future test shall confirm the advantages of the specific procedure.

Acknowledgements

The authors gratefully acknowledge the staff of TCM DA, Gassnova, Statoil, Shell and Sasol for their  contribution and work at the TCM DA facility. The authors also gratefully acknowledge Gassnova, Statoil, Shell,   and Sasol as the owners of TCM DA for their financial support and contributions.

  1. Purvil Khakharia, Leonie Brachert, Jan Mertens, Christopher Anderlohr ,Arjen Huizinga, Eva Sanchez Fernandez, Bernd Schallert, Karlheinz Schaber,Thijs J.H. Vlugt, Earl Goetheer. Understanding aerosol based emissions in a Post Combustion CO2 Capture process: Parameter testing and mechanisms. International Journal of Greenhouse Gas Control 34 (2015) 63–74.
  2. Purvil Khakhariaa, Jan Mertens, Thijs J.H. Vlugt, Earl Goetheer. Predicting Aerosol Based Emissions in a Post Combustion CO2 Capture Process Using an Aspen Plus Model. Energy Procedia 63 (2014) 911 – 925.
  3. Hammad Majeed, Hanna Knuutila, Magne Hillestada Hallvard F. Svendsen. Characterization and Modelling of Aerosol Droplet in Absorption Columns. Ieaghg, 3rd Post Combustion Capture Conference (PCCC3)
  4. Steven M. Fulk, Gary T. Rochelle. Modeling aerosols in amine-based CO2 capture. GHGT-11. Energy Procedia 37 ( 2013 ) 1706 – 1719
  5. Purvil Khakharia, Leonie Brachert, Jan Mertens, Arjen Huizinga, Bernd Schallert ,Karlheinz Schaber, Thijs J.H. Vlugt, Earl Goetheer. Investigation of aerosol based emission of MEA due to sulphuric acid aerosol and soot in a Post Combustion CO2Capture process. International Journal of Greenhouse Gas Control 19 (2013) 138–144
  6. Jan Mertens; Leonie Brachert, Dominique Desagher, Bernd Schallert, Purvil Khakharia, Earl Goetheer. Predicting amine mist formation based on aerosol number concentration and size measurements in flue gas. Energy Procedia 63 ( 2014 ) 893 – 901.
  7. L. Brachert, J.Mertens, P.Khakharia, K.Schaber. The challenge of measuring sulphuric acid aerosols: Number concentration and size evaluation using a condensation particle counter(CPC) and an electrical low pressure impactor (ELPI+). Journal of Aerosol Science 67 (2014) 21–27.
  8. Jan Mertens, C. Anderlohr, P. Rogiers, L. Brachert, P. Khakharia, E. Goetheer, K. Schaber. A wet electrostatic precipitator (WESP) as countermeasure to mist formation in amine based carbon capture. International Journal of Greenhouse Gas Control 31 (2014) 175–181.
  9. Takashi Kamijo, Yoshinori Kajiya, Takahiko Endo, Hiromitsu Nagayasu, Hiroshi Tanaka, Takuya Hirata, Takahito Yonekawa, Tatsuya Tsujiuchi. SO3 impact on amine emission and emission reduction technology. Energy Procedia 37 ( 2013 ) 1793 – 1796.
  10. S. Sinanis, A. Wix, L. Ana, K. Schaber. Characterization of sulphuric acid and ammonium sulphate aerosols in wet flue gas cleaning processes. Chemical Engineering and Processing 47 (2008) 22–30.
  11. Peter Moser, Sandra Schmidt, Knut Stahl, Gerald Vorberg, Gustavo A. Lozano, Torsten Stoffregen, Frank Rösler. Demonstrating Emission Reduction – Results from the Post-combustion Capture Pilot Plant at Niederaussem. Energy Procedia 63 ( 2014 ) 902 – 910.
  12. Michael Imle, ErikvonHarbou, LeonieBrachert, KarlheinzSchaber, HansHasse. Predicting supersaturation by rate-based simulations of reactive absorption. Chemical Engineering Science 118(2014)41–49.
  13. De Cazenove T, Bouma RHB, Goetheer ELV, Van Os PJ, Hamborg ES. Aerosol Measurement Technique: Demonstration at CO2 Technology Centre Mongstad. Energy Procedia 86 ( 2016 ) 160 – 170
  14. Morken AK, Nenseter B, Pedersen S, Chhaganlal M, Feste JK, Bøe Tyborgnes R, Ullestad Ø, Ulvatn H, Zhu L, Mikoviny T, Wisthaler A, Cents T, Bade OM, Knudsen J, De Koeijer G, Falk-Pedersen O, Hamborg ES. Emission results of amine plant operations from MEA testing at the CO2 Technology Centre Mongstad. GHGT12. Energy Procedia 00 (2013) 000–000.
  15. Brigman N, Shah MI, Falk-Pedersen O, Cents T, Smith V, De Cazenove T, Morken AK, Hvidsten OA, Chhaganlal M, Feste JK, Lombardo G, Bade OM, Knudsen J, Subramoney SC, Fostås FB, De Koeijer G, Hamborg ES. Results of amine plant operations from 30 wt% and 40 wt% aqueous MEA testing at the CO2 Technology Centre Mongstad. GHGT12. Energy Procedia 00 (2014) 000–000
  16. Gjernes E, Pedersen S, Cents T, Watson G, Fostås BF, Shah MI, Lombardo G, Desvignes C, Flø NE, Morken AK, de Cazenove T, Faramarzi L, Hamborg ES. Results from 30 wt% MEA performance testing at the CO2 Technology Centre Mongstad. Energy Procedia (GHGT-13), Forthcoming 2017.
  17. Bade OM, Knudsen JN, Gorset O, Askestad I. Controlling amine mist formation in CO2 capture from Residual Catalytic Cracker (RCC) flue gas. GHGT12. Energy Procedia 63 ( 2014 ) 884 – 892
  18. Marco Tammaro, Francesco Di Natale, Antonio Salluzzo, Amedeo Lancia. Heterogeneous condensation of submicron particles in a growth tube. Chemical Engineering Science, Volume 74, 28 May 2012, Pages 124–134
  19. Justin Anthony, John Carroll. Advanced Technology Testing at the National Carbon Capture Center. Publication of National Carbon Capture Center (NCCC).
  20. Honghong Yi, Jiming Hao, Lei Duan, Xiaolong Tang, Ping Ning, Xinghua Li. Fine particle and trace element emissions from an anthracite coal-fired power plant equipped with a bag-house in China. ScienceDirect. Fuel 87 (2008) 2050–2057
  21. Jan mertens, Dominique Desagher, Marie-Laure Thielens, Han Huynh, Helene Lepaumier, Purvil Khakaria, Earl Goetheer. On- and off-line ethanolamine and ammonia emission monitoring in PCC. PCCC2 presentation Bergen September 2013
  22. Morken AK, Pedersen S, Kleppe ER, Wisthaler A, Vernstad K, Ullestad Ø, Flø NE, Faramarzi L, Hamborg ES. Degradation and Emission Results of Amine Plant Operations from MEA Testing at the CO2 Technology Centre Mongstad. Energy Procedia (GHGT-13), Forthcoming 2017

Aerosol Measurement Technique: Demonstration at CO2 Technology Centre Mongstad (2016)

Thomas de Cazenovea, Richard H.B. Boumab, Earl L.V. Goetheerb, Peter J. van Osb, Espen Steinseth Hamborga,c,*

aCO2 Technology Centre Mongstad (TCM DA), 5954 Mongstad, Norway, bTNO Science and Industry, Leeghwaterstraat 46, Delft, Netherlands cStatoil ASA, P.O. Box 8500, 4035 Stavanger, Norway *Corresponding author

1876-6102 © 2016 The Authors. Published by Elsevier Ltd. This is an open access article under the CC BY-NC-ND license
(http://creativecommons.org/licenses/by-nc-nd/4.0/).
Peer-review under responsibility of the Programme Chair of the 8th Trondheim Conference on CO2 Capture, Transport and Storage
doi: 10.1016/j.egypro.2016.01.017

There are two main routes for amine emission. The first one is connected to volatile amine emission. The second route is amine emission via aerosols. Recently, it has been observed that under certain conditions and at specific test locations significant aerosol formation and emission can occur. To distinguish between the two routes for amine emission, a novel methodology has been developed. This methodology is based on the separation of the aerosols from the vapour phase in a controlled isothermal modus. To be able to do this, the design of the probe and the sampling procedure should fit to the operational circumstances and is of crucial importance to guarantee isokinetic sampling. The separation of the aerosols is done via an impactor. Using an impactor, not only the total mass of aerosols can be determined, but also the size distribution.

At the end of 2013 and at the beginning of 2014, two aerosol measurement campaigns were performed at CO2 Technology Centre Mongstad, Norway. The measurements indicate that small amounts of aqueous aerosols with a broad aerosol size distribution are present in the flue gas stream from gas turbine operations. The presence of aqueous aerosols does not necessarily imply significant amine emission from the amine process. Analysis of the aqueous aerosols indicates low amine content present in the aerosol fractions, and it seems evident that amines present in the gaseous phase inside the absorber column have not been transferred to the aqueous aerosols and by such the total amine emissions are very low.

1.  Introduction

CO2 Technology Centre Mongstad (TCM  DA), located next to the Statoil refinery near Mongstad, Norway, is    one of the largest post-combustion capture test facilities in the world. TCM DA is a joint venture between Gassnova, Statoil, Shell, and Sasol. The purpose of this facility, which started operation in August 2012, is to allow vendors of suitable amine formulations and other carbon capture processes to test their technology and collect performance data  to support full-scale design and anticipate the associated performance and operating costs. A unique aspect of the facility is that either a slipstream from a natural gas-fired combined heat and power (CHP) plant or an equivalent volumetric flow from a refinery residue fluid catalytic cracker (RFCC), whose higher CO2 content (about 12.9% compared with about 3.5% for the natural gas-based flue gas) is closer to that seen in coal flue gas, can be used for CO2 capture. In the CHP plant, the natural gas is combusted in a gas turbine and the flue gas content and  characteristics are similar to those of a combined cycle gas turbine (CCGT) power plant.

One of the testing facilities in place at TCM DA is a highly flexible and well-instrumented generic amine plant, designed and constructed by Aker Solutions and Kværner, aimed to accommodate a variety of technologies with capabilities of treating flue gas streams of up to 60,000 Sm3/hr. This plant is being offered  to vendors of solvent-  based CO2 capture technologies to primarily test: (1) the performance of their solvent technology; and  (2)  technologies aimed to reduce the atmospheric emissions of amines and amine-based degradation products from such solvent-based CO2 capture processes.

Between December 2013 and February 2014, a monoethanolamine (MEA) solvent campaign was performed  as  part of Aker Solutions’ test campaigns at TCM DA treating CHP flue gases. During this period, two aerosol measurement campaigns were performed as a collaboration between TNO and TCM  DA in order  to  investigate amine emissions via the mechanisms of aerosols and the effectiveness of commercially available knitted wire mesh demisters.

This work is part of a continuous effort of gaining better understanding of the performance potential of the non- proprietary aqueous MEA solvent system, conducted  by TCM DA and its affiliates and owners, in order to test,  verify, and demonstrate CO2 capture technologies.

2.  Aerosol Emission: mechanism and impact

Volatile amine emission can be considered as well understood, and is usually related to the volatility of the amine compound(s), gas to liquid flow ratios in the absorber column, etc. Countermeasures such as water wash and acid  wash sections can be properly designed in order to mitigate such volatile amine emissions [1]. However, recently it  has been seen that under certain conditions significant amine emission can occur via aerosols. Although the detailed mechanism is not yet fully understood, it is generally accepted that a gas phase mass transfer mechanism of amines into aerosols present in the flue gas results in increased amine emissions. The size, number, and types of particles present in the flue gas before the absorber are important parameters [2-4]. Condensation or adsorption of amines and water on particle surfaces or (physical) absorption of amines into aqueous particles may contribute to the increased emissions [5]. Typically, this would lead to sub-micron sized aerosols containing amines [6]. Traditional countermeasures like demisters and water or acid washes are not suitable to remove such aerosols. Amongst others, options such as electrostatic precipitator (ESP) and Brownian demister units have been studied, but these options would lead to significant additional cost [7,8]. To be able to design more cost effective countermeasures, it is needed  to improve the understanding of the mechanism of aerosol formation. TNO has been working on a new methodology for the isolation of the aerosols from flue gas, given in details below. By creating more knowledge on the size and composition of these aerosols, steps can be made for developing detailed models. This methodology has been demonstrated at the TCM DA amine plant.

The flow schematics for the TCM DA amine plant treating CHP flue gas is shown in Fig. 1 and a picture of the amine plant is shown in Fig. 2.


Fig. 1. Simplified flow schematic for TCM DA amine plant treating CHP flue gas
Fig. 2. TCM DA amine plant. The direct-contact cooler is situated to the right, the concrete absorber tower in the middle, the two stripper columns to the left, and the lean vapor compressor system to the far left. The platforms towards the upper part of the absorber towers indicate the access location for the sample ports for the aerosol measurements

The nominal characteristics of flue gas from the CHP source both before and  after  the  direct-contact  cooler (DCC) treatment are shown in Table 1. The primary purpose of the DCC is to temperature control and water saturate the flue gas, in addition to scrub the flue gas with process water. The CHP flue gas is typical of high excess air combustion turbine exhaust.

Table 1. Nominal characteristics of CHP flue gas supplied to TCM DA CO2 capture plant.

The direct-contact cooler (DCC) system initially quench and lower the temperature  and  saturate  the  incoming flue gas by a counter-current flow water in order to improve the efficiency of the absorption process and provide pre-scrubbing on the flue gas. The DCC column designed for CHP flue gas operations has a 3-m diameter and a     total height of 16 m. The section where water counter currently contacts the flue gas is of 3.1  m  height  with Flexipack 3X structured stainless-steel packing of Koch Glitsch. Above the contact section is a 0.2 m Meshpad demister type 412 of FMC Technologies with an overhead water sparging system.

The purpose of the absorber is to remove CO2 from the flue gas using solvent. The absorber has a rectangular polypropylene-lined concrete column with a cross-section measuring 3.55 x 2 m of a total of 62 m of height. The  lower regions of the tower, where the amine solution contacts the flue gas, consist of three sections of Koch Glitsch Flexipac 2X structured  stainless-steel packing of 12 m, 6 m,  and 6 m of  height, respectively. Water-wash systems  are located in the upper region of the tower to scrub and clean the flue gas particularly of any solvent carry over, and consist of two sections of Koch Glitsch Flexipac 2Y HC structured stainless-steel packing of both 3 m of height. The process is operated to be water neutral in order to maintain water balance, i.e. the recirculating water  washes at the  top of the absorber are used to temperature control the depleted flue gas for water content control. If water  accumulates in the absorber-stripper loop, the flue gas temperature leaving the absorber is allowed to increase, increasing the water vapor content of the depleted flue gas, and vice versa.

The absorber tower includes two demisters located above the absorption section: one is installed below the lower water wash section to reduce the amount of amine entrained with the flue gas exiting the absorption section, and the other one is installed above the upper water wash section  to reduce amine contaminated  water entrainment released  to air with the flue gas. Both demisters are 0.3 m knitted wire mesh demisters type 172 of Koch Glitsch.

The CO2 depleted flue gas exits the absorber column to the atmosphere through a 1 m diameter  nozzle stack  located at the top of the absorber column in order to increase the flue gas velocity and lift.

The TCM amine plant is described in further details elsewhere [9-12].

3.  Design and Construction of Aerosol Emission Detector

The design of the aerosol sampling equipment was made specific for the conditions at TCM DA. A superficial velocity of 2  m/s  was taken as the reference,  with an anticipated  variation of this velocity in the range  of 1.5  m/s to

2.5 m/s during the measurement campaign. The aerosols were to be sampled at a typical distance of 0.6-1.0 meter  from the inside of the absorber wall, and equipment had to fit to a standard ASME B16.5 size flange on site. The pressure at the top of the demister was atmospheric, and within the absorber of  typically  10-40  mbar  excess  pressure. These data were used to set design requirements for the aerosol sampling equipment. Construction of the equipment and settings of flow and temperature during experiments were then as close as reasonably practical to the design requirements derived from the above conditions.

The basic design of the sampling system consisted of 1) a probe with nozzle inserted into the absorber tower, 2) a piece of glassware that splits the incoming flow, and 3) an Anderson Cascade Impactor (ACI) that separates the  aerosol in different particle size ranges. Some of the sampling system is shown in Fig. 3. The flow exiting the glassware (in Fig. 3) downwards is towards the  ACI  and should be 28.3 l/min,  whereas  the flow exiting to the right is to adjust the flow profile  near the  nozzle of the probe in order to operate  close to iso-kinetic conditions. The  nozzle of the probe and the tube inside the flow splitting section, are tapered in order not to disturb the flow profile.

Fig. 3. Glassware that directs part of the incoming flow towards the impactor and an additional flow to match the sampling system to the probed conditions and operate under near-isokinetic sampling conditions (left). Demounted Anderson Cascade Impactor with 8 stages each containing a nozzle plate and a tray for aerosol collection (right).

The ACI is a standard measurement device to determine aerosol particle size distributions. The challenges of this application are 1) the transfer of the aerosol from within the absorber towards the ACI  positioned  outside  the absorber and without deposition of aerosols in this flow path or a change in particle size distribution, 2) collection of liquid instead of solid aerosol particles from a (nearly) saturated vapor, and 3) handling the ACI with associated equipment and shielding those against the influence of weather and temperature conditions on experimental results.

The ACI requires a precise flow of 28.3 l/min, and collects the aerosol particles on 8 different trays (stages). Meeting the flow requirement means that particles sizes are collected in the following ranges: > 9 mm in stage 1, 5.8-9.0 mm, 4.7-5.8 mm, 3.3-4.7 mm, 2.1-3.3 mm, 1.1-2.1 mm, 0.65-1.1 mm and 0.43-0.65  mm in stage 8.  As the  Stokes number, the particle stopping distance divided by the nozzle radius, is a constant for each tray, one can derive from the impactor design equations in [13] that with an increase of the actual flow particles of smaller diameter are caught on each tray. Abovementioned particle ranges change with actual flow Qactual according to

The additional flow to create horizontal streamlines within the flow splitting section of Fig. 3. can be calculated from the dimensions of the inner tube ( Øint=13 mm, Øext=13 mm) and the outer tube (Øint=26 mm). The additional flow is 58.9 l/min, yielding a total flow of (28.3 + 58.9) l/min = 87.2 l/min.

With an internal diameter of the probe of 12.4 mm, it follows that 87.2 l/min will lead to a flow velocity in the probe of 12.0 m/s. The probe has a nozzle with 25.4 mm internal diameter and was chosen to be close to the iso- kinetic sampling condition as demonstrated in Tab. 2, by comparison of the upward flow through a 25.4 mm diameter area and the 87.2 l/min total flow drawn in through the nozzle.

The condition of horizontal streamlines in the flow splitting section is preferred over  iso-kinetic  sampling,  because of the sampling over a large particle size interval. The upward flow is somewhat smaller than the  flow through the probe, indicating that the flow near the probe nozzle must be slightly convergent.

Table 2. Comparison of upward flow in tower with flow of 87.2 l/min towards the aerosol sampling equipment, and based on dimensioning of probe and nozzle, and based on superficial velocity in the tower.

The transport efficiencies due to settling in the tubes are calculated, as  well as the concentration variation across  the nozzle due to non-isokinetic sampling. Transport efficiencies should be close to 1 (i.e. 100% of aerosol particle transfer along the probe length), and concentration variation across the nozzle should be negligible. Both transport efficiency and concentration variations can be evaluated as function of aerosol particle size by using the equations provided in [14]. The transport efficiency 11probe,grav for aerosol transport along the probe which accounts for gravitational deposition, is calculated using

In eq. (1) Lprobe is the length of the probe, dprobe the inside diameter of the probe, Vts the terminal settling velocity of particles, Vgas the velocity of the gas in the probe, and  8 the inclination of the probe. The terminal settling velocity is   a function of the aerosol particle density p, the particle diameter dparticle, the Cunningham slip correction factor Cc, gravitational acceleration g, and the flue gas viscosity m.

The aspiration efficiency accounting for concentration change at the inlet nozzle is calculated using

In eq. (2) C is the particle size dependent concentration in the inlet of the probe, C0 is the particle size dependent concentration of the aerosol in the absorber, Vabsorber is the superficial velocity of the flue gas in the absorber tower, Vinlet probe is the velocity of the gas in the nozzle at the inlet probe and which has a diameter dinlet probe. and Stk the Stokes number.

The product of eqs. (1) and (2) gives the expected ratio of the concentration at the inlet  of the impactor and the  aerosol concentration in the absorber.

Calculations results are shown here for superficial velocities of 1.5, 2.0 or 2.5 m/s, a nozzle internal diameter of

25.4 mm, a probe diameter of 12.4 mm and probe length of 1.0 or 2.0 m and a velocity in the probe of 12.0 m/s. Calculations  were performed  for  an  aerosol  in air,  a temperature  of 40  °C,  and  a pressure  of 101.2  kPa.  The

Reynolds number in the probe is 9850 and is just in the turbulent regime. The calculated transport efficiencies according to laminar flow or to turbulent flow, are approximately the same. Note that the ACI measures in the range 0.43 – 11 mm.

The length of the probe has a relatively large influence on the transport efficiency.  For a 1  m probe more than  97% of 10 mm particles will be transported (i.e. less than 3% will settle in the tube), while for a 2 m probe still 95%   of 10 mm particles will be transported, see Fig. 4.

With a flow velocity of 1.5, 2.0 and 2.5 m/s, respectively, more than 97%, 98% and 99% of the 10 mm particle concentration in the absorber, will be present inside the inlet of the probe, see Fig. 5.

The overall effect (concentration change at the inlet, and transport efficiency through the tube) indicates  that  for  10 mm particles between 92% (1.5 m/s, 2.0 m) and 97% (2.5 m/s, 1.0 m) will reach the ACI, see Fig. 6. For smaller aerosol particles the figures will be better. For 3 mm particles, one calculates that more than 99% will reach the ACI.

Fig. 4. Aerosol transport efficiency as function of particle diameter, for two different probe lengths.
Fig. 5. Concentration change at nozzle inlet as function of particle diameter, due to non-isokinetic sampling conditions.

Fig. 6. Ratio of measured aerosol particle size distribution and true aerosol particle size distribution, as function of particle diameter. The ratio depends on probe length as well as near-isokinetic sampling conditions.

Even though it is clear one should minimize the probe length for a better aerosol capture, a minimum length is needed to bridge distance in practice. The minimum probe length is 191 cm, based upon a  measurement 60 cm into  the absorber, a 50 cm absorber  concrete  wall thickness, 71 cm from wall to spool tee, and 10 cm external to spool  tee. The data in Fig. 4 and Fig. 6 corresponding to a 2 meter probe length are therefore relevant to the experiments.

The glass probe was mounted with thermocouple for measurement  of the local absorber temperature, and  with  heat tracing into a metal tube. The metal tube can be inserted at the various measurement locations available at the absorber tower. The flow split section with ACI was located in an isolated box with temperature control, which was connected to the nozzle, see Fig. 7. In the experimental campaign the logged temperature in the aerosol box was maintained 2 to 4.4 °C above the temperature at the sample point, because of the finding under laboratory conditions that aerosol collection from a saturated vapor will lead to condensation on the impactor surface starting at the lowest nozzle plates with the smallest holes. This condensation should not spill over to the collection trays inside the  impactor and thus limits the duration of a vapor collection experiment.

Fig. 7. Aerosol box with impactor, mass flow controllers, temperature control and desiccant, during laboratory testing phase (left). Condensation of a vapor from a saturated vapor flow with aerosol particles onto one of the impactor nozzle plates (right).

4.  Results at Technology Centre Mongstad

There is a demister above the absorption section and a demister above the water wash section in the  absorber  tower. A total of four sampling locations were available for aerosol sampling, upstream and downstream the two demisters. Sampling location 1 and 2  are respectively upstream and downstream the lower demister, i.e. located  above the absorption section, and sampling location 3 and 4 are respectively upstream and downstream the upper demister, i.e. located above the upper water wash section.

Measurements were performed in two campaigns, in December 2013 and in February 2014. The sampling  locations, temperatures in the absorber and measurement  durations are indicated in Tab.  3. In the  four experiments  in December it was noticed that liquid was collected in the flow splitting section in the aerosol box. It seems that the cold environment and the long external tube lowered the temperature of the probe, even though the flue gas may circulate around the probe and despite the short contact time of the sampled gas in the probe.  An external heating  band was added to the 2 meter long probe for the last two experiments, with trace heating controlled by the temperatures measured at the tip of the probe and halfway the probe.

An important aspect is the collection of filter papers from the ACI. In contrast to a laboratory environment the experiment is carried out in the open and at high elevation. It was decided to transfer the ACI from the absorption tower to a remote location and there disassemble the ACI, weigh, and store the filter papers.

Table 3. Location of aerosol sampling, temperature in the absorber tower, and measurement duration for each of 6 experiments.

The total mass of aerosols collected by the ACI and  the calculated aerosol concentration are given in Tab. 4, for  the experiments with trace heating of the probe. Further to the intended aerosol sampling, 5 mL/min of the flow leaving the ACI and thus free from aerosols, was passed through a series of three aqueous sulfuric acid filled impingers. The vapor concentration calculated from the measured weight increase of the flasks with  aqueous  sulphuric acid is presented in Tab. 4, as well as the amine content of the vapor determined by LC-MS. The vapor concentration in experiment 5 is below 21·103 mg/Nm3; the latter value corresponding to the maximum amount of condensable water vapor at the process temperature. The MEA emissions in the vapor phase as found by chemical analysis by LC-MS in the current work, are similar to the reported MEA emissions in the order of 10-2 mg/Nm3 by Morken et al. [12]. This reference reports absorber stack emission results from the MEA campaign applying iso- kinetic gas measurements.


Table 4. Total mass of aerosol (water and amine) collected by the ACI and the calculated aerosol concentration, as well as the total vapour concentration (water and amine) calculated from weight increase impinger, during 1 hour experiment.

The particle size distributions are given in Fig. 8. Series 6 is a measurement of the aerosol particle distribution directly above the wash section and before the demister. Aerosols have a size in the range of 0.43 to 4.7 mm. The measurement on stage 7 seems too high; and one should note that in the  laboratory condensation  was  noticed  starting at the lower nozzle plates, with the risk of droplets falling down on the tray below, see Fig. 7.

Series 5 is a measurement of the aerosol as in series 6 only after passing the demister. Broadly the same particle  size range is observed, from 0.65 to 4.7 mm, with a maximum near 3 mm. This is expected as a demister would be effective typically at particle sizes of 10 mm and above.

Fig. 8. Particle size distributions in series 5 and 6, with particle size decreasing towards higher stage number.

5.  Conclusions and recommendations

The following conclusions can be drawn from the aerosol measurement campaign.

  • One can design and optimize aerosol transfer and aerosol collection devices  from  aerosol  kinetics  theory. Effective transfer of aerosols with particle sizes up to 10 mm and over a 2 meter distance should result in a loss of aerosol particles of at most 8 % (i.e. for the largest particles size) for the designed equipment and under flow conditions.
  • Aerosol collection from a nearly saturated vapor stream requires strict control  over  impactor  temperature, and limits the duration of aerosol collection. Also the probe requires temperature tracing to avoid preliminary conditions during aerosol transfer.
  • Small amounts of aerosols are present with particles up to 4.7  mm. The total concentration on mass basis  is around 100 mg/Nm3.
  • The aerosols contain for the largest part water. Total amine emissions, emissions based on volatility and aerosol formations, are very low.

A recommendation for future experiments is to analyze the amine concentration of  the  aerosol  samples  by directly transferring the filter papers put on individual stages of the impactor into vials with a known quantity of an aqueous sulfuric acid solution. The extent of evaporation is thus minimized, and samples can safely be analyzed at a later moment for example with LC-MS, providing an amine concentration per particle size range. This, however, would be at the expense of determining the total mass of water and amine per particle size range.

The measurements presented here are in the absorber tower. In a risk assessment of amine plants for CO2 capture, the relation between discharge rates from the absorber at TCM Mongstad and downstream concentrations in air and drinking water were compared to NIPH guidelines values [15]. Nitrosamine and amine discharge values were considered acceptable.

  1. Khakharia, P., Huizinga, A., Jurado Lopez, C., Sanchez Sanchez, C., De Miguel Mercader, F., Vlugt, T.J.H., Goetheer, E. Acid wash scrubbing as a countermeasure for ammonia emissions from a postcombustion CO2 Capture Plant (2014) Industrial and Engineering Chemistry Research, 53 (33), pp. 13195-13204.
  2. Kamijo, T., Kajiya Y., Endo, T., Nagayasu, H., Tanaka, H., Hirata, T., Yonekawa, T., Tsujiuchi, T. SO2 impact on amine emissions and emission reduction technology (2013) Energy Procedia 37, pp. 1793-1796.
  3. Bade, O. M., Knudsen, J. N., Gorset, O., Askestad, I. Controlling amine mist formation in CO2 capture from Residual Catalytic Cracker (RCC) flue gas (2014) Energy Procedia 63, pp. 884-892.
  4. Khakharia, P., Brachert, L., Mertens, J., Anderlohr, C., Huizinga, A., Fernandez, E.S., Schallert, B., Schaber, K., Vlugt, T.J.H., Goetheer, E. Understanding aerosol based emissions in a Post Combustion CO2 Capture process: Parameter testing and mechanisms (2015) International Journal of Greenhouse Gas Control, 34, pp. 63-74.
  5. Khakharia, P., Brachert, L., Mertens, J., Huizinga, A., Schallert, B., Schaber, K., Vlugt, T.J.H., Goetheer, E. Investigation of aerosol based emission of MEA due to sulphuric acid aerosol and soot in a Post Combustion CO2 Capture process (2013) International Journal of Greenhouse Gas Control, 19, pp. 138-144.
  6. Mertens, J., Brachert, L., Desagher, D., Thielens, M.L., Khakharia, P., Goetheer, E., Schaber, K. ELPI+ measurements of aerosol growth in an amine absorption column (2014) International Journal of Greenhouse Gas Control, 23, pp. 44-50.
  7. Mertens, J., Anderlohr, C., Rogiers, P., Brachert, L., Khakharia, P., Goetheer, E., Schaber, K. A wet electrostatic precipitator (WESP) as countermeasure to mist formation in amine based carbon capture (2014) International Journal of Greenhouse Gas Control, 31, pp. 175-181.
  8. Khakharia, P., Kvamsdal, H.M., Da Silva, E.F., Vlugt, T.J.H., Goetheer, E. Field study of a Brownian Demister Unit to reduce aerosol based emission from a Post Combustion CO2 Capture plant (2014) International Journal of Greenhouse Gas Control, 28, pp. 57-64.
  9. Thimsen D, Maxson A, Smith V, Cents T, Falk-Pedersen O, Gorset O, Hamborg E S. Results from MEA testing at the CO2 Technology Centre Mongstad. Part I: Post-Combustion CO2 capture testing methodology. Energy Procedia 63 (2014) 6012–6022.
  10. Hamborg E S, Smith V, Cents T, Brigman N, Falk-Pedersen O, De Cazenove T, Chhaganlal M, Feste J K, Ullestad Ø, Ulvatn H, Gorset O, Askestad I, Gram L K, Fostås B F, Shah M I, Maxson A, Thimsen D. Results from MEA testing at the CO2 Technology Centre Mongstad. Part II: Verification of baseline results. Energy Procedia 63 (2014) 6012–6022.
  11. Brigman N, Shah M I, Falk-Pedersen O, Cents T, Smith V, De Cazenove T, Morken A K, Hvidsten O A, Chhaganlal M, Feste J K, Lombardo G, Bade O M, Knudsen J, Subramoney S C, Fostås B F, De Koeijer G, Hamborg E S. Results of amine plant operations from 30 wt% and 40 wt% aqueous MEA testing at the CO2 Technology Centre Mongstad. Energy Procedia 63 (2014) 6012–6022.
  12. Morken A K, Nenseter B, Pedersen S, Chhaganlal M, Feste J K, Tyborgnes R B, Ullestad Ø, Ulvatn H, Zhu L, Mikoviny T, Wisthaler A, Cents T, Bade O M, Knudsen J, De Koeijer G, Falk-Pedersen O, Hamborg E S. Emission results of amine plant operations from MEA testing at the CO2 Technology Centre Mongstad. 63 (2014) 6012–6022.
  13. Marple, V.A., Willeke, K., Impactor design, Atmospheric Environment Vol 10 (1976) 891-896.
  14. Chapter 6, Sampling and transport of aerosols, J.E. Brockmann, in Aerosol Measurement, Principles Techniques and Applications, eds. K. Willeke and P.A. Baron.
  15. De Koeijer, G., Randgaard Talstad, V., Nepstad, S., Tønnessen, D., Falk-Pedersen O., Maree, Y., Nielsen, C., Health risk analysis for emissions to air from CO2 Technology Centre Mongstad, International Journal of Greenhouse Gas Control 18 (2013) 200–207

Controlling amine mist formation in CO2 capture from Residual Catalytic Cracker (RCC) flue gas (2014)

Otto Morten Bade*, Jacob Nygaard Knudsen, Oddvar Gorset, Inga Askestad

Aker Solutions, PO Box 222, NO-1326 Lysaker, Norway *Corresponding author

1876-6102 © 2014 The Authors. Published by Elsevier Ltd. This is an open access article under the CC BY-NC-ND license
(http://creativecommons.org/licenses/by-nc-nd/3.0/).
Peer-review under responsibility of the Organizing Committee of GHGT-12
doi: 10.1016/j.egypro.2014.11.098

Aker Solutions has developed a novel emission control system involving the combination of anti-mist design and an acid wash polishing step. This concept was tested at a 200 kg/h CO2 Mobile Test Unit (MTU) operating on flue gas from a Residual Catalytic Cracker (RCC). It was found that the RCC gas contained relatively high concentration of H2SO4 mist (up to 33 mg/Nm3) compared to what is typically seen from a modern coal-fired power station. The high concentration of H2SO4 nuclei generated high amine emission (>200 ppm) when the MTU was operated in conventional mode. On the other hand when the MTU was operated in anti-mist mode the emissions were greatly reduced and amine emissions down to 2 ppm were confirmed by manual emission measurements. A test with conventional mist abatement technology (Brownian diffusion filter) installed upstream the MTU was also performed. It was shown that the filter had large removal efficiency of H2SO4, however still significant amine emissions persisted when the MTU was not operated in anti-mist mode. The results clearly demonstrate that the Aker Solutions’ Anti-Mist design is an attractive option for mist abatement compared to conventional technology.

1.  Introduction

In recent years the focus on potential emission of amines and amine degradation  production  from  post  combustion capture (PCC) plants has increased substantially. In particular emissions of amines and harmful degradation products such as nitrosamines and nitramines are a concern. Direct emissions of nitrosamines and nitramines can largely be avoided by selecting amine solvents that do not form stable nitrosamines and nitramines at the conditions prevailing in the capture process.  However, emission of compounds containing amine  groups are still   a concern as these compounds may undergo  nitrosation in  the atmosphere to  form nitrosamines or nitramines. For  this reason it has been a key priority for Aker Solutions to develop emission control technology that can secure low emissions of amines to the environment. Amines and other  degradation products may in principle be emitted from  post combustion plants by three different mechanisms: Gas phase emission, entrainment of liquid droplets as well as mist (aerosol) formation. Where conventional emission control technologies such as water wash sections  and  demisters have been an integral part of the design of amine based CO2 capture plants for  years,  typically  no abatement technologies have been implemented to deal with amine mist. Amine mist may be formed in the CO2 absorber when vapor phase amine is absorbed in fine mode water droplets (mist). Because of the tiny particle size of the mist particles they tend to penetrate wash sections and conventional demisters. Thus, there is a risk that the conventional emission control technologies may not be sufficient to  meet the stringent emission limits that are likely  to be imposed on large-scale PCC plants.

In a previous work [1], the Aker Solutions’ Mobile Test Unit (MTU) was located at Southern Company’s Ernest

C. Gaston Electric Generating Plant/National Carbon Capture Center (NCCC) in Wilsonville, Alabama, USA. The MTU was operated on flue gas from unit 5, a modern coal-fired boiler equipped  with DeNOx, ESP and  wet FGD.  The MTU is equipped with Aker Solutions’ novel emission control system, which  consists  of a  novel  absorber design to prevent amine mist formation and a final pH-controlled wash stage to eliminate emissions of  volatile alkaline compounds. The tests showed that significant emissions of solvent amines in the form of mist  may occur  with conventional emission control technology. However, the formation and emission of amine mist could nearly be eliminated with Aker Solutions’ Anti-Mist design. In addition, the tests showed  large  removal  of  volatile  compounds like ammonia and alkyl amines. Thus, all in all the tests indicated that Aker Solutions’ novel emission control concept could virtually eliminate emissions of amines and other alkaline constituents when treating flue gas from a typical coal fired power plant.

In this work, a test campaign with flue gas from the Residual Catalytic Cracker (RCC) at Mongstad Refinery has been conducted at the Aker  Solutions’ Mobile Test Unit. The aim was to test Aker Solutions’  Anti-Mist system on  the RCC gas. The work was done in cooperation with TCM DA. The campaign included a test with a Brownian Diffusion (BD) filter temporary installed on the flue gas supply line  upstream of the MTU. The filter  was installed  and operated by TCM DA. The tests were performed with one of Aker Solutions’ advanced amine solvents.

2.  Test facility and Test Program

2.1 Mobile Test Unit

All the test results reported in this paper are based on test campaigns conducted at Aker Solutions’ Mobile Test Unit (MTU). The MTU is a custom-built mobile test CO2 capture facility, which can be used to capture CO2 from different industrial flue gases. The facility is used to verify new design features and solvents, and operates in an industrial environment during long-term testing. The facility is designed for easy transport  and  hook-up,  which means that it can be transported to different sites.

The MTU was first commissioned in 2008 and since then several test campaigns have been conducted at different test locations and with different solvents [2, 3]. Amongst others verification of emission control technology and emissions has been an area of attention [2, 3]. Process improvements and new technology have been implemented in the MTU on a continuing basis.

A picture of the MTU is shown in Figure 1. The MTU was located at CO2 Technology Centre Mongstad in the period June 2012 to March 2014. The design of the MTU is based on conventional amine absorption/desorption process with full packing height absorber and desorber columns. Several novel features are installed such as Aker Solutions’ Energy Saver and proprietary emission control technology. The MTU absorber is fitted with two pump- around water wash sections in series. An acid wash is located above the two water wash sections. Extensive instrumentation is implemented at the MTU and all on-line signals are logged in historical databases.

During 2011and 2012 the MTU was modified to include Aker Solutions’ Anti-Mist Design to significantly reduce emissions of amine mist. Key design data and specifications of the MTU are shown in Table 1.


Figure 1. Picture of the MTU (Blue container with absorber and stripper tower in front of the TCM DA Amine Plant at Mongstad).

The MTU is equipped with a permanent FTIR online emission monitoring system from GasmetTM. The FTIR is connected via heated sampling lines (180°C) to sampling probes at the absorber inlet (downstream DCC), absorber outlet and desorber overhead condenser outlet. The FTIR is calibrated for a list of standard flue gas pollutants, e.g.  CO, CO2, SO2, HCl, NO, NO2, NH3, as well as MEA and Aker Solutions’ solvent amines.


Table 1. MTU Key design data and specifications

2.2 Test program

For the tests reported in this paper the MTU was located at CO2 Technology Centre Mongstad (TCM DA), Norway. The MTU was operated on flue gas from the RCC unit at the Statoil Mongstad Refinery. The RCC unit is equipped with SNCR, dry ESP and seawater FGD. Off gas from a Sulfur Recovery Unit is mixed into the RCC flue gas upstream of the Seawater FGD. The combined  RCC and SRU  gas  is quenched  from approx. 300 °C to approx. 25 °C in the FGD. Flue gas to the MTU was extracted from the FGD outlet duct. Between tie in on FGD and MTU,  the flue gas path contains a booster fan,  a cyclone for particulates removal, a DCC for temperature control. There is  no pH control on the DCC. The flue gas entering the MTU  is water saturated  with a temperature of approx. 25 °C  and contains approx. 14% CO2, 20-60 ppm SOx, approx. 80 ppm NOx and traces of RCC catalyst fines.

Inside the MTU unit, there is another DCC with pH control and caustic dosing. The SO2 content into the MTU amine absorber is typically 0- 2 ppm.

Data is reported from a MTU test campaign conducted in the period May – October 2013. The scope of the test campaign was to test Aker Solutions’ novel emission control system for mist abatement on flue  gas  containing sulfuric acid aerosols and acidic catalyst fines. The MTU is equipped with Aker Solutions’ Anti-Mist design.  The Aker Solutions’ Anti-Mist design is patent pending.

2.3 Test procedures

The anti-mist design in the MTU has been implemented in a flexible way that allows switching between conventional mode and anti-mist mode operation within a time frame of say 15-60 minutes. In this way it has been possible to directly demonstrate the benefits of the anti-mist design on amine emissions.

Prior to switching from conventional to anti-mist mode operation and vice-versa, the MTU was  held  in steady  state operation. This means that the main operational parameters such as capture rate, reboiler temperature, desorber pressure, flue gas and solvent flow rates were maintained at fixed values. The MTU was operated with two  water  wash stages during the entire campaign. During the entire test campaign the emissions of amine from the absorber were monitored by the online FTIR system.

In order to differentiate between vapor phase and mist phase emission,  the acid  wash section located above the  two water wash sections was set in operation in periods during the test campaign. The acid section is known to efficiently absorb vapor form alkaline compounds such as amines and ammonia. No cooling was applied in the acid wash system in order to avoid condensation of water from the flue gas and thereby bleeding of acid wash water. The acid dosing is based on pH control.

As a conventional alternative to anti-mist operation, a Brownian Diffusion (BD) filter was temporary installed  inline on the flue gas supply line to the MTU. The aim was to operate the MTU in “conventional mode” (not anti-mist mode) and investigate the performance of the BD filter with respect to mist formation in the MTU absorber. Testing of the BD filter was done in cooperation with TCM DA. The filter was hired by TCM DA from Begg Cousland Envirotec Limited. The BD pilot rig (Figure 2) consists of a wetted rotating brush, followed a Brownian Diffusion type candle filter installed inside a vertical vessel. Water spin off from the brush and water coming from  mist coalescing inside or at the inner surface of the fabric candle is collected at the bottom of the vessel and drained out. The BD filter was assembled and operated according to instructions given by the supplier.


Figure 2: Brownian Diffusion (BD) filter.

Online FTIR emission monitoring: The MTU’s permanent FTIR system was used for online monitoring of amine emissions from the absorber during both test campaigns. The FTIR technique has the advantage that the sample gas    is measured at actual conditions without any preconditioning, hence reducing the risk of analyte loss. To avoid condensation of water in the  sampling system and the analyser, the  FTIR gas cell and the sampling lines are  heated  to 180°C. This also has the advantage that any target compounds that is present as mist or  droplets  will  be  evaporated and analysed. Hence, the FTIR monitor provides the total content of the different analytes in the flue gas. The experience from the MTU is that reliable NH3 and amine readings down to approximately 1 ppmv can  be obtained.

Manual emission measurements: Manual emission measurements were conducted at the outlet of the MTU  absorber (stack) during stable operation to quantify the amine emissions and hence verify the FTIR readings. A sampling train consisting of a short unheated isokinetic probe connected to 4 impingers in series was applied. The impingers were filled with 0.05 M sulfuric acid as absorbent and placed in an ice bath. Flue gas was isokinetically drawn through the impingers and a silica gel dryer by the means of a gas tight pump. A gas meter was used to quantify the sampled amount of flue gas. The whole sampling system is provided by Paul Goethe  GmbH  in  Germany. Each measurement lasted for 1-2 hours. The impinger samples were analyzed by LC-MS.

Particulate measurements at absorber inlet: Particulate measurements according to EPA method  5  were  conducted on the absorber inlet, both with and without  the Brownian diffusion filter installed. Isokinetic sampling  was performed with probe and filter holder heated to 90 °C, in order to avoid any condensation of water but at the same time avoid loss of sulfuric acid due to vapor phase break through. The filters were pre-dried overnight in a desiccator prior to sampling, and immediately placed in desiccator after sampling until weighing was done. Total amount of particulates were determined  gravimetrically. The filters were extracted in demineralized  water, which  was analyzed for anions and cations by IC.

3.  Results and Discussion

3.1 Reducing mist borne amine emissions through Aker Solutions’ novel Anti-Mist design

With conventional operation (i.e. no anti-mist operation) on the RCC flue gas, massive  amine  mist  formation  was seen as a dense plume from the absorber stack and as high amine recordings on the online FTIR.  Hence  very  little conventional operation was conducted, as the permit to operate was limited to a total amine emission below 6 ppm on a 24 hour basis. Some short duration attempts with conventional operation were  performed,  and  amine  spikes sometimes above 200 ppm were recorded by the FTIR.

During the MTU anti-mist operation on RCC gas in September 2013, the FTIR indicated total amine emissions

in the range 1-4 ppm. The high emission spike on 25th of September as shown in Figure  3  was due to a test,  where  the anti-mist system was switched off for 30 minutes. The FTIR recorded an amine spike of >200 ppm. The flue gas flow rate of 400 Sm3/h and capture rate of approx. 90% was not changed. The acid wash section was not in service.


Figure 3. Emission of solvent amines during operation alternating between conventional and anti-mist mode.

In another test, with stable anti-mist operation and few ppm emission of amine, the acid  wash  was  tested  for some time in order to distinguish between mist phase emission and gas phase emission. The acid wash removes volatile alkaline compound but not mist borne emission. It was observed that ammonia emission was reduced to     very low levels  while amine emission dropped only marginally, indicating that  mist borne amine emission is far  more significant compared to gas phase emission of amines.

3.2 Results from particulate measurements and test with flue gas pre-cleaning using Brownian diffusion (BD) filter

Particulates measurements were performed on the flue gas entering the MTU. The amount of particulates were determined gravimetrically. The total amount of collected material was approximately 30 mg/Nm3.  The  filter  samples were extracted in water and analysed for ions. The results showed that  most of the collected mas consisted   of sulphate anions. It is also anticipated that a fraction of the total collected mass consists of RCC catalyst fines.

Tests in October 2013 were conducted  with a Brownian diffusion (BD) filter installed upstream the MTU. The  aim was to operate the MTU in “conventional mode” (not anti-mist mode) and investigate the performance of the   filter with respect to mist formation in the MTU absorber. The BD filter is known to be efficient for removal of sub- micron particulates. By removing the mist nuclei upstream of the CO2 absorber, the amine mist formation within the absorber should be avoided.

Indeed, particulate measurements performed on flue gas upstream of the absorber confirmed proper efficiency of the BD filter unit. The amount of particulates collected dropped from approximately 30 mg/Nm3 to less than 1 mg/Nm3.


Table 2: Results from dust measurements at MTU absorber inlet. Total “dust” collected and IC analysis on filter catch.

3.3 Results from Manual amine emission measurements

Results from isokinetic measurements are presented in Table 3. The reported figures are from a measurement performed during stable anti-mist operation (without BD Filer) on the 25th of September 2013 and from a  measurement performed during stable conventional operation (without anti-mist) but with BD  filter  installed upstream MTU.

The total amine emission with anti-mist operation was 2.1 ppm, without the BD filter installed. This compared to

7.6 ppm for the test with BD filter treatment on flue gas, but with conventional operation (no anti-mist) of the amine plant. So although the BD filter had large removal efficiency of H2SO4 mist, still higher amine emissions persisted when the plant was not operated in anti-mist mode. The MTU was also operated with anti-mist and with BD filter in place, but unfortunately no  manual emission measurement was performed  for this case. The FTIR indeed showed  low emission.


Table 3: Results from isokinetic emission measurements at MTU absorber stack. The corresponding FTIR readings are reported for comparison.

The results clearly demonstrate that the Aker Solutions’ anti-mist design is an attractive option  for  mist  abatement compared to conventional technology, such as flue gas pre-cleaning  with Brownian Diffusion (BD) filter  or wet ESP. The BD filter has significant pressure drop and potentially a large maintenance cost  due  to  filter clogging over long time operation. Regarding the anti-mist design, there is no increased operating cost of the plant,  and there is no loss of performance. It is anticipated that anti-mist operation avoids amine  mist formation, and that   the residual emission of approx. 2 ppm may stem from amine chemically absorbed on acidic RCC catalyst fines or sulphuric acid fumes that passes through the absorber.

In previous test campaigns at TCM DA, the MTU was operated on flue gas from the natural gas fired Combined Heat and Power (CHP) plant at Mongstad. Emission measurements under that conditions showed ultra-low amine emissions (<0.01 ppm) with Aker Solutions’ full emission control concept. Compared to the RCC gas, the CHP flue gas is very clean and contains very low amounts of particulate  matter including H2SO4 nuclei. Thus, mist formation   is not a significant mechanism for amine emission during operation with CHP gas. The MTU tests on different industrial flue gas sources clearly illustrate that the lower amine emissions can be achieved on the flue gas sources  with the higher purity.

3.4 Challenges related to emission measurements

Manual sampling: It is known that sampling of mist/aerosols in impingers is challenging due to risk of poor  capture rate of the aerosols. The analytical results showed however good ratio of analyte concentration between the impingers. For the test performed with anti-mist operation on the 25th of September, the distribution of amine in the impingers No. 1 to 4 were 94%, 4%, 1% and 1 %, respectively. For the BD filter test without anti-mist operation of  the 16th of October, the amine distribution was even better with 99% of the analyte was collected in impinger 1.

FTIR: An operational challenge was that the FTIR intake filter and microfilter upstream FTIR  cell  quickly became contaminated with RCC catalyst dust. Only few days in operation with new filters showed an increased memory effect (amine and ammonia responses becomes slower). It was also observed that the catalyst dust “cracks” the amine1 to NH3. When provoking mist emission by running short duration conventional operation, a spike of ammonia was seen, while am1 emission was lower than expected. Ammonia is not prone to follow mist, so this increased ammonia emission was ascribed breakdown of amine 1 and formation of ammonia in the FTIR sampling system. This explains why amine 1 is not seen on the FTIR during the manual emission measurements. A large improvement on response and ability to measure amine 1 is seen immediately after filter replacement. Aker has not observed this sort of FTIR issue on earlier sites with coal fired flue gas, meaning that the RCC dust probably creates some specific challenges for the online emission  monitoring. On previous sites, the  filters  were usually replaced  once a year. Note that the Gasmet FTIR sampling system operates at 180 °C.

4.  Conclusion

The Aker Solution’s MTU was operated on flue gas from a Residual Catalytic Cracker (RCC) at Technology Centre Mongstad, Norway. Due to relatively high acid mist concentration in the RCC flue  gas,  conventional  operation of the MTU yielded high amine emission in the form of mist. Amine emissions were reduced with approximately two-orders of magnitude with anti-mist design. In additional, the anti-mist design resulted in lower amine emissions that could be achieved with a BD filter installed. The results clearly demonstrate that the Aker Solutions’ anti-mist design is an attractive option for mist abatement compared to conventional technology.

Acknowledgements

This work has been performed as part of the SOLVit project phase 3. The SOLVit project phase 3 is sponsored through the strategic Norwegian research program CLIMIT. The authors would like to express their gratitude to the sponsors and partners in the program. Also the authors acknowledge the staff at TCM DA for their cooperation and support with the test campaigns.

  1. J.N. Knudsen, O. M. Bade, M. Anheden, R. Bjorklund, O. Gorset, S. Woodhouse: Novel Concept for Emission Control in Post Combustion Capture. Energy Procedia, Vol. 37 (2013), pp. 1804–1813 [1]
  2. Oscar F. Graff and Vibeke Andersson. Staged Development of Carbon Capture Technology. CLIMIT Conference, 12-13 October 2010, Oslo, Oscar F. Graff. Emission measurement Norway.
  3. Oscar F. Graff. Emission measurement and analysis from Mobile Carbon Capture Test Facility. IEAGHG Conference Environmental Impacts of Amine Emission During Post Combustion Capture. 16 February 2010, Oslo, Norway.

Collection overview: Research for more than 10 years