
2. Results from aerosol measurement in amine plant treating gas turbine and Residue Fluidized Catalytic Cracker flue gases at the CO2 Technology Centre Mongstad (2016)
Gerard Lombardoab*, Berit F. Foståsac, Muhammad Ismail Shahab, Anne Kolstad Morkena,c Odd Arne Hvidstena,c, Jan Mertensd, Espen Steinseth Hamborga,c
aCO2 Technology Centre Mongstad (TCM DA), 5954 Mongstad, Norway bGassnova SF, Dokkvegen 10, 3920 Porsgrunn, Norway cStatoil ASA, PO Box 8500, 4035 Stavanger, Norway dEngie Research and Technologies, Simon Boulivardlaan 34, 1000 Brussels, Belgium *Corresponding author

© 2017 The Authors. Published by Elsevier Ltd. This is an open access article under the CC BY-NC-ND license
(http://creativecommons.org/licenses/by-nc-nd/4.0/).
Peer-review under responsibility of the organizing committee of GHGT-13.
Abstract
This work discusses the relation between flue gas particle content, mainly related to sulfuric acid aerosols and dust, and corresponding MEA emissions. The work lays grounds for future necessary pre-treatment options for various flue gases with high aerosol content in order to operate post-combustion amine plants with minimum emissions.
In 2015, the CO2 Technology Center Mongstad (TCM DA), operated a test campaign using aqueous monoethanolamine (MEA) solvent at 30 wt%. The main objective was to demonstrate and document the performance of the TCM DA Amine Plant located in Mongstad, Norway. Two weeks were dedicated to the aerosol measurement testing.
1. Introduction
The CO2 Technology Centre Mongstad (TCM DA) is located next to the Statoil refinery in Mongstad, Norway. TCM DA is a joint venture set up by Gassnova representing the Norwegian state, Statoil, Shell, and Sasol. The facility run by TCM DA entered the operational phase in August 2012 and it is one of the largest post-combustion CO2 capture test centres in the world. A unique aspect of the facility is that either a flue gas slipstream from a natural gas turbine based combined heat and power (CHP) plant or an equivalent volumetric flow from a residual fluidized catalytic cracker (RFCC) unit can be used for CO2 capture. The CHP flue gas contains about 3.5% CO2 and the RFCC flue gas contains about 13-14% CO2. One of the main test plants at TCM DA is a highly flexible and well-instrumented amine plant. The amine plant was designed and constructed by Aker Solutions and Kværner to accommodate a variety of technologies, with capabilities of treating flue gas streams of up to 60,000 standard cubic meters per hour. The plant is being offered to vendors of solvent based CO2 capture technologies to, among others, test; (1) the performance of their solvent technology, and (2) technologies aimed to reduce the atmospheric emissions and environmental impact of amines and amine based degradation products from such solvent based CO2 capture processes. The objective of TCM DA is to test, verify, and demonstrate CO2 capture technologies suitable for deployment at full-scale. Up to now the vendors Aker Solutions, Alstom, Cansolv Technologies Inc. and Carbon Clean Solutions Ltd. have successfully used the TCM DA facilities to verify their CO2 capture technologies.
TCM has so far not been able to operate the amine plant with the RFCC flue gas, due to amine emissions above the TCM emission permit. The high emissions are caused by sulfuric acid aerosols and dust particles present in the flue gas, which is a general phenomenon also observed in other amine plants [9]. To provide for testing with RFCC gas in the amine plant, TCM will install a Brownian Diffusion Filter (BD) to control the particle concentration in the RFCC flue gas and allow for testing at varying particle concentrations. In order to reduce risk, different types of BD filters have been tested in a pilot unit at TCM. Initial testing to evaluate the maximum aerosol number concentration acceptable for operation with a solvent based on MEA was also performed. Results from initial testing are reported in this paper. The relation between flue gas particle concentration and emissions of amine and amine degradation products will be further investigated by TCM.
From July to October 2015 TCM DA, in collaboration with partners, operated a test campaign with CHP flue gas using the non-proprietary aqueous monoethanolamine (MEA) solvent at 30 wt%. Two weeks of the campaign was dedicated to MEA aerosol testing with RFCC flue gas mixed with CHP flue gas.
2. Amine plant overview
2.1 Flow diagram of the tests.
The amine plant test is performed with mixing of a controlled fraction of RFCC gas into the CHP (Combined Heat and Power) flue gas, while doing measurement of particle concentration in the gas upstream the absorber and continuous MEA emission measurement at the absorber outlet. The CO2 concentration in the CHP flue gas is adjusted between 3.7% and 12.8% by a recycle of captured CO2.
The flue gas bypass between RFCC and CHP flue gas is equipped with a flow measurement. The aerosol number concentration and particle size distribution is measured at the absorber inlet with an electrical low pressure impactor (ELPI+, Dekati Ltd.)
The amine and other emissions out of the absorber stack were monitored by the following online analyzers:
- Fourier Transform Infrared Spectroscopy (FTIR), Model: Gasmet FCX
- FTIR, Model: Finetec Anafm 2000
- Proton Transfer Reaction – Time of Flight – Mass Spectrometry (PTR-TOF-MS), Model: PTR-TOF 8000 The analyzer at TCM are described in publication [22]
A Pilot Brownian filter is operated on a side stream of the RFCC flue gas (Figure 1) while doing measurement of particle concentration upstream and downstream the pilot filter with an electrical low pressure impactor (ELPI+, DekatiLtd.).
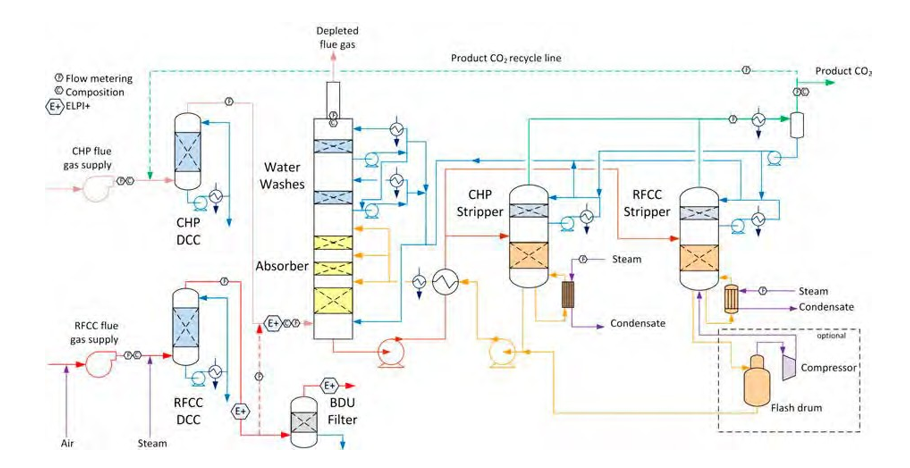
Figure 1. Simplified flow diagram for TCM amine plant prepared for aerosol tests
2.2 Challenges related to aerosol emission measurements.
Aerosol measurements are more complex than gas composition measurements and require the comparison of multiple technologies in order to validate the results. The limitation and benefits of various systems tested at TCM are discussed:
- Online ELPI+
- Online FTIR
- Online PTR-TOF-MS
- Isokinetic sampling [14]
For aerosols, the variable reliability of the various systems is documented [21].
2.2.1 Online ELPI+
An Electrical Low pressure Impactor (ELPI+) [6, 7, 21] measures the particle size distribution and total number concentration of the particles. As most of the particles above a critical size will grow in the absorber, the measurement of the particles upstream the absorber is a valuable data that may be correlated to the amine emissions at the top of the absorber at various process parameters and various solvents. As the flue gas is at saturation with a relative low water concentration and a relative high concentration in sulfuric acid in the aerosols, the measurement of the ELPI+ is reliable and the influence of the dilution during the measurements is acceptable [7].
In the absorber beds, the water concentration of the flue gas is high and variable with possible supersaturation due to the absorber temperature bulge usually observed during CO2 absorption. As a dilution of the sample is necessary for ELPI+ measurement, the effect of the sample dilution may be substantial for high water concentrations in the flue gas. The results may be assessed at various dilution factors, but the measurement incertitude’s remain significant at high water concentration in the flue gas.
The weight distribution of the particles and the concentration of amines in the droplets are necessary for an estimation of the aerosol growth in the absorber. As the concentration of amines in the aerosols is not available, an ELPI+ is not suitable to estimate the weight of amines in the aerosols based on the calculated weight distribution of the particles.
At the stack of the absorber, ELPI+ size distribution measurements are more reliable due to the lower water concentration in the flue gas. Based on the emission results from the FTIR or isokinetic sampling, the masse of amines in the aerosols may be calculated and compared to the weight distribution from the ELPI+. From this comparison, an average concentration of the amine in the aerosols may be estimated.
In case of high emissions due to amines in aerosols, the measurement period is limited due to the accumulation of aerosols on the filters of the ELPI+.
2.2.2 Online FTIR
A Fourier Transform Infrared Spectroscope (FTIR) does not directly measure aerosols but only gaseous compounds. The vaporization of the aerosols is therefore necessary for the quantification of amine emissions via aerosols.
At TCM the FTIR sample line is 101meter long. The line temperature is controlled and may be adjusted from 120ºC to 160ºC. The sample pump ensures under pressure (-0.4barg) in the sample line. This arrangement secures an adjustable vaporization of the aerosols in accordance to the amine properties.
General limitations of FTIR’s:
- If a specific amine is present in both the aerosols and as a gaseous compound in the flue gas, the FTIR cannot distinguish if the emissions are cause by the aerosols or by the gaseous compound. The FTIR results will be limited to the total concentration of the vaporized amine in aerosols and gaseous compound in the flue gas.
- The vaporization of the amine in the aerosols may be highly variable with temperature, amine properties (surface tension), salts and other components that cannot be vaporized from the aerosols. A complete vaporization of the aerosols is usually not feasible.
- If a high temperature is required to vaporize most of the amines in the aerosols, amine decomposition products may be generated in the sample line to the FTIR.
- In case of high emissions, coalescence of aerosols on the sample line walls/bends and accumulation of liquid may occurs. Emissions are underestimated and may be detected after the end of the actual test.
2.2.3 Online PTR-TOF-MS
As a FTIR, the Proton Transfer Reaction Spectroscope does not directly measure aerosols but only gases. The same limitations as FTIR above apply.
2.2.4 Isokinetic sampling
Several procedures are applicable:
- Anderson Cascade Impactor (ACI): tests at TCM are described in a publication [13]. The procedure is complex and comprehensive and requires specific experience by trained operators. Emissions are quantified as mass of aerosols for a particle size distribution. Amine emissions via aerosols are usually not measured.
- Impingers with absorption in liquid: this procedure is described in publication [14]. Tests at TCM confirm that the results for aerosols are not reliable.
General limitations of isokinetic sampling’s:
- The results are only known after the test period and as an average of a sampling period during stable operation. The consequences of the adjustment of operation parameters cannot be directly evaluated. The interpretation of the tests results is delayed and a prolonged test period is required.
- As the isokinetic sampling requires a sequence of several manual operations, the accuracy and repeatability may be limited. Several measurements are usually necessary to confirm an average value.
The following operations may affect the accuracy for aerosol measurements:
- Control of isokinetic sampling and sample flow measurement at low and variable velocity in the absorber
- Condensation/vaporization in sampling line/changing atmospheric conditions
- Control of the velocity in the impinger. Aerosols not captured in the impingers
- Transport of samples to laboratory and chemical reactions in transport period
- Analysis of the samples at the laboratory and calculation of the aerosols based on flow measurements and concentrations.
Isokinetic samplings are compulsory for the validation of the online instrumentation at the beginning of each campaign with a new amine solvent, new equipment or unproved process parameters. This validation is critical for the reliability and guarantee of the campaign results and compliance to the emission permit.
3. Purpose of the tests
3.1 Test 1: amine plant emissions
The purpose of the test is to evaluate the maximum aerosol number concentration acceptable for operation with a solvent based on MEA.
The emissions from the absorber with aqueous MEA solvent have been investigated by utilizing the high flexibility of the amine plant at TCM by variation of the following main parameters:
- Sulfuric acid aerosol in the inlet flue gas: number concentration and particle size distribution by mixing small fractions of the RFCC flue gas into the gas turbine flue gas
- CO2 inlet flue gas concentration by CO2 product stream recycling
- Lean MEA inlet temperature to the absorber and hence absorber temperature profile
- Water wash cooling temperature
3.2 Test 2: Pilot Brownian filter efficiency
A pilot Brownian filter was previously tested at TCM in collaboration with Aker Solutions [17].
Several types of pilot Brownian filters of 1000Sm3/h of flue gas are now tested at TCM in order to assess the installation of a future Brownian filter unit capable of treating 35000 Sm3/h of RFCC flue gas. The purpose of the future unit is to reduce and control the concentration of aerosols in the RFCC flue gas inlet to the amine absorber. This installation will allow TCM to remove almost all aerosols or adjust the aerosol concentration and particle size distribution at various CO2 concentrations for future tests in order to investigate aspects such as:
- Sensitivity of a specific solvent to the aerosols
- Aerosol emissions due to degradation products
- Understanding of aerosol mechanism for various advanced solvents
- Recommendations for future flue gas treatment, amine absorber equipment and operation parameters.
- Assessment of the required flue gas treatment required for a specific coal power plant with a known range of aerosols, oxygen and CO2 concentration.
The pilot is installed in order to check the efficiency of a Brownian filter based on the number particles and particle size distribution. The Brownian filter efficiency is usually reported by the mass of aerosols captured in the filter. This method is relevant for reporting sulfuric acid emissions, but is not sufficient to evaluate low concentration of aerosols downstream the filter and the consequences of aerosol growth in the absorber.
A Brownian filter is suitable for test purposes of the amine absorber at TCM for the RFCC flue gas:
- A high discharge pressure is available with the existing fan
- The concentration of particles/fly ashes is limited at TCM
- High concentrations of aerosols can be controlled by bypass of the Brownian filter
4. Results of the tests and parameters
4.1 Results of the amine emission tests
In this section, main results from MEA aerosol testing are summarized. The operating conditions for each sequence of test are described in the following paragraphs. The conditions are chosen close to the optimum operation conditions for an amine absorber with MEA as described in TCM DA publications [15, 16].
TCM DA received a temporary emission permit from the Norwegian Environmental Agency in order to conduct the given tests. The temporary permit allowed an increase of the MEA emissions from the current 6 ppmv to 500 ppmv for maximum 4 days of testing with RFCC flue gas. The limit of amine emission was not exceeded during the tests.
4.1.1 Properties of the CHP flue gas mixed with a fraction of RFCC flue gas
The particle size distribution of the aerosols is quite similar when different fractions of RFCC gas are mixed into the CHP as seen on Figure 2. The total number concentration is roughly proportional to the mixing ratio, but at lower RFCC flue gas flow, the number concentration of larger particles decreases due to the piping arrangement at the connection between the main RFCC duct and the bypass line to the CHP flue gas. At high velocity in the main RFCC duct and lower velocity in the bypass pipe, large particles remain in the main RFCC duct.
Typical Flue gas composition is given in Table 1.
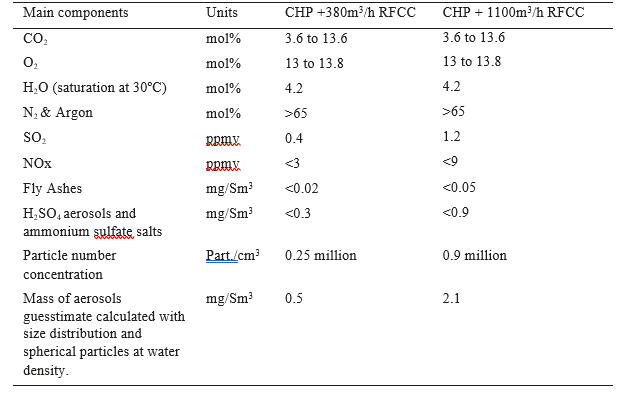
Table 1. Typical Composition of the CHP flue gas with CO2 recycle mixed with a fraction of RFCC flue gas.
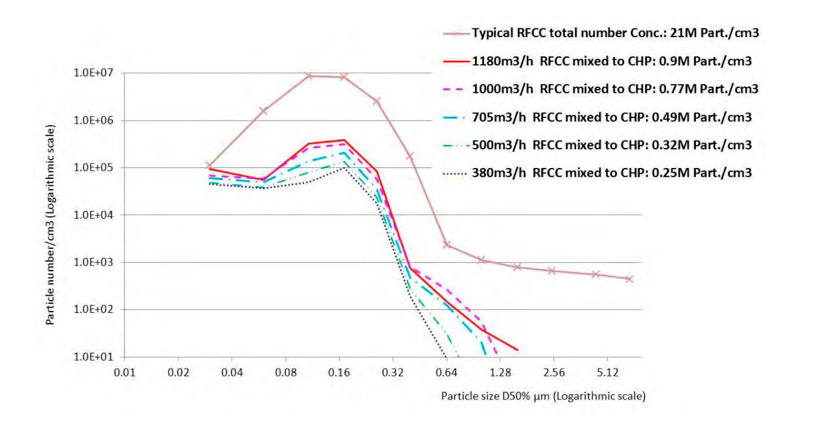
Figure 2. ELPI+ measurements. Size distribution of the aerosols in the mixed RFCC flue gas flow ratios into 30 000 Sm3/ of CHP
4.1.2 Correlation between particle concentration and MEA emissions
The correlation between particle concentration and MEA emissions was studied at three different CO2 concentrations (3.7 %, 8% and 12.7% CO2). At each concentration the effect of different particle concentrations was investigated by varying the mixing fraction of RFCC gas into the CHP gas. The lean amine temperature into the absorber was adjusted to keep the temperature difference between the maximum absorber bulge and the lean amine entering the absorber almost the same independent of CO2 concentration. All test runs were performed at an absorber packing height of 18m. The upper 6 m of packing was not loaded with solvent. The parameter settings for each test are included in Table 2. Results of the correlation between particle concentration and MEA emissions are plotted in Figure 3.
At 3.7% CO2 (no CO2-recycling) and the process conditions given in Table 2, there is a linear correlation between particle concentration in the absorber inlet gas and MEA emissions as seen in Figure 3a (upper left). At particle concentrations <100 000 particles/cm3, no MEA emissions was measured. The emission of MEA is below 3 ppmv at 150 000 particles/cm3. When the concentration increases above 250 000 particles/cm3, the regular discharge permit of 6 ppmv is exceeded.
The next test was conducted with CO2-recycling to around 8 vol % CO2 in the gas upstream the absorber. Results are plotted in Figure 3b (upper right). The MEA emissions correlates to the particle concentration and it is still linear up to around 500 000 particles/cm3, then a nonlinear correlation is observed with higher emissions. However, at these process conditions the emission of MEA was still below 3 ppmv at around 500 000 particles/cm3, indicating a higher tolerance to aerosols in the gas at 8% CO2 compared to 3.7% CO2. At close to 1 mill particles/cm3 emission above 6 ppmv was observed.
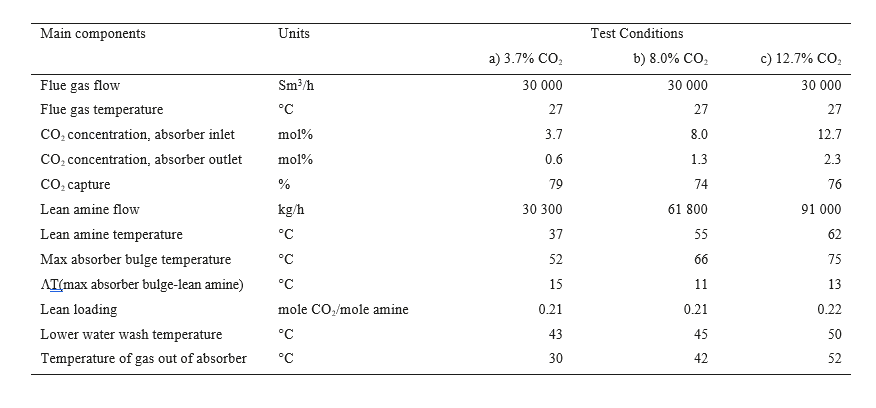
Table 2. Parameter settings for testing effect of particle concentration in flue gas on MEA emissions.
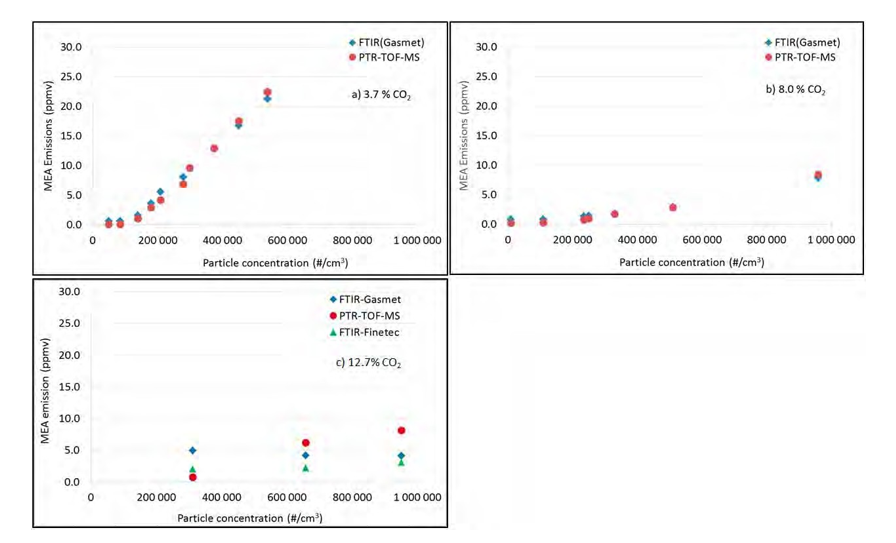
Figure 3. Correlation between particle concentration and MEA emissions at three different CO2 concentrations. a) Upper left: Normal CHP absorber conditions with 3.7% CO2. b) Upper right: CHP with CO2-recycle to 8.0% CO2. c) Lower left: CHP with maximum CO2 recycle to 12.7% CO2
The CO2-recycling was then increased to 12.7% CO2, resulting in higher temperatures in the absorber due to more reactions taking place. Testing of the effect of particle concentrations in the flue gas on MEA emissions was conducted. Results are plotted in the Figure 3c lower left. As can be seen from the figure, there are more scattering in the data during this test. This is probably caused by analytical challenges due to the high temperature and water content of the gas leaving the absorber (refer to section 2.2). The effect of particle concentration on emission is comparable to what was observed at 8%, but again much less than at lower CO2 concentration. At these conditions, the emission of MEA is below the 6 ppm limit at 600 000 particles/cm3, and above 6 ppm at 1 mill particles/cm3 in the absorber inlet gas, if the PTR-TOF-MS instrument is most trusted.
4.1.3 Effect of cooling the gas at the top of the absorber on MEA emissions
For each CO2 concentration, the effect of increased cooling of the gas at the top of the absorber on the MEA emissions was investigated at a constant particle concentration in the gas. Cooling was done either by reducing the temperature of the lean solvent entering the absorber or by reducing the temperature in the lower water wash section. The effect of the lean amine temperature is shown in Figure 4. The effect of moving the cooling up to the lower water wash section was tested for the 8% CO2 case only. Results are shown in Figure 5.
The particle concentration in the gas was kept constant at 540 000 particles/cm3 for testing at 3.7% CO2 and at 950 000 particles/sm3 for testing at 8.0 and 12.7% CO2. In each case, the lean amine temperature was changed step-vise to investigate impact on MEA emissions. The lower water wash temperature was kept constant at 30°C for the 3.7% CO2 case and at 45°C for the cases with higher CO2 concentrations. The other parameters were kept at the same levels as given in Table 2 above. However, the difference between the maximum absorber bulge temperature and the lean amine temperature increased as the lean amine temperature was step-vise reduced.
As can be seen in Figure 4, the MEA emissions increases when the temperature of the lean amine is reduced for tests with 3.7% CO2 and 8% CO2. For the 12.7% CO2 case, there are more scattering in the data but no significant effect of reducing the lean amine temperature on MEA emissions was seen in the temperature window explored. However, at the end of the test when the lean amine temperature was further decreased to 30°C, a significant plume was observed and the on-line analyzers indicated MEA emissions above 20-30 ppmv.
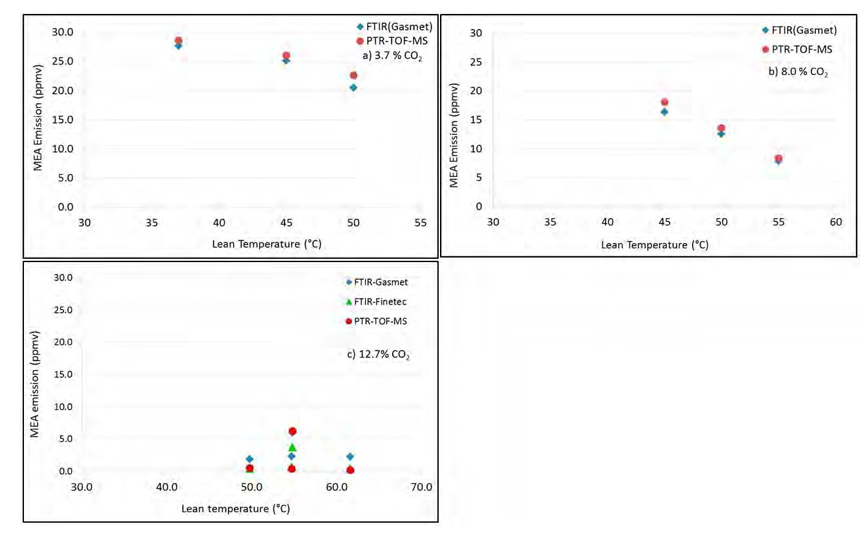
Figure 4 Effect of lean amine temperature on MEA emissions. a) Upper left: At 3.7% CO2 and 540 000 particles/cm3 . b) Upper right: At 8.0% CO2 and 950 000 particles/cm3. c) Lower left: At 12.7% CO2 and 950 000 particles/cm3
The effect of decreasing the temperature in the lower water wash on MEA emissions was then examined for the 8% CO2 case at the same concentration of 950 000 particles/cm3 in the gas. The lean amine temperature was set to 55°C, which is 11°C below the maximum absorber bulge temperature, resulting in a temperature of the gas into the lower water wash section of 60°C. The water wash section was operated at 45° and 35°C, respectively and MEA emissions were measured. Results are shown in Figure 5. There is a tendency of increased MEA emissions when the temperature of the water was reduced, however the effect is not as pronounced as when reducing the lean amine temperature (Figure 4b).
The effects of particle concentration, CO2 concentration and temperatures in the absorber and water wash system on MEA emissions will be further investigated by TCM.
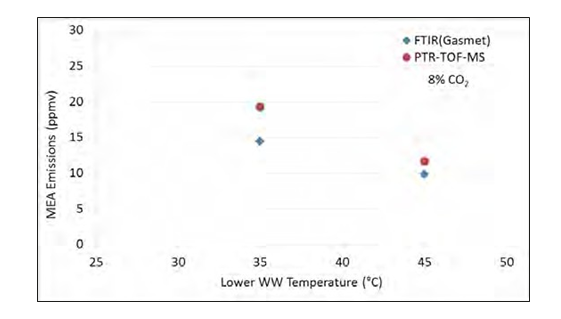
Figure 5 Effect of the temperature in the lower water wash on MEA emissions for case with 8% CO2 and 950 000 particles/cm3.
4.2 Results of the filter tests
4.2.1 Brownian diffusion filter description
In a fiber filter, particles may be captured by three collection mechanisms:
- Brownian diffusion: the smaller particles get random motion by collision with surrounding gas molecules. Higher random motion and longer residence time facilitates the capture of the particle to a fiber. Velocities between 5 and 10cm/s are necessary for high efficiency. Maximum velocity is 25cm/s.
- Interception: particles with higher momentum do not follow the gas stream around a fiber and are captured to the fiber by interception. Efficiency increases with the gas and particle velocity. Once a particle touches the surface of the collecting target, it adheres by weak Van Der Waals forces. Velocities between 0.2 and 1m/s are necessary for high efficiency.
- Direct impaction: The particle is intercepted from the gas stream if there is not enough space between two fibers or if the particle touches a fiber as it passes closed enough. Efficiency increases with the particle diameter and is constant for a velocity above 1m/s.
In a Brownian diffusion filter the main particle capture is achieved by the first collection mechanism.
A typical candle filter is illustrated in Figure 6. Small droplets will coalesce together in larger droplets until the collected liquid trends to flow in the same direction as the gas and fibers and drains out of the fiber bed by gravity to the bottom of the candle filter. A typical industrial candle is 600mm diameter and 3.6m height with a candle thickness between 50mm and 100mm. For practical application, the number of candle is increased until the required area and gas velocity are achieved.
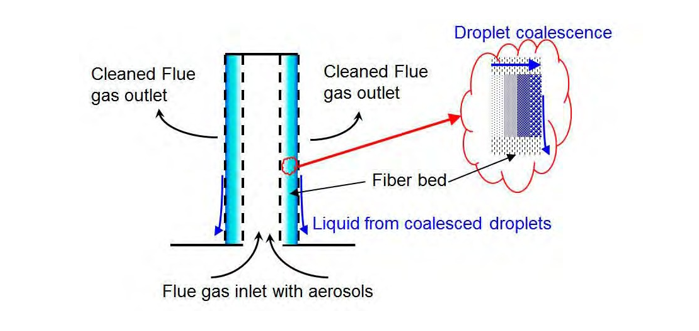
Figure 6. Typical Candle Filter
4.2.2 Flue gas Composition and aerosols upstream and downstream the Brownian filter
The efficiency of any flue gas treatment upstream an amine absorber cannot be evaluated by a single parameter, as for example, the “equivalent SO3” concentration in the flue gas. The total number concentration, the size distribution of the aerosols and the composition of aerosols are the main critical parameters. For similar gas composition from various coal power plants, the aerosol properties may be highly variable from plant to plant and during the life time of each power plant.
Aerosols in the RFCC flue gas are mainly aqueous particles with some sulfuric acid, salts, catalyst particles and fly ashes. Scanning electron microscope analyses (SEM) performed at TCM confirms that fly ash concentration is low and has a similar composition as a typical flue gas from a coal power plant. At TCM, fly ashes are mainly found in aerosols in the range of 1µm diameter. The typical composition of the RFCC flue gas is defined in Table 3.
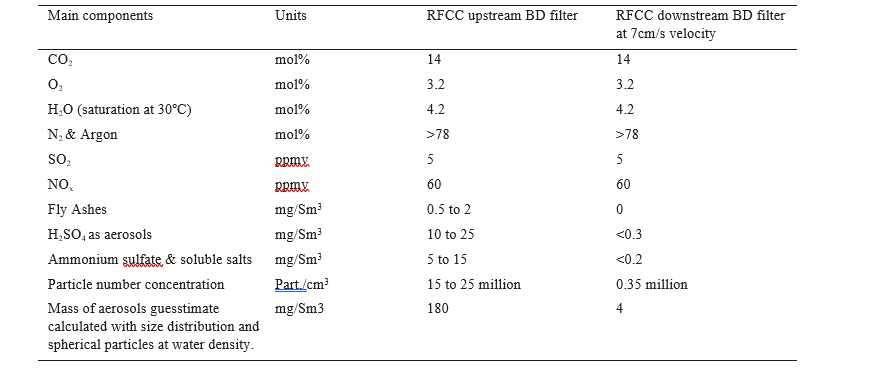
Table 3. Typical Composition of the RFCC flue gas upstream and downstream the BD filter.
As shown in Figure 7 the particle size distribution of the RFCC flue gas at TCM is close to coal power plant flue gases [19, 20].
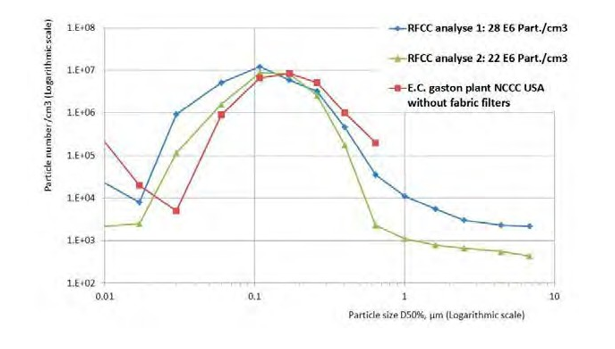
Figure 7. Comparison of RFCC flue gas and flue gas from a coal power plant
4.2.3 Overall efficiency
The overall efficiency of the Brownian diffusion filters tested at TCM is higher than 98% based on the particle number concentration. This efficiency is checked at TCM for several types of Brownian filters. The efficiency of a Brownian diffusion filter is variable with the particle size. Figure 8 illustrates that a lower velocity increases efficiency for smaller particle size. Higher velocity increases efficiency for larger particle size. This is in accordance with the three collection mechanisms of the filter candles:
- Brownian diffusion: requires high residence time/low velocities; high efficiencies for smaller particles (<0.1µm)
- Interception: requires higher velocities
- Impaction: high efficiency for larger particles (>0.5µm)
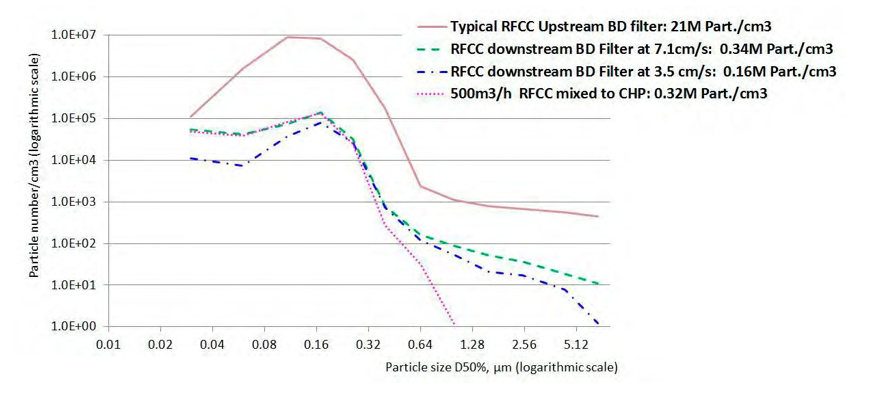
Figure 8. Size distribution upstream and downstream the BD filter and comparison with CHP mixed with RFCC flue gas
As illustrated in Figure 8 , the particle size distribution of the following flue gases is similar:
- CHP flue gas mixed with a fraction of RFCC flue gas
- RFCC flue gas after a Brownian diffusion filter
Above 0.5µm, the number of particles is negligible (<100particles/cm3)
As illustrated in Figure 9, the efficiency of the various filters is variable. Some Brownian filters may reduce the number particles to less than the detection limit of the ELPI+ (approximately 10 000 particles/cm3). The main differences between the types of Brownian diffusion filter are the filter density, fiber diameter and fibers weave. Generally, more fibers and higher pressure drop will result in higher efficiency. Specific fibers weave and layers reduce pressure drop.
At the first start up the filter bed is dry and requires to be saturated with liquid from the aerosols. The pressure drop increases slightly during this period. After saturation, the pressure drop of Brownian diffusion filters is essentially proportional to the flue gas flow rate and velocity to the candle filters, due to the laminar flow inside the filter bed.
During 3 months of operation, the pressure drop of the test pilots at TCM was constant and no increase due to fly ashes or accumulation of solid particles in the filter bed was noticed.
The typical pressure drop is around 25mbar at an average velocity of 7cm/s based on the average of the inlet and outlet surface of the candle filters. The optimized velocity is specific to each type of candle filter/vendor and required efficiency.
As an example, for the candle filter from the Figure 9:
- Up from 3.5 to 7cm/s the efficiency decreases slightly, but the filter area required at 3,5cm/s is the double than at 7cm/s. The cost of the filter is almost proportional to the area required.
- From 7 to 10cm/s, the captured particles and efficiency are constant but pressure drop increases with the velocity.
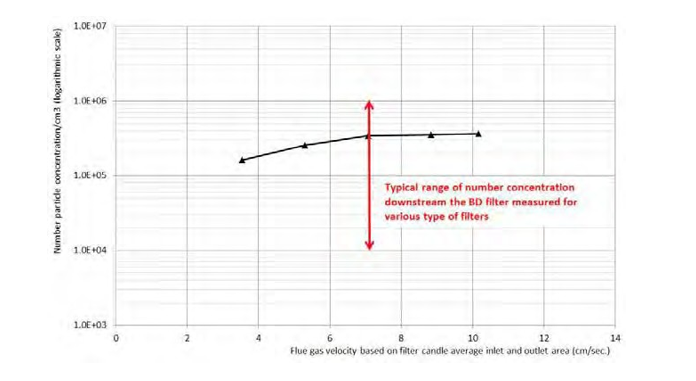
Figure 9. Typical particle total Number Concentration downstream the pilot BD Filter
The Brownian filter tests at TCM confirm that a suitable efficiency is achieved for the RFCC flue gas and testing with RFCC flue gas may be performed at TCM within the present emission permit.
The installation of Brownian filters may be applicable to specific refinery flue gases if the fly ash concentration is limited.
5. Aerosol emissions: discussions and interpretation of the results
5.1 Kelvin effect and literature
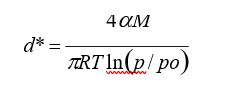
When an interface gas/liquid is flat, the condensation of gas to the liquid is generally given by the equilibrium concentration of vapor pressure at given temperature and pressure. The kelvin effect expresses that the vapor pressure over a curved interface is always higher for the same component than over a flat interface. The kelvin equation gives the critical particle size or minimum particle diameter of a liquid [2, 4, 18]:
d* is a function of the particles, gas composition and properties.
Where:
d* = Particle diameter [m]
σ = Surface tension of liquid drop [N/m]
M = Average molecular weight of the condensable liquid [kg/Kmol.]
ρ = Liquid density [kg/m3] T = Temperature [ºK]
R = Universal gas constant [J/Kmol./ºK]
p = Sum of the partial pressures of all condensable components in the mixture [Pa]
p0 = Corresponding sum of partial pressure when saturated (equilibrium conditions) [Pa] The saturation of the gas mixture is S = p/p0. The gas phase is supersaturated if S > 1
The kelvin equation indicates that:
- Very small droplets (for example < 0.1µm) are stable, and a large supersaturation is necessary for formation of new droplets or growth of existing droplets.
- Between 0.1µm and 1µm, aerosol growth may occur with supersaturation of water or amine vapor.
- Above 1µm, supersaturation is not necessary. These relatively large droplets may be considered as a flat surface. Aerosol growth may occur at once saturation is achieved.
5.2 Assumed aerosol mechanism
The challenge for amine absorbers is the evaluation of the chemical processes in the critical section where the flue gas that has been heated by chemical reactions, is cooled by the incoming lean amine (section 2 in Figure 11). The chemistry of the amine in the aerosols is similar to the lean solvent film of the packing, but the consequences of the variable aerosol diameter are new parameters. The experience acquired at TCM with MEA and various advanced solvents suggests that the chemical process in the aerosols is a major parameter. Similar aerosol mechanisms are described in multiple recent publications [1, 2, 3].
Figure 10 illustrates the assumed mechanisms for aerosols chemistry:
- Phase 1: Aerosol growth by water and eventual homogeneous nucleation in case of high supersaturation. The aerosol growth by water from gas phase is dependent of the supersaturation. The diameter of the aerosol increases in a short time, likely lower than 0.5second [18].
- Phase 2: Aerosol growth by amine. Due to the kelvin effect, the aerosol growth by amine from gas phase is
dependent of the supersaturation and begins at once for large particles or as soon as a critical diameter is achieved (probably from 0.2µm to 1µm for MEA). The aerosol growth by amine may be continuous until equilibrium and saturation of amine in the aerosols.
- Phase 3: Large aerosols are considered as flat surfaces. Free amine with high activity like MEA captures CO2 in the aerosols. Reaction kinetics is critical due to the short residence time.
- Phase 4: Due to the formation of salts, additional free amine is absorbed in the larger aerosols
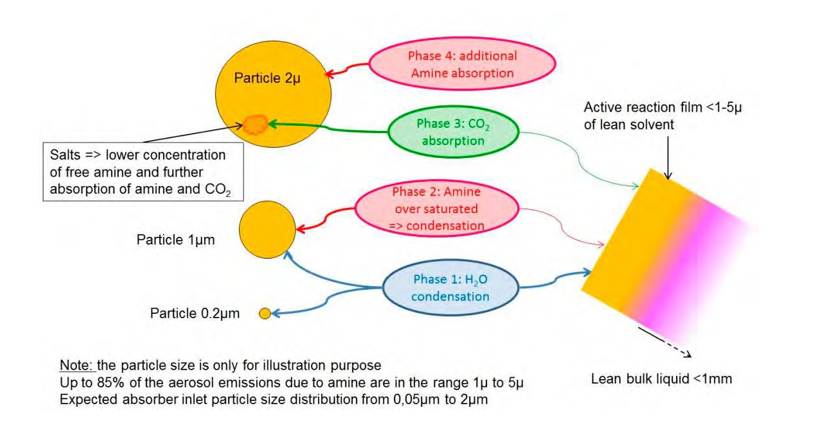
Figure 10. Description of assumed aerosol mechanisms
The major parameters for aerosol mechanisms are:
- The initial size of the aerosol and the growth rate with water is a major parameter. For example, a flue gas with large number of aerosols between 0.3µm and 1µm may cause high emissions.
- The difference of temperature between the lean and the flue gas is the main cause of the supersaturation of the components in the gas phase. The supersaturation of a component is not necessary related to the concentration of the component in gas phase. Without supersaturation, even with high concentration of amines (>1000ppmv) aerosols may not cause emissions. With supersaturation, even at low concentrations (<5ppmv), special amines may produce emissions. For advanced amines, decomposition products can typically be the cause of substantial aerosol emissions.
- The effect of lean solvent loading is probably significant but is not yet evaluated at TCM.
- Additional components in the aerosols may modify the chemistry and reaction kinetics: H2SO4, salts, fly ashes/catalyzer particles [10]
5.3 Amine absorber profile and main mechanism with MEA
As many parameters with opposite effects will modify the supersaturation in the amine absorber, the behavior of aerosols is complex. In order to illustrate the mechanisms in an amine absorber, the typical temperature profile of the amine absorber at TCM is described in Figure 11 and the main operation parameters are listed in Table 4.
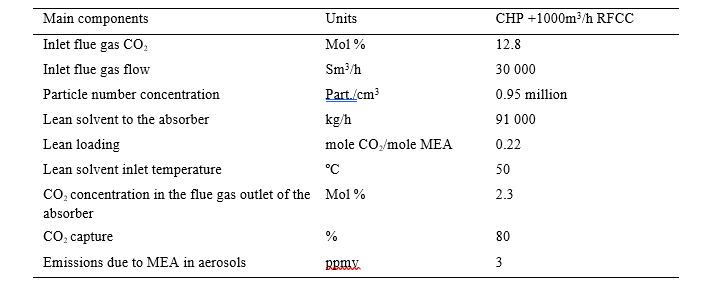
Table 4. Operation condition of the absorber
The absorber upper packing for CO2 absorption is not operated and the lean solvent feed is located above the middle packing of 6m height. The lower packing height is 12m. Temperature measurements are located every meter of the packing at four horizontal locations. This arrangement allows a suitable validation of the simulation models.
The aerosol mechanisms are specific in each of the following sections of the absorber:
- Section 1: In the packing under the bulge, 5000kg/h of CO2 is absorbed and temperature increases in the lean solvent. The lean solvent heats the flue gas. Flue gas temperature is lower than the liquid solvent (7ºC to 1ºC). Up to 7000kg/h of water and 30kg/h of MEA are vaporized from the liquid. The larger aerosol droplets may also vaporize some water. Some limited mass of MEA may be absorbed in large aerosols (>1 µm) if saturation is achieved locally (cold walls, flue gas distribution, defective solvent distribution in the packing). It is expected that most of the aerosol composition remains unchanged.
- Section 2: starts from just below the maximum temperature in the absorber (bulge temperature) and finished at the elevation corresponding to a stable flue gas temperature. Below the lean solvent distributor, the relative cold solvent cools down the flue gas. Up to 2500kg/h of water and some solvent previously vaporized are condensed again in the liquid solvent. Due to sudden cooling, the concentration of condensable components in the gas phase exceeds the corresponding concentration in vapor–liquid equilibrium (VLE). The gas phase is supersaturated with high MEA concentration in gas phase. This section is critical, in a short residence time; the water particles diameter will increase with water and become saturated with amines. The chemistry in the droplets will be critical for the growth of the aerosols with amines. Above the lean feed, the temperature decreases until equilibrium conditions are achieved. The effect of the equilibrium condition is not yet evaluated in the tests, but may be critical for emissions.
- Section 3: Most of the remaining amines in vapor phase are absorbed in the lower water wash. Some water previously vaporized is condensed. Sudden cooling shall be avoided otherwise, the same mechanism as Section 2 occurs.
- Section 4: The last traces of amines in vapor phase are absorbed in the upper water wash. The remaining water previously vaporized is condensed. Sudden cooling is applied in order to keep the water balance of the plant. The aerosol diameter will increase with water but without additional amine capture.
- Stack: Most of the amine captured by aerosols in section 2 and eventually in section 3 will be emitted at the stack of the absorber. The typical efficiency of demisters and packing is poor or insignificant for such aerosols.
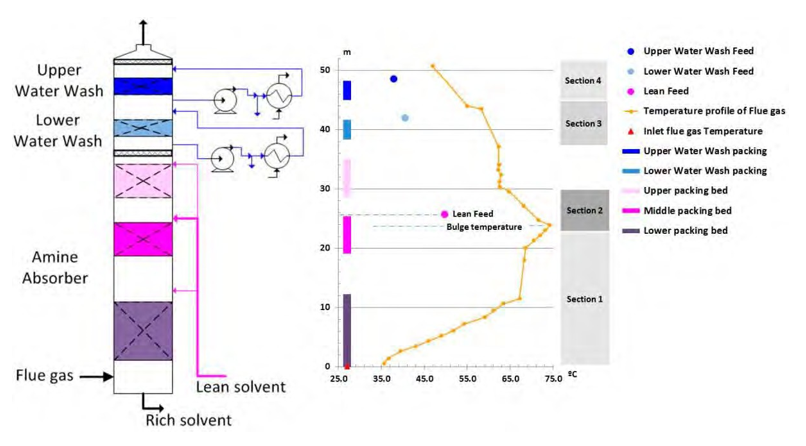
Figure 11. Temperature profile of the absorber at 12.8% CO2 inlet
The results from testing show that the emissions of MEA increases as the particle concentration in the flue gas increases. This indicates that the extent of aerosol based emissions depends strongly on the number concentration of particles in the flue gas.
With the same particle concentration, the aerosol mechanisms are likely different for the cases at 3.7% CO2 and 12.7% CO2, see Table 2, test conditions a) and c):
- At 3.7% CO2 the typical MEA concentration in the gas phase in the bulge area is 20 to 30 ppmv. The emissions due to aerosols are also 20 to 30 ppmv. It is likely that most of the MEA in gas phase is condensed in aerosols in section 2. Both homogeneous nucleation of MEA and a substantial condensation on aerosols may be considered.
- At 12.7% CO2 the typical MEA concentration in the gas phase in the bulge area is 300 to 500 ppmv. The
emissions due to aerosols are limited to less than 5 ppmv. The particle growth by water and MEA condensation are likely limited by the gradual temperature decrease above the bulge temperature.
Minor variations in dominant process parameters may increase or decrease aerosol emissions as several competitive mechanisms are involved. As illustrated in Figure 3, MEA emissions are lower at 8% CO2 and 12% in the flue gas than compared to the test at 3.7% CO2 concentration. This trend is dissimilar to published results obtained at slightly different process parameters [1, 2, 5, 12]. The higher emissions at low CO2 concentration were thus not expected. The following hypotheses are possible, but are not yet confirmed since advanced simulations are not available:
- The chemistry in the lean solvent solution may contribute to less amine condensed on the aerosols: at higher CO2 concentration, kinetics and driving forces in the top of the absorber increases. Amine condensing from the vapor phase to the liquid lean reacts faster with CO2, supersaturation decreases.
- The chemistry in the aerosol may also generate a decrease of emissions: at higher CO2 concentrations, the solubility of CO2 decreases with the higher flue gas temperature and less CO2 is absorbed in the aerosols. The droplets are saturated in free amine and no more amines are absorbed.
6. Conclusions and recommendations
6.1 Conclusion of the tests at TCM
As described in this work, an appropriate description and composition of the flue gas is necessary to assess the risks of emissions associated to aerosols. The description should include gas components, aerosol size distribution and number concentration, and composition of the trace components in the aerosols, measured at the expected pressure and temperature of the flue gas at the inlet of the absorber.
Testing was conducted in the TCM amine plant to evaluate the maximum aerosol number concentration in the flue gas, acceptable for operation with MEA within TCM DA’s emission permit. When operating the plant with flue gas from the natural gas fired power plant, no aerosol emission occurs. As a fraction of the flue gas from the residual fluidized catalytic cracker (RFCC) was added, the MEA emissions increased significantly. A strong correlation between particle concentration in the flue gas and MEA emission was found. The effect was more pronounced when the CO2 concentration in the gas was reduced. The control of the lean amine temperature and the water wash temperature are effective measures to reduce the emissions. With the particle size distribution tested at TCM, a concentration of 500 000 particles/cm3 is acceptable for operation of the RFCC flue gas. A Brownian Diffusion (BD) filter will be installed to reduce the particle concentration below this level and by-pass possibilities will enable for future testing at a large range of particle concentrations. Pilot testing at TCM has demonstrated high efficiency for BD filters with the RFCC flue gas.
6.2 Recommendation for future CO2 capture plant based on MEA or advanced solvents
6.2.1 Operation parameters of CO2 capture plants
As demonstrated in the test at TCM, in case of aerosols in the flue gas, the lean temperature and the water wash temperature requires to be optimized. The eventual energy penalty and mitigation design will be assessed in future works at TCM.
The effect of other operation parameters as CO2 concentration, CO2 capture rate or lean loading cannot be predicted by simple assessments. The validation of a simulation tool for aerosols specific to each solvent is essential for the extrapolation of the tests results from a pilot to a full-scale plant.
Tests results at TCM may be a basis for future works in order to validate simulations tools and confirm the major mechanisms of aerosol growth.
6.2.2 Process equipment for aerosol mitigation upstream the amine absorber
As illustrated for MEA in this work, the sensitivity of a specific solvent at various aerosol concentrations may be assessed. Based on sensitivity studies for a specific solvent, the works at TCM may contribute to specify the requirements downstream the flue gas treatments in order to minimize the risk of emissions. Typical flue gas treatments are as for example:
- Wet Electrostatic Precipitator (WESP) [8, 11]
- Flue gas desulfurization (FGD) [11]
- Bag house filter [19, 20]
6.2.3 Process equipment for aerosol mitigation in the amine absorber
The test results from the Brownian diffusion filters confirm a large variability of pressure drop an efficiency of the various fibers and the opportunity to improve the technology is confirmed. Future works are recommended in order to evaluate the pressure drop and efficiency of impaction candles and high efficiency demisters with coalescer materials and flushing systems. As these equipment’s are specifically designed to remove particles between 1 and 5µm, they may reduce a large fraction of the aerosol emissions at a relatively low price. Such equipment’s are currently not demonstrated in amine absorbers.
Future works at TCM will include specific high efficiency demisters.
6.2.4 Process equipment for aerosol measurements in the amine absorber
The works at TCM confirm the need for reliable measurements of emission due to aerosols. Based on the experience of the tests, the combination of the following measurements is recommended:
- Isokinetic sampling for the validation of the online instrumentation for aerosols.
- Sampling line to online instrumentation with temperature control suitable for an acceptable vaporization of the aerosols.
- FTIR for online measurements of amine from vaporized aerosols
An isokinetic sampling procedure based on a train of impinger jet was recently developed at TCM based on the experiences of the MEA campaign and further tests with advanced amines. This specific system is able to quantify both the vapor and aerosol emissions with reliable accuracy. Future test shall confirm the advantages of the specific procedure.
Acknowledgements
The authors gratefully acknowledge the staff of TCM DA, Gassnova, Statoil, Shell and Sasol for their contribution and work at the TCM DA facility. The authors also gratefully acknowledge Gassnova, Statoil, Shell, and Sasol as the owners of TCM DA for their financial support and contributions.
References
- Purvil Khakharia, Leonie Brachert, Jan Mertens, Christopher Anderlohr ,Arjen Huizinga, Eva Sanchez Fernandez, Bernd Schallert, Karlheinz Schaber,Thijs J.H. Vlugt, Earl Goetheer. Understanding aerosol based emissions in a Post Combustion CO2 Capture process: Parameter testing and mechanisms. International Journal of Greenhouse Gas Control 34 (2015) 63–74.
- Purvil Khakhariaa, Jan Mertens, Thijs J.H. Vlugt, Earl Goetheer. Predicting Aerosol Based Emissions in a Post Combustion CO2 Capture Process Using an Aspen Plus Model. Energy Procedia 63 (2014) 911 – 925.
- Hammad Majeed, Hanna Knuutila, Magne Hillestada Hallvard F. Svendsen. Characterization and Modelling of Aerosol Droplet in Absorption Columns. Ieaghg, 3rd Post Combustion Capture Conference (PCCC3)
- Steven M. Fulk, Gary T. Rochelle. Modeling aerosols in amine-based CO2 capture. GHGT-11. Energy Procedia 37 ( 2013 ) 1706 – 1719
- Purvil Khakharia, Leonie Brachert, Jan Mertens, Arjen Huizinga, Bernd Schallert ,Karlheinz Schaber, Thijs J.H. Vlugt, Earl Goetheer. Investigation of aerosol based emission of MEA due to sulphuric acid aerosol and soot in a Post Combustion CO2Capture process. International Journal of Greenhouse Gas Control 19 (2013) 138–144
- Jan Mertens; Leonie Brachert, Dominique Desagher, Bernd Schallert, Purvil Khakharia, Earl Goetheer. Predicting amine mist formation based on aerosol number concentration and size measurements in flue gas. Energy Procedia 63 ( 2014 ) 893 – 901.
- L. Brachert, J.Mertens, P.Khakharia, K.Schaber. The challenge of measuring sulphuric acid aerosols: Number concentration and size evaluation using a condensation particle counter(CPC) and an electrical low pressure impactor (ELPI+). Journal of Aerosol Science 67 (2014) 21–27.
- Jan Mertens, C. Anderlohr, P. Rogiers, L. Brachert, P. Khakharia, E. Goetheer, K. Schaber. A wet electrostatic precipitator (WESP) as countermeasure to mist formation in amine based carbon capture. International Journal of Greenhouse Gas Control 31 (2014) 175–181.
- Takashi Kamijo, Yoshinori Kajiya, Takahiko Endo, Hiromitsu Nagayasu, Hiroshi Tanaka, Takuya Hirata, Takahito Yonekawa, Tatsuya Tsujiuchi. SO3 impact on amine emission and emission reduction technology. Energy Procedia 37 ( 2013 ) 1793 – 1796.
- S. Sinanis, A. Wix, L. Ana, K. Schaber. Characterization of sulphuric acid and ammonium sulphate aerosols in wet flue gas cleaning processes. Chemical Engineering and Processing 47 (2008) 22–30.
- Peter Moser, Sandra Schmidt, Knut Stahl, Gerald Vorberg, Gustavo A. Lozano, Torsten Stoffregen, Frank Rösler. Demonstrating Emission Reduction – Results from the Post-combustion Capture Pilot Plant at Niederaussem. Energy Procedia 63 ( 2014 ) 902 – 910.
- Michael Imle, ErikvonHarbou, LeonieBrachert, KarlheinzSchaber, HansHasse. Predicting supersaturation by rate-based simulations of reactive absorption. Chemical Engineering Science 118(2014)41–49.
- De Cazenove T, Bouma RHB, Goetheer ELV, Van Os PJ, Hamborg ES. Aerosol Measurement Technique: Demonstration at CO2 Technology Centre Mongstad. Energy Procedia 86 ( 2016 ) 160 – 170
- Morken AK, Nenseter B, Pedersen S, Chhaganlal M, Feste JK, Bøe Tyborgnes R, Ullestad Ø, Ulvatn H, Zhu L, Mikoviny T, Wisthaler A, Cents T, Bade OM, Knudsen J, De Koeijer G, Falk-Pedersen O, Hamborg ES. Emission results of amine plant operations from MEA testing at the CO2 Technology Centre Mongstad. GHGT12. Energy Procedia 00 (2013) 000–000.
- Brigman N, Shah MI, Falk-Pedersen O, Cents T, Smith V, De Cazenove T, Morken AK, Hvidsten OA, Chhaganlal M, Feste JK, Lombardo G, Bade OM, Knudsen J, Subramoney SC, Fostås FB, De Koeijer G, Hamborg ES. Results of amine plant operations from 30 wt% and 40 wt% aqueous MEA testing at the CO2 Technology Centre Mongstad. GHGT12. Energy Procedia 00 (2014) 000–000
- Gjernes E, Pedersen S, Cents T, Watson G, Fostås BF, Shah MI, Lombardo G, Desvignes C, Flø NE, Morken AK, de Cazenove T, Faramarzi L, Hamborg ES. Results from 30 wt% MEA performance testing at the CO2 Technology Centre Mongstad. Energy Procedia (GHGT-13), Forthcoming 2017.
- Bade OM, Knudsen JN, Gorset O, Askestad I. Controlling amine mist formation in CO2 capture from Residual Catalytic Cracker (RCC) flue gas. GHGT12. Energy Procedia 63 ( 2014 ) 884 – 892
- Marco Tammaro, Francesco Di Natale, Antonio Salluzzo, Amedeo Lancia. Heterogeneous condensation of submicron particles in a growth tube. Chemical Engineering Science, Volume 74, 28 May 2012, Pages 124–134
- Justin Anthony, John Carroll. Advanced Technology Testing at the National Carbon Capture Center. Publication of National Carbon Capture Center (NCCC).
- Honghong Yi, Jiming Hao, Lei Duan, Xiaolong Tang, Ping Ning, Xinghua Li. Fine particle and trace element emissions from an anthracite coal-fired power plant equipped with a bag-house in China. ScienceDirect. Fuel 87 (2008) 2050–2057
- Jan mertens, Dominique Desagher, Marie-Laure Thielens, Han Huynh, Helene Lepaumier, Purvil Khakaria, Earl Goetheer. On- and off-line ethanolamine and ammonia emission monitoring in PCC. PCCC2 presentation Bergen September 2013
- Morken AK, Pedersen S, Kleppe ER, Wisthaler A, Vernstad K, Ullestad Ø, Flø NE, Faramarzi L, Hamborg ES. Degradation and Emission Results of Amine Plant Operations from MEA Testing at the CO2 Technology Centre Mongstad. Energy Procedia (GHGT-13), Forthcoming 2017