
3. Aerosol Measurement Technique: Demonstration at CO2 Technology Centre Mongstad (2016)
Thomas de Cazenovea, Richard H.B. Boumab, Earl L.V. Goetheerb, Peter J. van Osb, Espen Steinseth Hamborga,c,*
aCO2 Technology Centre Mongstad (TCM DA), 5954 Mongstad, Norway, bTNO Science and Industry, Leeghwaterstraat 46, Delft, Netherlands cStatoil ASA, P.O. Box 8500, 4035 Stavanger, Norway *Corresponding author

(http://creativecommons.org/licenses/by-nc-nd/4.0/).
Peer-review under responsibility of the Programme Chair of the 8th Trondheim Conference on CO2 Capture, Transport and Storage
doi: 10.1016/j.egypro.2016.01.017
Abstract
There are two main routes for amine emission. The first one is connected to volatile amine emission. The second route is amine emission via aerosols. Recently, it has been observed that under certain conditions and at specific test locations significant aerosol formation and emission can occur. To distinguish between the two routes for amine emission, a novel methodology has been developed. This methodology is based on the separation of the aerosols from the vapour phase in a controlled isothermal modus. To be able to do this, the design of the probe and the sampling procedure should fit to the operational circumstances and is of crucial importance to guarantee isokinetic sampling. The separation of the aerosols is done via an impactor. Using an impactor, not only the total mass of aerosols can be determined, but also the size distribution.
At the end of 2013 and at the beginning of 2014, two aerosol measurement campaigns were performed at CO2 Technology Centre Mongstad, Norway. The measurements indicate that small amounts of aqueous aerosols with a broad aerosol size distribution are present in the flue gas stream from gas turbine operations. The presence of aqueous aerosols does not necessarily imply significant amine emission from the amine process. Analysis of the aqueous aerosols indicates low amine content present in the aerosol fractions, and it seems evident that amines present in the gaseous phase inside the absorber column have not been transferred to the aqueous aerosols and by such the total amine emissions are very low.
1. Introduction
CO2 Technology Centre Mongstad (TCM DA), located next to the Statoil refinery near Mongstad, Norway, is one of the largest post-combustion capture test facilities in the world. TCM DA is a joint venture between Gassnova, Statoil, Shell, and Sasol. The purpose of this facility, which started operation in August 2012, is to allow vendors of suitable amine formulations and other carbon capture processes to test their technology and collect performance data to support full-scale design and anticipate the associated performance and operating costs. A unique aspect of the facility is that either a slipstream from a natural gas-fired combined heat and power (CHP) plant or an equivalent volumetric flow from a refinery residue fluid catalytic cracker (RFCC), whose higher CO2 content (about 12.9% compared with about 3.5% for the natural gas-based flue gas) is closer to that seen in coal flue gas, can be used for CO2 capture. In the CHP plant, the natural gas is combusted in a gas turbine and the flue gas content and characteristics are similar to those of a combined cycle gas turbine (CCGT) power plant.
One of the testing facilities in place at TCM DA is a highly flexible and well-instrumented generic amine plant, designed and constructed by Aker Solutions and Kværner, aimed to accommodate a variety of technologies with capabilities of treating flue gas streams of up to 60,000 Sm3/hr. This plant is being offered to vendors of solvent- based CO2 capture technologies to primarily test: (1) the performance of their solvent technology; and (2) technologies aimed to reduce the atmospheric emissions of amines and amine-based degradation products from such solvent-based CO2 capture processes.
Between December 2013 and February 2014, a monoethanolamine (MEA) solvent campaign was performed as part of Aker Solutions’ test campaigns at TCM DA treating CHP flue gases. During this period, two aerosol measurement campaigns were performed as a collaboration between TNO and TCM DA in order to investigate amine emissions via the mechanisms of aerosols and the effectiveness of commercially available knitted wire mesh demisters.
This work is part of a continuous effort of gaining better understanding of the performance potential of the non- proprietary aqueous MEA solvent system, conducted by TCM DA and its affiliates and owners, in order to test, verify, and demonstrate CO2 capture technologies.
2. Aerosol Emission: mechanism and impact
Volatile amine emission can be considered as well understood, and is usually related to the volatility of the amine compound(s), gas to liquid flow ratios in the absorber column, etc. Countermeasures such as water wash and acid wash sections can be properly designed in order to mitigate such volatile amine emissions [1]. However, recently it has been seen that under certain conditions significant amine emission can occur via aerosols. Although the detailed mechanism is not yet fully understood, it is generally accepted that a gas phase mass transfer mechanism of amines into aerosols present in the flue gas results in increased amine emissions. The size, number, and types of particles present in the flue gas before the absorber are important parameters [2-4]. Condensation or adsorption of amines and water on particle surfaces or (physical) absorption of amines into aqueous particles may contribute to the increased emissions [5]. Typically, this would lead to sub-micron sized aerosols containing amines [6]. Traditional countermeasures like demisters and water or acid washes are not suitable to remove such aerosols. Amongst others, options such as electrostatic precipitator (ESP) and Brownian demister units have been studied, but these options would lead to significant additional cost [7,8]. To be able to design more cost effective countermeasures, it is needed to improve the understanding of the mechanism of aerosol formation. TNO has been working on a new methodology for the isolation of the aerosols from flue gas, given in details below. By creating more knowledge on the size and composition of these aerosols, steps can be made for developing detailed models. This methodology has been demonstrated at the TCM DA amine plant.
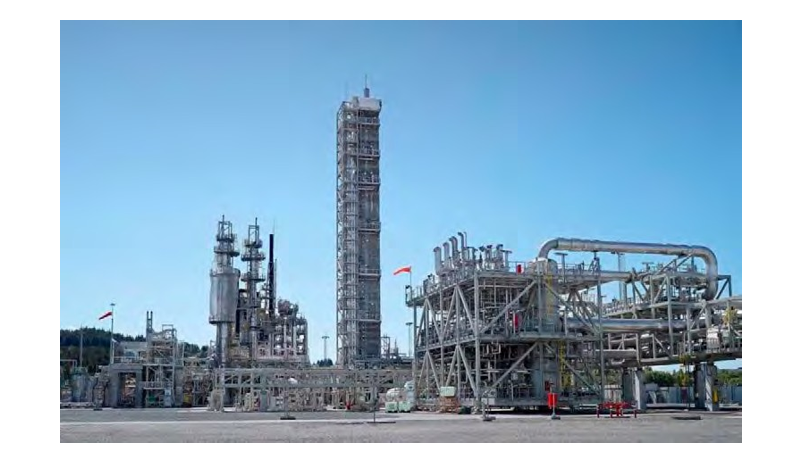
The flow schematics for the TCM DA amine plant treating CHP flue gas is shown in Fig. 1 and a picture of the amine plant is shown in Fig. 2.
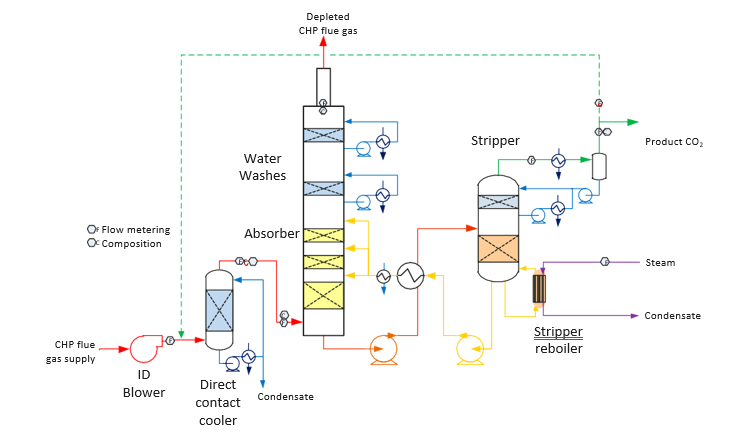
Fig. 1. Simplified flow schematic for TCM DA amine plant treating CHP flue gas
The nominal characteristics of flue gas from the CHP source both before and after the direct-contact cooler (DCC) treatment are shown in Table 1. The primary purpose of the DCC is to temperature control and water saturate the flue gas, in addition to scrub the flue gas with process water. The CHP flue gas is typical of high excess air combustion turbine exhaust.
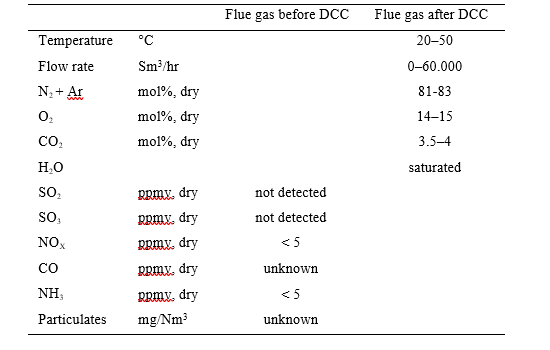
The direct-contact cooler (DCC) system initially quench and lower the temperature and saturate the incoming flue gas by a counter-current flow water in order to improve the efficiency of the absorption process and provide pre-scrubbing on the flue gas. The DCC column designed for CHP flue gas operations has a 3-m diameter and a total height of 16 m. The section where water counter currently contacts the flue gas is of 3.1 m height with Flexipack 3X structured stainless-steel packing of Koch Glitsch. Above the contact section is a 0.2 m Meshpad demister type 412 of FMC Technologies with an overhead water sparging system.
The purpose of the absorber is to remove CO2 from the flue gas using solvent. The absorber has a rectangular polypropylene-lined concrete column with a cross-section measuring 3.55 x 2 m of a total of 62 m of height. The lower regions of the tower, where the amine solution contacts the flue gas, consist of three sections of Koch Glitsch Flexipac 2X structured stainless-steel packing of 12 m, 6 m, and 6 m of height, respectively. Water-wash systems are located in the upper region of the tower to scrub and clean the flue gas particularly of any solvent carry over, and consist of two sections of Koch Glitsch Flexipac 2Y HC structured stainless-steel packing of both 3 m of height. The process is operated to be water neutral in order to maintain water balance, i.e. the recirculating water washes at the top of the absorber are used to temperature control the depleted flue gas for water content control. If water accumulates in the absorber-stripper loop, the flue gas temperature leaving the absorber is allowed to increase, increasing the water vapor content of the depleted flue gas, and vice versa.
The absorber tower includes two demisters located above the absorption section: one is installed below the lower water wash section to reduce the amount of amine entrained with the flue gas exiting the absorption section, and the other one is installed above the upper water wash section to reduce amine contaminated water entrainment released to air with the flue gas. Both demisters are 0.3 m knitted wire mesh demisters type 172 of Koch Glitsch.
The CO2 depleted flue gas exits the absorber column to the atmosphere through a 1 m diameter nozzle stack located at the top of the absorber column in order to increase the flue gas velocity and lift.
The TCM amine plant is described in further details elsewhere [9-12].
3. Design and Construction of Aerosol Emission Detector
The design of the aerosol sampling equipment was made specific for the conditions at TCM DA. A superficial velocity of 2 m/s was taken as the reference, with an anticipated variation of this velocity in the range of 1.5 m/s to
2.5 m/s during the measurement campaign. The aerosols were to be sampled at a typical distance of 0.6-1.0 meter from the inside of the absorber wall, and equipment had to fit to a standard ASME B16.5 size flange on site. The pressure at the top of the demister was atmospheric, and within the absorber of typically 10-40 mbar excess pressure. These data were used to set design requirements for the aerosol sampling equipment. Construction of the equipment and settings of flow and temperature during experiments were then as close as reasonably practical to the design requirements derived from the above conditions.
The basic design of the sampling system consisted of 1) a probe with nozzle inserted into the absorber tower, 2) a piece of glassware that splits the incoming flow, and 3) an Anderson Cascade Impactor (ACI) that separates the aerosol in different particle size ranges. Some of the sampling system is shown in Fig. 3. The flow exiting the glassware (in Fig. 3) downwards is towards the ACI and should be 28.3 l/min, whereas the flow exiting to the right is to adjust the flow profile near the nozzle of the probe in order to operate close to iso-kinetic conditions. The nozzle of the probe and the tube inside the flow splitting section, are tapered in order not to disturb the flow profile.
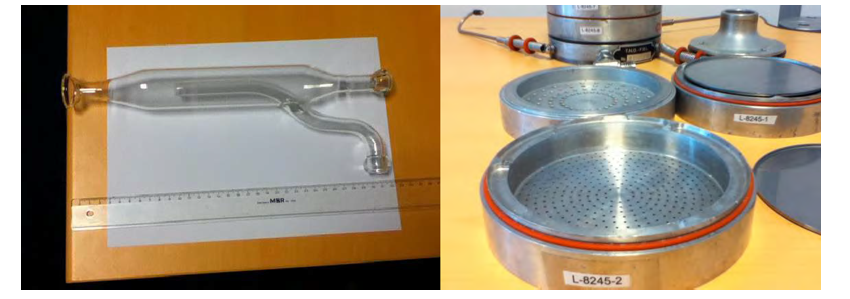
The ACI is a standard measurement device to determine aerosol particle size distributions. The challenges of this application are 1) the transfer of the aerosol from within the absorber towards the ACI positioned outside the absorber and without deposition of aerosols in this flow path or a change in particle size distribution, 2) collection of liquid instead of solid aerosol particles from a (nearly) saturated vapor, and 3) handling the ACI with associated equipment and shielding those against the influence of weather and temperature conditions on experimental results.
The ACI requires a precise flow of 28.3 l/min, and collects the aerosol particles on 8 different trays (stages). Meeting the flow requirement means that particles sizes are collected in the following ranges: > 9 mm in stage 1, 5.8-9.0 mm, 4.7-5.8 mm, 3.3-4.7 mm, 2.1-3.3 mm, 1.1-2.1 mm, 0.65-1.1 mm and 0.43-0.65 mm in stage 8. As the Stokes number, the particle stopping distance divided by the nozzle radius, is a constant for each tray, one can derive from the impactor design equations in [13] that with an increase of the actual flow particles of smaller diameter are caught on each tray. Abovementioned particle ranges change with actual flow Qactual according to

The additional flow to create horizontal streamlines within the flow splitting section of Fig. 3. can be calculated from the dimensions of the inner tube ( Øint=13 mm, Øext=13 mm) and the outer tube (Øint=26 mm). The additional flow is 58.9 l/min, yielding a total flow of (28.3 + 58.9) l/min = 87.2 l/min.
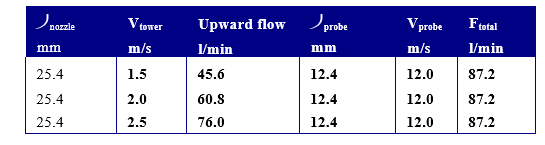
With an internal diameter of the probe of 12.4 mm, it follows that 87.2 l/min will lead to a flow velocity in the probe of 12.0 m/s. The probe has a nozzle with 25.4 mm internal diameter and was chosen to be close to the iso- kinetic sampling condition as demonstrated in Tab. 2, by comparison of the upward flow through a 25.4 mm diameter area and the 87.2 l/min total flow drawn in through the nozzle.
The condition of horizontal streamlines in the flow splitting section is preferred over iso-kinetic sampling, because of the sampling over a large particle size interval. The upward flow is somewhat smaller than the flow through the probe, indicating that the flow near the probe nozzle must be slightly convergent.
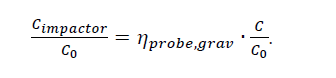
The transport efficiencies due to settling in the tubes are calculated, as well as the concentration variation across the nozzle due to non-isokinetic sampling. Transport efficiencies should be close to 1 (i.e. 100% of aerosol particle transfer along the probe length), and concentration variation across the nozzle should be negligible. Both transport efficiency and concentration variations can be evaluated as function of aerosol particle size by using the equations provided in [14]. The transport efficiency 11probe,grav for aerosol transport along the probe which accounts for gravitational deposition, is calculated using
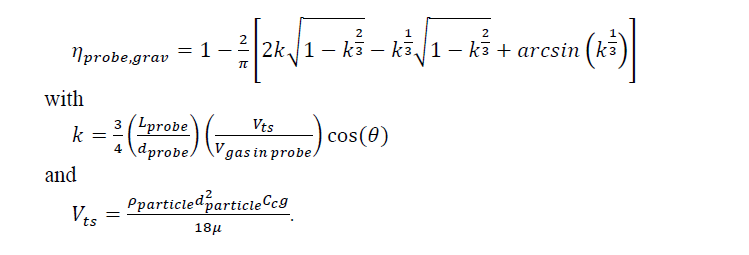
In eq. (1) Lprobe is the length of the probe, dprobe the inside diameter of the probe, Vts the terminal settling velocity of particles, Vgas the velocity of the gas in the probe, and 8 the inclination of the probe. The terminal settling velocity is a function of the aerosol particle density p, the particle diameter dparticle, the Cunningham slip correction factor Cc, gravitational acceleration g, and the flue gas viscosity m.
The aspiration efficiency accounting for concentration change at the inlet nozzle is calculated using
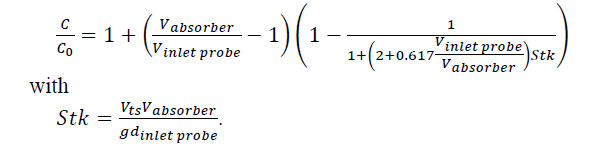
In eq. (2) C is the particle size dependent concentration in the inlet of the probe, C0 is the particle size dependent concentration of the aerosol in the absorber, Vabsorber is the superficial velocity of the flue gas in the absorber tower, Vinlet probe is the velocity of the gas in the nozzle at the inlet probe and which has a diameter dinlet probe. and Stk the Stokes number.
The product of eqs. (1) and (2) gives the expected ratio of the concentration at the inlet of the impactor and the aerosol concentration in the absorber.
Calculations results are shown here for superficial velocities of 1.5, 2.0 or 2.5 m/s, a nozzle internal diameter of
25.4 mm, a probe diameter of 12.4 mm and probe length of 1.0 or 2.0 m and a velocity in the probe of 12.0 m/s. Calculations were performed for an aerosol in air, a temperature of 40 °C, and a pressure of 101.2 kPa. The
Reynolds number in the probe is 9850 and is just in the turbulent regime. The calculated transport efficiencies according to laminar flow or to turbulent flow, are approximately the same. Note that the ACI measures in the range 0.43 – 11 mm.
The length of the probe has a relatively large influence on the transport efficiency. For a 1 m probe more than 97% of 10 mm particles will be transported (i.e. less than 3% will settle in the tube), while for a 2 m probe still 95% of 10 mm particles will be transported, see Fig. 4.
With a flow velocity of 1.5, 2.0 and 2.5 m/s, respectively, more than 97%, 98% and 99% of the 10 mm particle concentration in the absorber, will be present inside the inlet of the probe, see Fig. 5.
The overall effect (concentration change at the inlet, and transport efficiency through the tube) indicates that for 10 mm particles between 92% (1.5 m/s, 2.0 m) and 97% (2.5 m/s, 1.0 m) will reach the ACI, see Fig. 6. For smaller aerosol particles the figures will be better. For 3 mm particles, one calculates that more than 99% will reach the ACI.
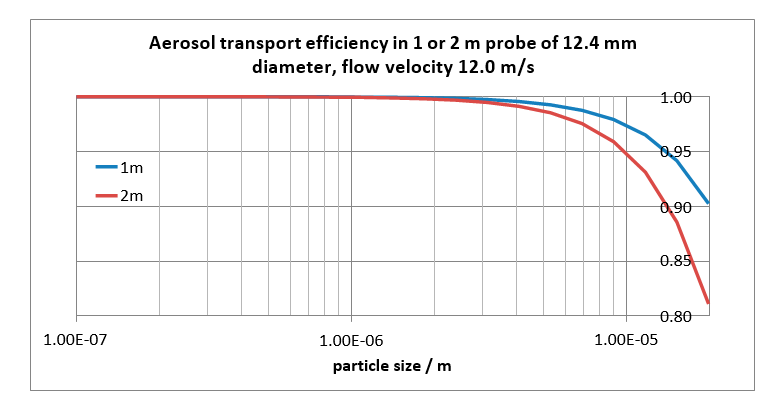
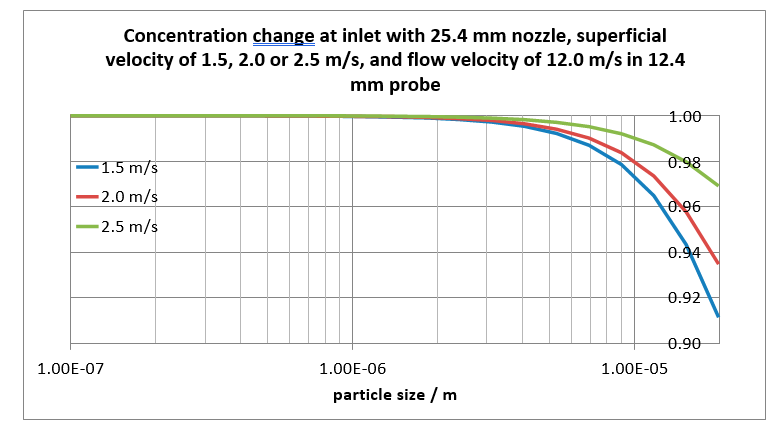
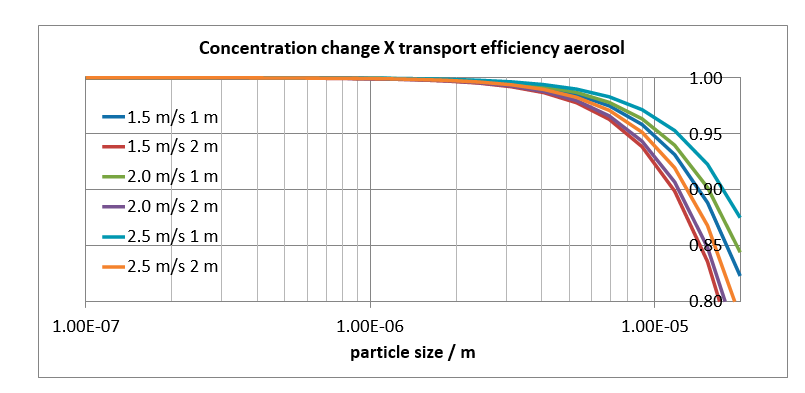
Fig. 6. Ratio of measured aerosol particle size distribution and true aerosol particle size distribution, as function of particle diameter. The ratio depends on probe length as well as near-isokinetic sampling conditions.
Even though it is clear one should minimize the probe length for a better aerosol capture, a minimum length is needed to bridge distance in practice. The minimum probe length is 191 cm, based upon a measurement 60 cm into the absorber, a 50 cm absorber concrete wall thickness, 71 cm from wall to spool tee, and 10 cm external to spool tee. The data in Fig. 4 and Fig. 6 corresponding to a 2 meter probe length are therefore relevant to the experiments.
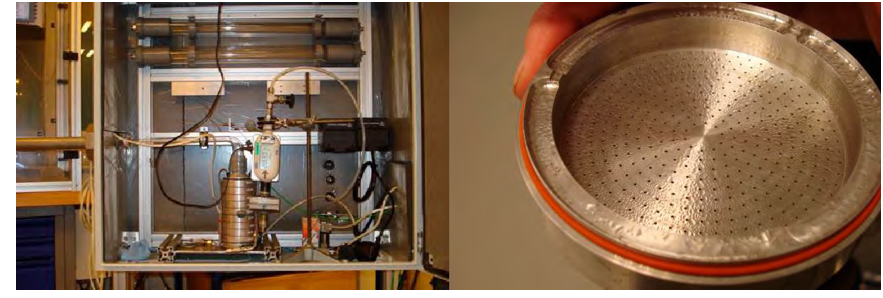
The glass probe was mounted with thermocouple for measurement of the local absorber temperature, and with heat tracing into a metal tube. The metal tube can be inserted at the various measurement locations available at the absorber tower. The flow split section with ACI was located in an isolated box with temperature control, which was connected to the nozzle, see Fig. 7. In the experimental campaign the logged temperature in the aerosol box was maintained 2 to 4.4 °C above the temperature at the sample point, because of the finding under laboratory conditions that aerosol collection from a saturated vapor will lead to condensation on the impactor surface starting at the lowest nozzle plates with the smallest holes. This condensation should not spill over to the collection trays inside the impactor and thus limits the duration of a vapor collection experiment.
4. Results at Technology Centre Mongstad
There is a demister above the absorption section and a demister above the water wash section in the absorber tower. A total of four sampling locations were available for aerosol sampling, upstream and downstream the two demisters. Sampling location 1 and 2 are respectively upstream and downstream the lower demister, i.e. located above the absorption section, and sampling location 3 and 4 are respectively upstream and downstream the upper demister, i.e. located above the upper water wash section.
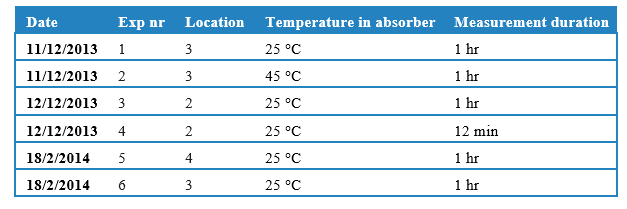
Measurements were performed in two campaigns, in December 2013 and in February 2014. The sampling locations, temperatures in the absorber and measurement durations are indicated in Tab. 3. In the four experiments in December it was noticed that liquid was collected in the flow splitting section in the aerosol box. It seems that the cold environment and the long external tube lowered the temperature of the probe, even though the flue gas may circulate around the probe and despite the short contact time of the sampled gas in the probe. An external heating band was added to the 2 meter long probe for the last two experiments, with trace heating controlled by the temperatures measured at the tip of the probe and halfway the probe.
An important aspect is the collection of filter papers from the ACI. In contrast to a laboratory environment the experiment is carried out in the open and at high elevation. It was decided to transfer the ACI from the absorption tower to a remote location and there disassemble the ACI, weigh, and store the filter papers.
The total mass of aerosols collected by the ACI and the calculated aerosol concentration are given in Tab. 4, for the experiments with trace heating of the probe. Further to the intended aerosol sampling, 5 mL/min of the flow leaving the ACI and thus free from aerosols, was passed through a series of three aqueous sulfuric acid filled impingers. The vapor concentration calculated from the measured weight increase of the flasks with aqueous sulphuric acid is presented in Tab. 4, as well as the amine content of the vapor determined by LC-MS. The vapor concentration in experiment 5 is below 21·103 mg/Nm3; the latter value corresponding to the maximum amount of condensable water vapor at the process temperature. The MEA emissions in the vapor phase as found by chemical analysis by LC-MS in the current work, are similar to the reported MEA emissions in the order of 10-2 mg/Nm3 by Morken et al. [12]. This reference reports absorber stack emission results from the MEA campaign applying iso- kinetic gas measurements.
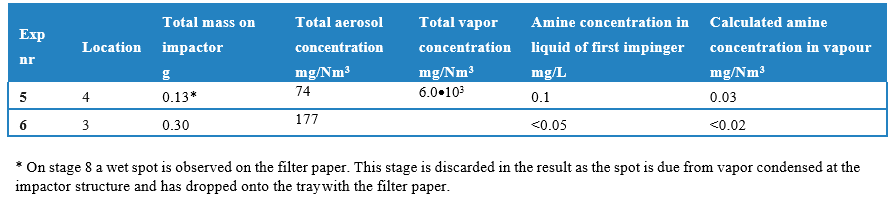
Table 4. Total mass of aerosol (water and amine) collected by the ACI and the calculated aerosol concentration, as well as the total vapour concentration (water and amine) calculated from weight increase impinger, during 1 hour experiment.
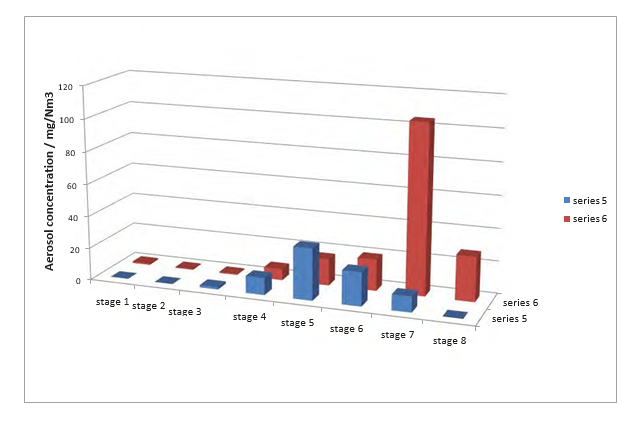
The particle size distributions are given in Fig. 8. Series 6 is a measurement of the aerosol particle distribution directly above the wash section and before the demister. Aerosols have a size in the range of 0.43 to 4.7 mm. The measurement on stage 7 seems too high; and one should note that in the laboratory condensation was noticed starting at the lower nozzle plates, with the risk of droplets falling down on the tray below, see Fig. 7.
Series 5 is a measurement of the aerosol as in series 6 only after passing the demister. Broadly the same particle size range is observed, from 0.65 to 4.7 mm, with a maximum near 3 mm. This is expected as a demister would be effective typically at particle sizes of 10 mm and above.
5. Conclusions and recommendations
The following conclusions can be drawn from the aerosol measurement campaign.
- One can design and optimize aerosol transfer and aerosol collection devices from aerosol kinetics theory. Effective transfer of aerosols with particle sizes up to 10 mm and over a 2 meter distance should result in a loss of aerosol particles of at most 8 % (i.e. for the largest particles size) for the designed equipment and under flow conditions.
- Aerosol collection from a nearly saturated vapor stream requires strict control over impactor temperature, and limits the duration of aerosol collection. Also the probe requires temperature tracing to avoid preliminary conditions during aerosol transfer.
- Small amounts of aerosols are present with particles up to 4.7 mm. The total concentration on mass basis is around 100 mg/Nm3.
- The aerosols contain for the largest part water. Total amine emissions, emissions based on volatility and aerosol formations, are very low.
A recommendation for future experiments is to analyze the amine concentration of the aerosol samples by directly transferring the filter papers put on individual stages of the impactor into vials with a known quantity of an aqueous sulfuric acid solution. The extent of evaporation is thus minimized, and samples can safely be analyzed at a later moment for example with LC-MS, providing an amine concentration per particle size range. This, however, would be at the expense of determining the total mass of water and amine per particle size range.
The measurements presented here are in the absorber tower. In a risk assessment of amine plants for CO2 capture, the relation between discharge rates from the absorber at TCM Mongstad and downstream concentrations in air and drinking water were compared to NIPH guidelines values [15]. Nitrosamine and amine discharge values were considered acceptable.
References
- Khakharia, P., Huizinga, A., Jurado Lopez, C., Sanchez Sanchez, C., De Miguel Mercader, F., Vlugt, T.J.H., Goetheer, E. Acid wash scrubbing as a countermeasure for ammonia emissions from a postcombustion CO2 Capture Plant (2014) Industrial and Engineering Chemistry Research, 53 (33), pp. 13195-13204.
- Kamijo, T., Kajiya Y., Endo, T., Nagayasu, H., Tanaka, H., Hirata, T., Yonekawa, T., Tsujiuchi, T. SO2 impact on amine emissions and emission reduction technology (2013) Energy Procedia 37, pp. 1793-1796.
- Bade, O. M., Knudsen, J. N., Gorset, O., Askestad, I. Controlling amine mist formation in CO2 capture from Residual Catalytic Cracker (RCC) flue gas (2014) Energy Procedia 63, pp. 884-892.
- Khakharia, P., Brachert, L., Mertens, J., Anderlohr, C., Huizinga, A., Fernandez, E.S., Schallert, B., Schaber, K., Vlugt, T.J.H., Goetheer, E. Understanding aerosol based emissions in a Post Combustion CO2 Capture process: Parameter testing and mechanisms (2015) International Journal of Greenhouse Gas Control, 34, pp. 63-74.
- Khakharia, P., Brachert, L., Mertens, J., Huizinga, A., Schallert, B., Schaber, K., Vlugt, T.J.H., Goetheer, E. Investigation of aerosol based emission of MEA due to sulphuric acid aerosol and soot in a Post Combustion CO2 Capture process (2013) International Journal of Greenhouse Gas Control, 19, pp. 138-144.
- Mertens, J., Brachert, L., Desagher, D., Thielens, M.L., Khakharia, P., Goetheer, E., Schaber, K. ELPI+ measurements of aerosol growth in an amine absorption column (2014) International Journal of Greenhouse Gas Control, 23, pp. 44-50.
- Mertens, J., Anderlohr, C., Rogiers, P., Brachert, L., Khakharia, P., Goetheer, E., Schaber, K. A wet electrostatic precipitator (WESP) as countermeasure to mist formation in amine based carbon capture (2014) International Journal of Greenhouse Gas Control, 31, pp. 175-181.
- Khakharia, P., Kvamsdal, H.M., Da Silva, E.F., Vlugt, T.J.H., Goetheer, E. Field study of a Brownian Demister Unit to reduce aerosol based emission from a Post Combustion CO2 Capture plant (2014) International Journal of Greenhouse Gas Control, 28, pp. 57-64.
- Thimsen D, Maxson A, Smith V, Cents T, Falk-Pedersen O, Gorset O, Hamborg E S. Results from MEA testing at the CO2 Technology Centre Mongstad. Part I: Post-Combustion CO2 capture testing methodology. Energy Procedia 63 (2014) 6012–6022.
- Hamborg E S, Smith V, Cents T, Brigman N, Falk-Pedersen O, De Cazenove T, Chhaganlal M, Feste J K, Ullestad Ø, Ulvatn H, Gorset O, Askestad I, Gram L K, Fostås B F, Shah M I, Maxson A, Thimsen D. Results from MEA testing at the CO2 Technology Centre Mongstad. Part II: Verification of baseline results. Energy Procedia 63 (2014) 6012–6022.
- Brigman N, Shah M I, Falk-Pedersen O, Cents T, Smith V, De Cazenove T, Morken A K, Hvidsten O A, Chhaganlal M, Feste J K, Lombardo G, Bade O M, Knudsen J, Subramoney S C, Fostås B F, De Koeijer G, Hamborg E S. Results of amine plant operations from 30 wt% and 40 wt% aqueous MEA testing at the CO2 Technology Centre Mongstad. Energy Procedia 63 (2014) 6012–6022.
- Morken A K, Nenseter B, Pedersen S, Chhaganlal M, Feste J K, Tyborgnes R B, Ullestad Ø, Ulvatn H, Zhu L, Mikoviny T, Wisthaler A, Cents T, Bade O M, Knudsen J, De Koeijer G, Falk-Pedersen O, Hamborg E S. Emission results of amine plant operations from MEA testing at the CO2 Technology Centre Mongstad. 63 (2014) 6012–6022.
- Marple, V.A., Willeke, K., Impactor design, Atmospheric Environment Vol 10 (1976) 891-896.
- Chapter 6, Sampling and transport of aerosols, J.E. Brockmann, in Aerosol Measurement, Principles Techniques and Applications, eds. K. Willeke and P.A. Baron.
- De Koeijer, G., Randgaard Talstad, V., Nepstad, S., Tønnessen, D., Falk-Pedersen O., Maree, Y., Nielsen, C., Health risk analysis for emissions to air from CO2 Technology Centre Mongstad, International Journal of Greenhouse Gas Control 18 (2013) 200–207