
1. A Dynamic Modelling Tool to Ensure the Safety of Drinking Water Sources Near Amine-Based CO2 Capture Plants
Cathrine Brecke Gundersena*, Armin Wisthalerb, Massimo Cassianic, Magnus D. Norlinga, Aina C. Wennberga, François Clayera, Peter Dörschd, Zeeshan Muhammade, Marius Tednesf, and Nadya Levianag
*Corresponding author. Email address: cbg@niva.no
aNorwegian Institute for Water Research (NIVA), Økernveien 94, 0579 Oslo, Norway
bUniversity of Oslo, Department of Chemistry, Sem Sælandsvei 26, 0371 Oslo, Norway
cNILU, Instituttveien 18, 2007 Kjeller, Norway
dNorwegian University of Life Sciences, Faculty of Environmental Sciences and Natural Resource Management, Postboks 5003, 1432 Ås, Norway
eTechnology Centre Mongstad (TCM), Mongstad 71, 5954 Mongstad, Norway
fHafslund Oslo Celsio, Klemetsrudveien 1, 1278 Oslo, Norway
gAker Carbon Capture, Strandvejen 125, 2900 Hellerup, Danmark

Abstract
Herein we present the development of a dynamic modelling tool intended to aid industries and regulators in the protection of drinking water sources located near amine-based CO2 capture plants. Risk is associated with carcinogenic and potentially carcinogenic nitrosamines (NSAs) and nitramines (NAs), respectively, that will form in the air from amines inevitably escaping the capture plant. These are very soluble molecules that can end up in drinking water sources such as lakes and groundwater basins. In Norway, a drinking water safety limit has been set for the sum of NSAs and NAs. Any ongoing CO2 capture activities must regulate their operations accordingly, i.e. to avoid exceedances of NSAs and NAs in nearby drinking water compartments. The modelling tool will assist in such regulations, by translating measured amine emissions at the stack to NSA and NA levels in a nearby water compartment. The tool will consist of a new atmospheric model which will be run together with a catchment model. The atmospheric simulations will be verified by in-situ plume measurements. Further improvements of the model accuracy will be achieved from laboratory experiments:
1) verifying atmospheric amine chemical reaction rates, and
2) assessing the biodegradability of the NAs.
Finally, to make the advanced model available to the stakeholders, a web-based application will be developed. In the web-app, different settings, such as the application of water wash at the capture plant, can be adjusted to see directly the effect on the NSA and NA levels in a nearby lake or groundwater basin. By improving this tool and the associate knowledge base we aspire to contribute to the safe and cost-efficient implementation of amine-based CO2 capture technology.
Keywords: CO2 capture; amine degradation; nitrosamine; nitramine; environment; drinking water
1. Introduction
While CO2 capture is intended to positively impact the climate, its implementation must proceed with minimum negative effects on the local environment and human health. There is an ongoing political push to ramp up the development and implementation of CO2 capture in North America and Europe. This is consistent with national and European Unions (EU) obligations to drastically reduce their greenhouse gas emissions [3]. For example, this year, the EU has issued a strategy on how to reach net-zero emissions by 2050 which is largely dependent on the different forms of CO2 capture technologies [4]. The focus for the first decade is on implementing CO2 capture at process emission sites as well as some sites of fossil and biogenic CO2 sources. Within the EU, most of the major industrial hubs, eligible for CO2 capture, are in densely populated regions. Thus, there is an urgent need to fully understand- and resolve potential negative impacts that this technology may have on the local environment.
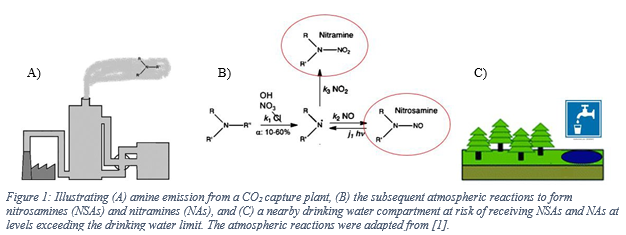
Along with the widely employed amine-technology comes the risk of forming carcinogenic and potentially carcinogenic nitrosamines (NSAs) and nitramines (NAs), respectively (Figure 1). These will form in the atmosphere from amines that inevitably escape the capture plant [1, 5]. Both compound groups are highly water-soluble, and concern is related to these ending up in nearby drinking water sources (e.g., groundwaters, lakes, etc.). In Norway, a drinking water safety limit has been set at 4 ng L-1 for the sum of NSAs and NAs [6]. Comparably low safety limits exist in other countries, but only for selected NSAs (e.g., action level of 3 ng L-1 in California; monitoring requirement at 1 ng L-1 in England and Wales) [7, 8].
Recent measurements at pilot CO2 capture plants indicate amine emissions in the ppb to ppm range, and with the levels being expectedly higher at a full-scale capture plant. The amount of emitted amines that will be converted to NSAs and NAs is governed by local air chemistry as well as the type of amines used at the capture plant. The atmospheric reaction is fast and proceeds with initial attack on the amine by an atmospheric oxidant (e.g., OH*) to form an amine radical. Subsequently, the amine radical reacts with a nitrogen oxide (NOx) to form either a NSA or a NA [1, 5, 9]. Primary amines such as 2-amino-2-methyl-1-propanol (AMP) and monoethanolamine (MEA) will form stable NAs while the corresponding NSAs will be unstable. Secondary amines (e.g. piperazine) can form both stable NSAs and NAs. Tertiary amines (e.g. methyldiethanolamine) will be degraded to secondary amines which can then react to form stable NSAs and NAs [10].
To assess whether the location of a sourced drinking water compartment is at risk of receiving NSAs and NAs above the safety limit, factors such as local weather and topography as well as degradation processes are decisive. For example, the dominating wind direction and speed will influence where the NSAs and NAs are likely to be deposited. Once on ground, they will follow the hydrological flow regime with overland flow, soil-pore and groundwater flow, from rivers into lakes. During daylight, NSAs are rapidly photodegraded on timescales ranging from minutes to hours [11-13]. By contrast, no efficient degradation pathway has been identified for NAs. Thus, there is a risk of NAs accumulating in a water compartment over time. One contended degradation pathway that has not been thoroughly investigated is biodegradation. Only one study has been conducted, reporting slow or no biodegradation for NAs in lake water [14].
In Norway, amine-based CO2 capture activities must comply to the drinking water safety limit [6]. This is carried out by limiting the amount of amines emitted with the cleaned flue gas. Amine emission permits are set in a site- specific manner, based on the drinking water limit, and by back-calculating from a nearby drinking water compartment. The estimates are conservative and based on rudimentary atmospheric modelling [15]. One reason for this simplified approach is the current lack of analytical methods capable of determining NAs in water at the required low level of the drinking water limit [16]. Instead, concentrations of amines in the emitted flue gas can be determined at low levels and with high certainty [17, 18]. However, there are shortcomings to the method currently used for estimating amine emission permits. This covers fundamental approximations used to describe the plume, the lack of validation through measurements, and the lack of incorporating the catchment processes. Moreover, to adhere to the precursory principle, worst case conditions are adopted at nearly all stages of the calculations where high uncertainty is related to the parameter value. Thus, this may lead to unrealistic and strict amine emission permits, thereby exerting unwarranted constraints to the technology.
The Technology Centre Mongstad (TCM) in Norway is the world’s most advanced and flexible test arena for CO2 capture technologies and is visited by private companies from all over the world. The site is near to several lakes that serve as drinking water sources for the local population [15]. This has resulted in low amine emission permits which currently restrict operations at TCM. To enable tests of the full range of amine solvents and flue gas compositions relevant for the industry, special concessions must be sought for from the environmental regulators. Considering that the size of the TCM facility constitutes only a fraction of a full-scale CO2 capture plant, it is likely that full-scale plants will require extensive and costly amine emission mitigation measures to remain within the permit. And given that the permit is calculated using the current method and knowledge base. Examples of amine emission mitigation options cover a reduced CO2 capture rate, additional rinsing of the flue gas or reheat of the flue gas prior to emission. These are costly options that will lead to a net reduction in the CO2 removal rate.
To ensure safe and cost-efficient implementation of amine-based CO2 capture technology, there is an urgent need to improve the method used to calculate the amine emission permits. New calculation methods should be based on new scientific evidence and an improved knowledge base safeguarding drinking water quality while at the same time avoiding unnecessary strict regulations of the capture process. We propose that this can be achieved through
1) an improved atmospheric model predicting the formation and transport of NSAs and NAs,
2) validating the new atmospheric model by in-plume and laboratory measurements,
3) coupling the atmospheric model to an existing catchment model, and
4) accounting for NAs potential biodegradation along flow paths within the catchment.
Herein we describe ongoing activities targeted to achieve these ambitious objectives. This is within the scope of the ongoing project, “Future drinking water levels of nitrosamines and nitramines near a CO2 capture plant (FuNitr)”.
2. Improved atmospheric model
In most instances, NSAs and NAs will form as products from reactions between constituents in the flue gas (amines) and in the background atmosphere (oxidants and NOx). Atmospheric oxidants are naturally present at background levels or stem from certain types of industrial activities in the vicinity. Sources of NOx are dominantly anthropogenic such as vehicular traffic or as constituents of the flue gas itself. For the chemical reactions to occur, the amine must encounter the oxidant and subsequently the NOx. Thus, to simulate NSA and NA formation and deposition rates, a realistic description of the plume dispersion and mixing is a prerequisite. The dilution of the emitted plume and the consequent contact between emitted and pre-existing chemical compounds occurs at a rate controlled by atmospheric turbulent mixing. To be able to integrate this into a model both the turbulent dispersion and the amine atmospheric chemistry must be adequately described.
This can be archived by using a special case mixing plume in grid Lagrangian Stochastic (LS) model which can be combined with an atmospheric chemistry transport model adapted for lower computational costs (EPISODE). The latter will cover the complex non-linear gas phase chemistry of amines. Characteristic for a standard LS model is its ability to simulate plume movement using a large number of notional particles [19, 20]. An LS model with mixing implies that the emitted particles are simulated together with particles representing the atmospheric background. The resolution is defined by the number of particles, which can be set high to realistically simulate the extreme dynamics of the plume. The mixing module describes encounters between the reactant compounds [21, 22], and simulates the decay of turbulent concentration fluctuations at the rate driven by the turbulent flow [21-23]. The explicit modelling of turbulent mixing implies that no approximations of the averaging operators are needed when solving a non-linear kinetic equation (chemistry appears in closed form) [22], which is typically required in other commonly used atmospheric chemistry transport models.
3. Validating atmospheric measurements
Two different sets of validation measurements will contribute to increase the accuracy of the atmospheric simulations. The first is to validate the NSA and NA atmospheric formation rates under realistic conditions. These have previously been experimentally determined, but only under ideal conditions in a large outdoor simulation chamber [24]. Second, there is a need to validate the output of the atmospheric model which has not previously been conducted in this context.
3.1 Atmospheric NSA and NA formation rates
At TCM there is a worldwide unique small laboratory placed on top of the absorption tower, where the treated flue gas is released to the atmosphere. This allows for the study of amine processing under near-real conditions. The atmospheric chemical transformations can be studied by leading the amine-treated flue gas into a small atmospheric simulation chamber.
3.2 In-situ plume measurements
In-situ plume measurements will be carried out by equipping a helicopter with state-of-the-art instrumentation capable of determining amines, NSAs, and NAs, in addition to NOx (NO and NO2), solar radiation (including NO2 photolysis frequency), etc. Such instrumentation must be ultra-sensitive and fast (1 Hz) to capture the low atmospheric levels from a rapidly moving helicopter. Aerial measurements are required since it is not possible to properly measure a wandering plume using fixed position measurements [25, 26].
4. Connecting the atmospheric model to a catchment model
To realistically simulate future levels of NSA and NA in a water compartment, catchment processes must be considered alongside the atmospheric processes. Moreover, the inclusion of the catchment processes will allow for assessing the possibility of NSAs and NAs to accumulate in the water with time. This can be done by running the atmospheric model in combination with a catchment model.
The importance of including the catchment module has already been demonstrated both for a lake- and a groundwater drinking water reservoir, as presented below. This was done using the INCA-Contaminant model [27] which is a high-resolution and dynamic catchment model, building on the hydrology model PERSiST [28]. Following deposition of NSAs and NAs on the ground, the catchment model simulates NA and NSA transportation to the lake or groundwater basin with soil- and groundwater runoff. The model is fed with site-specific numeric information, including catchment characteristics and climatic conditions to establish a site-specific scenario. More information about the model framework can be found here: nivanorge.github.io
4.1 Case study: lake
In the situation of a lake, NSAs and NAs will be supplied to the lake both directly from atmospheric deposition and with runoff draining the entire catchment. The study site was a lake located “downwind” from a planned full- scale CO2 capture plant [2]. A nearby high trafficked road contributed with excess NOx. The catchment model was fed with NSA and NA deposition rates and concentrations computed using a rudimentary atmospheric model. Continuous CO2 capture for ~20 y was assumed.
Results showed distinct long-term seasonal patterns in the lake water levels of NSAs and NAs (Figure 2) which reflected different response to key processes between the two compound groups. While the levels of NSAs were found to be relatively low and stable, the levels of NAs increased for approximately seven years before steady-state conditions were reached. The striking difference between the two compound groups was primarily the consequence of efficient photodegradation of the NSAs. Peak NSA levels occurred in winter when the lake was covered by ice and thereby protected from sunlight degradation. At this site, the sum of NSAs and NAs was likely to remain below the
drinking water limit of 4 ng L-1, but only when “reheat” was applied at the capture plant. By using reheat, the flue gas will literally be reheated to gain higher elevation and thereby enhanced atmospheric dispersion.
A model uncertainty analysis was run to reveal that the most uncertain and influential process is the biodegradation of the NAs. Since the NAs are not photodegraded, biodegradation is a potential important degradation pathway that can take place in soils, water, and sediment. To improve the accuracy of the simulation, future work should implement the atmospheric model described above as well as improving the knowledge on the potential for biodegradation of the NAs.
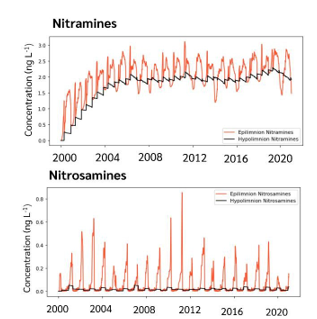
Figure 2: Modelled time series (2000-2020) of nitramines (NA, top) and nitrosamines (NSA, bottom) concentrations in the top (epilimnion) and bottom (hypolimnion) layers of the lake. Adapted from [2].
4.2 Case study: groundwater
A groundwater basin will receive NSAs and NAs mainly from soil-water percolation. One major concern is the lack of photodegradation taking place once the NSAs have reached the basin. This may lead to elevated levels of NSAs. At a case study site, two different groundwater basins were in close vicinity to a planned full-scale CO2 capture plant [29]. The two basins differed with respect to water residence time, water volume, and depth of the aquifers.
At both two sites, the levels of NSAs and NAs increased for an extended period (10-25 y) until steady state conditions were reached. The duration of this initial phase was dependent on the water residence time. A shorter water residence time translated into a faster increase in the NSA and NA levels. Since photodegradation was not in effect in the groundwater basin, the role of biodegradation was even more important, and also for the NSAs. Again, the process of biodegradation was found to have a large impact on the resulting NSA and NA concentrations, and at the same time being associated with a relatively high uncertainty.
To illustrate the importance of biodegradation, Figure 3 shows the continued increase in NSA and NA levels in the groundwater basin when no biodegradation is allowed to take place. For this site, the drinking water limit was exceeded after 25 years. It is important to note that this scenario without any biodegradation is a very unlikely scenario.
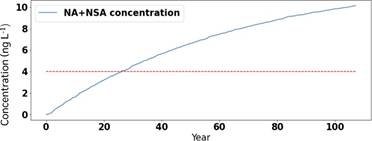
Figure 3: Modelled concentrations for the sum of NSAs and NAs (blue line) in a groundwater basin over time with no biodegradation in the groundwater. The red dotted line indicates the Norwegian recommended drinking water safety limit.
5. Experimental work to improve the catchment model (NA biodegradability)
Biodegradation has been identified as a key process associated with high uncertainty [2, 29]. Relevant NAs have simple molecular structures with a high N:C ratio, which are conceptually positively linked to biodegradability [30]. Moreover, a low microbial toxicity has been demonstrated [14, 31]. Two different experimental approaches have been suggested to improve the knowledge base and to produce new biodegradation rates to be used in the model.
The first approach is to further explore the biodegradability of the NAs in the water phase. The previous study on biodegradation of NAs in lake waters[14] showed that the potential for biodegradation varied with chemical structure of the nitramines, from no degradation to a slow degradation. And that for those that degraded, the slow biodegradation was mostly a result from a long lag-phase, which is the time needed by the microbes to adapt to a new type of substrate. Building on this, further assessments should test the effect of
1) exposing the microbial community to NAs over time,
2) mixing the different nitramines in the same test set-up,
3) varying the nutrient composition, and
4) varying the source and composition of the microbial inoculum.
The second approach is to assess the possibility for the NAs to be biodegraded in soil. In the catchment situation, soils typically constitute a large fraction of the area that the NAs must pass through to reach groundwater or a lake. In soils, there is typically a higher species diversity and number of microbes than in lake water. To our knowledge, this has not previously been investigated.
6. Open access modelling tool
To make the advanced atmospheric-catchment model available to the stakeholders, a user-friendly web-interface can be developed. Such a tool can aid authorities and the industry with the regulation and reduction measures, respectively, of the amine emissions. The website will visualise, in a simplified manner, the complex estimates and considerations taken by the model. The user can easily adjust settings on a selected range of input variables, such as CO2 capture operational conditions, to see the instant effect on NSA and NA levels in a nearby water compartment. All proprietary information will be anonymized and different chemical scenarios (e.g., amines with different atmospheric lifetimes and NSA/NA yields) will be presented.
7. Conclusions
Given the current political push to implement CO2 capture, there is an urgent need to create the tools and knowledge needed to support safe and knowledge-based implementation without compromising on the cost-efficiency. For the amine-technology, we here present a roadmap based on improving the simulations from measured amine emissions to future levels of NSAs and NAs at a nearby drinking water compartment. This will be done by adopting a fundamental new atmospheric model that will be validated using in-situ measurements. Subsequently, the atmospheric model will be combined with a catchment model to be able to simulate the entire picture from plant amine emissions
to water NSA and NA levels, and to also assess the potential for accumulation of NSAs and NAs with time. To further improve the accuracy of the model, the biodegradability of the NAs will be experimentally determined under realistic lake and soil conditions. Finally, to make the advanced developments available to the stakeholders, a user-friendly web-interface will be developed. With the tool, the instant effect from e.g. amine emission mitigation options can be visualized.
Acknowledgements
The work here presented is part of the ongoing project, Future drinking water levels of nitrosamines and nitramines near a CO2 capture plant (FuNitr) which has been funded by the Research Council of Norway (#336357), under the CLIMIT-programme.
References
[1] C.J. Nielsen, H. Herrmann, C. Weller, Atmospheric chemistry and environmental impact of the use of amines in carbon capture and storage (CCS), Chemical Society Reviews, 41 (2012) 6684-6704. http://dx.doi.org/10.1039/C2CS35059A.
[2] M.D. Norling, F. Clayer, C.B. Gundersen, Levels of nitramines and nitrosamines in lake drinking water close to a CO2 capture plant: A modelling perspective, Environmental Research, 212 (2022) 113581. https://doi.org/10.1016/j.envres.2022.113581.
[3] Global CCS Institute, Global status of CCS 2023. Scaling up through 2030, 2023, https://status23.globalccsinstitute.com/.
[4] European commission, Towards an ambitious industrial carbon management for the EU, European Commission, Directorate- General for Energy, 2024, https://eur-lex.europa.eu/legal-content/EN/TXT/?uri=COM:2024:62:FIN.
[5] J.N. Pitts, Jr., D. Grosjean, K. Van Cauwenberghe, J.P. Schmid, D.R. Fitz, Photooxidation of aliphatic amines under simulated atmospheric conditions: formation of nitrosamines, nitramines, amides, and photochemical oxidant, Environmental Science & Technology, 12 (1978) 946-953. https://doi.org/10.1021/es60144a009.
[6] C. Svendsen, M. Låg, B. Lindeman, M. Andreassen, B. Granum, New knowledge on health effects of amines and their derivatives associated with CO2 capture, Norwegian Institute of Public Health (NIPH), Oslo, Norway, 2024, https://www.miljodirektoratet.no/publikasjoner/2024/januar-2024/new-knowledge-on-health-effects-co2-capture/.
[7] J. Nawrocki, P. Andrzejewski, Nitrosamines and water, J Hazard Mater, 189 (2011) 1-18. https://doi.10.1016/j.jhazmat.2011.02.005.
[8] California Water Boards, Nitrosamines, State Water Resources Control Board, Division of Drinking Water, Regulatory Development Unit, Sacramento, California, USA, 2024, https://www.waterboards.ca.gov/drinking_water/certlic/drinkingwater/NDMA.html.
[9] N.R. Choi, S. Park, S. Ju, Y.B. Lim, J.Y. Lee, E. Kim, S. Kim, H.J. Shin, Y.P. Kim, Contribution of liquid water content enhancing aqueous phase reaction forming ambient particulate nitrosamines, Environmental Pollution, 303 (2022) 119142. https://doi.org/10.1016/j.envpol.2022.119142.
[10] N. Dai, A.D. Shah, L. Hu, M.J. Plewa, B. McKague, W.A. Mitch, Measurement of nitrosamine and nitramine formation from NOx reactions with amines during amine-based carbon dioxide capture for postcombustion carbon sequestration, Environmental Science & Technology, 46 (2012) 9793-9801. https://doi.org/10.1021/es301867b.
[11] A. Afzal, J. Kang, B.-M. Choi, H.-J. Lim, Degradation and fate of N-nitrosamines in water by UV photolysis, International Journal of Greenhouse Gas Control, 52 (2016) 44-51. https://doi.org/10.1016/j.ijggc.2016.06.009.
[12] M.H. Plumlee, M. Reinhard, Photochemical attenuation of N-nitrosodimethylamine (NDMA) and other nitrosamines in surface water, Environmental Science & Technology, 41 (2007) 6170-6176. 10.1021/es070818l, https://doi.org/10.1021/es070818l.
[13] L. Sørensen, K. Zahlsen, A. Hyldbakk, E.F.d. Silva, A.M. Booth, Photodegradation in natural waters of nitrosamines and nitramines derived from CO2 capture plant operation, International Journal of Greenhouse Gas Control, 32 (2015) 106-114. https://doi.org/10.1016/j.ijggc.2014.11.004.
[14] O.G. Brakstad, L. Sørensen, K. Zahlsen, K. Bonaunet, A. Hyldbakk, A.M. Booth, Biotransformation in water and soil of nitrosamines and nitramines potentially generated from amine-based CO2 capture technology, International Journal of Greenhouse Gas Control, 70 (2018) 157-163. https://doi.org/10.1016/j.ijggc.2018.01.021.
[15] M. Karl, N. Castell, D. Simpson, S. Solberg, J. Starrfelt, T. Svendby, S.E. Walker, R.F. Wright, Uncertainties in assessing the environmental impact of amine emissions from a CO2 capture plant, Atmospheric Chemistry and Physics, 14 (2014) 8533- 8557. https://doi.10.5194/acp-14-8533-2014, https://doi.10.5194/acp-14-8533-2014.
[16] S. Lindahl, C.B. Gundersen, E. Lundanes, A review of available analytical technologies for qualitative and quantitative determination of nitramines, Environmental Science: Processes & Impacts, 16 (2014) 1825-1840. https://doi.10.1039/c4em00095a.
[17] W. Tan, L. Zhu, T. Mikoviny, C.J. Nielsen, Y. Tang, A. Wisthaler, P. Eichler, M. Müller, B. D’Anna, N.J. Farren, J.F. Hamilton, J.B.C. Pettersson, M. Hallquist, S. Antonsen, Y. Stenstrøm, Atmospheric chemistry of 2-amino-2-methyl-1-propanol: A theoretical and experimental study of the OH-initiated degradation under simulated atmospheric conditions, The Journal of Physical Chemistry A, 125 (2021) 7502-7519. https://doi.org/10.1021/acs.jpca.1c04898.
[18] W. Tan, L. Zhu, T. Mikoviny, C.J. Nielsen, A. Wisthaler, B. D’Anna, S. Antonsen, Y. Stenstrøm, N.J. Farren, J.F. Hamilton, G.A. Boustead, A.D. Brennan, T. Ingham, D.E. Heard, Experimental and theoretical study of the OH-initiated degradation of piperazine under simulated atmospheric conditions, The Journal of Physical Chemistry A, 125 (2021) 411-422. https://doi.org/10.1021/acs.jpca.0c10223, https://doi.org/10.1021/acs.jpca.0c10223.
[19] D. Thomson, J. Wilson, History of Lagrangian stochastic models for turbulent dispersion, 2012, pp. 19-36 https://doi.org.10.1029/2012GM001238.
[20] M. Cassiani, A. Stohl, J. Brioude, Lagrangian stochastic modelling of dispersion in the convective boundary layer with skewed turbulence conditions and a vertical density gradient: Formulation and implementation in the FLEXPART model, Boundary-Layer Meteorology, 154 (2015) 367-390. https://doi.org/10.1007/s10546-014-9976-5.
[21] M. Cassiani, P. Franzese, U. Giostra, A PDF micromixing model of dispersion for atmospheric flow. Part 1: development of the model, application to homogeneous turbulence and to neutral boundary layer, Atmospheric Environment, 39 (2005) 1457- 1469. https://10.1016/j.atmoshere.2004.11.020.
[22] R. Fox, Computational Models for Turbulent Reacting Flow, 2003.
[23] M. Cassiani, M.B. Bertagni, M. Marro, P. Salizzoni, Concentration fluctuations from localized atmospheric releases, Boundary-Layer Meteorology, 177 (2020) 461-510. https://doi.org/10.1007/s10546-020-00547-4.
[24] W. Tan, L. Zhu, T. Mikoviny, C.J. Nielsen, A. Wisthaler, P. Eichler, M. Müller, B. D’Anna, N.J. Farren, J.F. Hamilton, J.B.C. Pettersson, M. Hallquist, S. Antonsen, Y. Stenstrøm, Theoretical and experimental study on the reaction of tert-butylamine with OH radicals in the atmosphere, The Journal of Physical Chemistry A, 122 (2018) 4470-4480. https://doi.org/10.1021/acs.jpca.8b01862.
[25] M. Luria, R.J. Valente, R.L. Tanner, N.V. Gillani, R.E. Imhoff, S. F. Mueller, K.J. Olszyna, J.F. Meagher, The evolution of photochemical smog in a power plant plume, Atmospheric Environment, 33 (1999) 3023-3036. https://doi.org/10.1016/S1352- 2310(99)00072-2.
[26] M. Luria, R.L. Tanner, R.E. Imhoff, R.J. Valente, E.M. Bailey, S.F. Mueller, Influence of natural hydrocarbons on ozone formation in an isolated power plant plume, Journal of Geophysical Research: Atmospheres, 105 (2000) 9177-9188. https://doi.org/10.1029/1999JD901018.
[27] L. Nizzetto, D. Butterfield, M. Futter, Y. Lin, I. Allan, T. Larssen, Assessment of contaminant fate in catchments using a novel integrated hydrobiogeochemical-multimedia fate model, Science of the Total Environment, 544 (2016) 553-563. https://doi.10.1016/j.scitotenv.2015.11.087.
[28] M.N. Futter, M.A. Erlandsson, D. Butterfield, P.G. Whitehead, S.K. Oni, A.J. Wade, PERSiST: a flexible rainfall-runoff modelling toolkit for use with the INCA family of models, Hydrology and Earth System Sciences, 18 (2014) 855-873. https://doi.10.5194/hess-18-855-2014.
[29] C.B. Gundersen, M.D. Norling, A.S. Gragne, Modelling future levels of nitrosamines and nitramines in a groundwater compartment close to a CO2 capture facility, Norwegian institute for water research (NIVA), 2024, https://niva.brage.unit.no/niva-xmlui/handle/11250/3160694.
[30] K. Kalbitz, J. Schmerwitz, D. Schwesig, E. Matzner, Biodegradation of soil-derived dissolved organic matter as related to its properties, Geoderma, 113 (2003) 273-291. https://doi.org/10.1016/S0016-7061(02)00365-8.
[31] C.B. Gundersen, T. Andersen, S. Lindahl, D. Linke, R.D. Vogt, Bacterial response from exposure to selected aliphatic nitramines, Energy Procedia, 63 (2014) 791-800. https://doi.org/10.1016/j.egypro.2014.11.089, https://www.sciencedirect.com/science/article/pii/S1876610214019043.