
3. Design, Development, and Validation of Analytical Methods for the Measurement of Degradation Products of CESAR1 Solvent by LC-MS/MS (2024)
Zeeshan Muhammada, Fred Rugenyia,Matthew Campbella, Muhammad Ismail Shaha, Bjørn Grungb
aTechnology Centre Mongstad
bUniversity of Bergen – Department of Chemistry

Abstract
The use of amine-based post-combustion carbon capture is an effective method for reducing carbon dioxide (CO2) emissions from specific sources. CESAR1, a blend of 2-amino-2-methyl-1-propanol (AMP) and piperazine (PZ) is recognized as a superior amine solvent for CO2 capture. It exhibits better performance than monoethanolamine (MEA) due to its enhanced solvent properties.1a-c However, the efficiency of the solvent is negatively impacted by degradation and the accumulation of degradation products, which affects the operation of the capture plant. Therefore, accurately assessing and identifying degradation products are crucial for managing solvent degradation.
This study aimed to develop and apply a quantitative liquid chromatography-tandem mass spectrometry method (LC- MS/MS) to analyse non-volatile degradation products in CESAR1 solvent. The ionization and source parameters of the mass spectrometer were optimized. Various columns and mobile phase combinations were tested, and sample preparation techniques were optimized using statistical approaches to ensure reliable and justifiable results. A porous graphitic carbon column successfully separated 1-(2-hydroxyethyl)piperazine (HEP), 1,4-bis(2- hydroxyethyl)piperazine (BHEP), 1-formylpiperazine (FPZ), mononitrosopiperazine (MNPZ), and 1- methylpiperazine (MPZ) from the main components of CESAR1. Furthermore, 4,4-dimethyl-oxazolidin-2-one (DMOZD), 2-oxopiperazine (OPZ), and 2,4-lutidine were effectively separated using a pentafluorophenylpropyl column with two different mobile phases. The method’s selectivity was confirmed, and the linearity (≥ 0.995) ranged from 5−5000ng per sample mass using a quadratic calibration curve. The methods exhibited good precision and accuracy within the expected concentration range of the mass fraction and achieved a validated detection limit of 10 ng. Parametric and non-parametric equivalence studies demonstrated that the developed methods were comparable to service provider methods for DMOZD, MNPZ, and OPZ. The methods were found suitable for determining both previously known and unknown degradation products in new, processed, and aged CESAR1 solvents.
Highlights
The methods are straightforward, reliable, and have been thoroughly validated in accordance with AOAC and European Community guidelines. They are suitable for evaluating fresh amine and process absorbent in order to monitor non-volatile organic solvent degradation products in CESAR1 solvent.
Keywords: Method development, LC-MS/MS, CESAR1, Solvent degradation. Corresponding author: email. muhammad.zeeshan@tcmda.com
1. Introduction
During the period from September 2019 to January 2020, the Technology Centre Mongstad (TCM) carried out an extensive test campaign focused on evaluating the performance of CESAR1 solvent as part of the ALIGN-CCUS project. CESAR1 is a unique blend consisting of aqueous 2-amino-2-methylpropan-1-ol (AMP) and piperazine (PZ) with amine concentrations of 27% and 13% by weight, respectively. This non-proprietary solvent was suggested by the IEAGHG as a potential benchmark due to its performance compared to the more widely used 30% monoethanolamine (MEA).1a-c The objective of the test campaign was to thoroughly investigate various aspects of the solvent’s performance, including its carbon capture rate, specific reboiler duty (SRD), emissions, health, safety, and environmental (HSE) considerations, operational challenges, as well as its thermal reclaiming and degradation products and rates.2-6 The findings of the test campaign indicated that CESAR1 demonstrated a notably high carbon capture rate, lower SRD, and higher emissions when compared to the 30%wt. MEA. Additionally, it showcased lower operational amine losses and acceptably low amine losses during reclaiming compared to the MEA counterpart. Further analysis of the solvent’s degradation products and rates unveiled the presence of both quantified and unquantified known and unknown degradation products. As a continuation of the study, TCM planned to delve deeper into the degradation of CESAR1. This involved the implementation of an advanced liquid chromatography-mass spectrometry (LC-MS/MS) instrument in order to better comprehend the characteristics of the solvent degradation. The resulting paper highlights the development and validation of new methods for analyzing non-volatile solvent degradation products (NVDPs) in CESAR1 within the TCM laboratory.6 The study presents a comprehensive overview of the identified CESAR1 degradation products, shedding light on their measurement, the experimental procedures conducted, and an in-depth analysis and discussion of the obtained results.
1.1 CESAR1 Degradation and measurement
In the process of degrading CESAR1, it is crucial to consider the degradation of the primary amine components. The key degradation products of PZ and AMP are outlined in the accompanying table.6-9
Table 1: Major PZ and AMP degradation products.
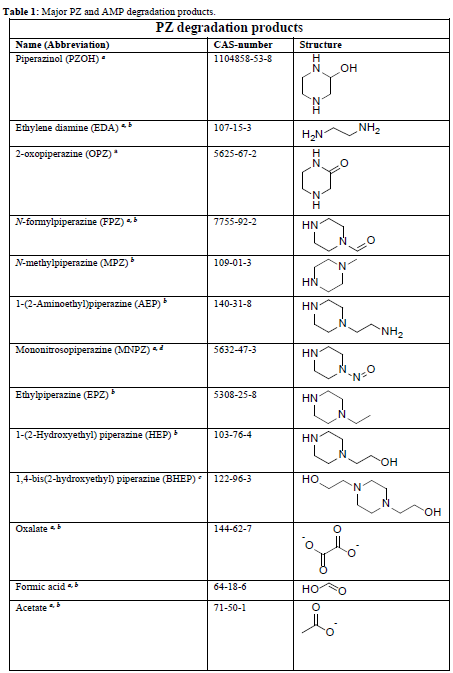
To measure organic acids and heat-stable salts, established techniques are utilized. However, the measurement of NVDPs using available chromatographic methods is still in the early stages of development.10-12 NVDPs, characterized by their low molecular weight, high volatility, high polarity, and high viscosity, are naturally basic and hydrophilic. Additionally, they exist in a solution with a high concentration of primary amines. These properties present significant challenges in terms of extraction and separation, and they can have a detrimental effect on general chromatographic materials.10
The measurement of NVDPs in PZ, AMP, and PZ/AMP blends was carried out using gas chromatography-mass spectrometry (GC-MS) and ion chromatography.8,9,12 However, these results were based on degradation under simulated conditions.13 Under operational conditions, results on the degradation products of MNPZ, DMOZD, OPZ, FPZ, EDA, and 2,4-lutidine were reported.6,14 Regrettably, there were no specifics provided regarding the analytical methods used. Overall, there is a dearth of information concerning measurement methods and result accuracy.11
2. Experimental
2.1 Apparatus
A liquid chromatography-triple quadrupole mass spectrometer (LC-MS/MS) was used for the analysis. This system consisted of a 1290 infinity II LC system with a 6-position/14-port valve multi-column thermostat coupled to a 6495C MS/MS with electrospray ionisation from Agilent Technologies (Santa Clara, CA, USA). Instrument control and data analysis were performed using Agilent MassHunter Workstation software. A Bransonic® Ultrasonic Bath 3800 (Brookfield, CT, USA) was employed as a water bath and for sonication and degassing of solvents and solvent mixtures. Mixing was conducted with a Lab Dancer Vortex Orbital Shaker from IKA-Werke (Staufen, Germany). pH measurements were carried out using a Metrohm (Herisau, Switzerland). Samples and reagents were weighed using a top-loading analytical balance, VWR LPG-4202i, from VWR International (Leuven, Belgium). Standards were weighed using a Sartorius MC 210 P from Sartorius (Göttingen, Germany). Adjustable pipettes from Thermo Fisher Scientific (Joensuu, Finland) were used to dispense volumes in the ranges 2-20 µL, 10-100 µL, and 100-1000 µL. Samples were filtered through 0.2 µm PTFE syringe filters from Agilent Technologies (Santa Clara, CA, USA) and processed in standard 15 mL centrifuge tubes. The samples were injected into standard 1.5 mL vials. Chromatographic separation was tested on various columns: Zorbax RRHD Eclipse Plus C18 (C18), 2.1 x 50 mm, 1.8 µm from Agilent Technologies (Santa Clara, CA, USA); Ascentis® Express C8 (C8), 4.6 x 150 mm, 2.7 µm; Discovery® HS F5 Pentafluorophenylpropyl (PFP), 2.1 x 150 mm, 3 µm; Ascentis® Express Phenyl-Hexyl (PH), 4.6 x 150 mm, 2.7 µm; Ascentis® Express ES-Cyano (CN), 4.6 x 100 mm, 2.7 µm; Ascentis® Express RP-Amide (RP-Amide), 4.6 x 50 mm,
2.7 µm from Merck KGaA (Darmstadt, Germany); and Hypercarb™ Porous Graphitic Carbon (PGC), 4.6 x 150 mm, 5 µm from Thermo Scientific.
2.2 Chemicals and Reagents
Acetonitrile and methanol of LC-MS quality were purchased from Merck KGaA (Darmstadt, Germany). Deionised water (18.2 MΩ·cm) was prepared in the laboratory using a Millipore Milli-Q system (Darmstadt, Germany). Ammonium formate and ammonium acetate of LC-MS quality were obtained from Sigma Aldrich (St. Louis, MO, USA), and formic acid was sourced from VWR International (Leuven, Belgium). Neat standards of 99.7% OPZ, 99.9% MPZ, and 99.6% BHEP were acquired from Sigma Aldrich (St. Louis, MO, USA). FPZ at 99.1% was purchased from Tokyo Chemical Industry (Tokyo, Japan), 97.0% DMOZD from Apollo Scientific (Stockport, UK), 99.8% HEP from Alfa Aesar (Lancashire, UK), 99.9% MNPZ from Chiron AS (Trondheim, Norway), 99.6% EDA from Merck KGaA (Darmstadt, Germany), and 99.4% 2,4-lutidine from Thermo Fisher Scientific (Geel, Belgium). Stock solutions of 10,000 µg·mL⁻¹ were prepared in various solvents and working standard mixtures of 1,000 µg·mL⁻¹ and 100 µg·mL⁻¹ were prepared in acetonitrile. Deuterated MNPZ (MNPZ-d8) with a purity of 95.0% was purchased from Chiron AS (Trondheim, Norway) at 100 µg/mL to be used as an internal standard. It was diluted to a working standard solution of 1 µg·mL⁻¹ in acetonitrile. A blank solution of CESAR1 solvent was prepared by weighing approximately 130 g of 100% purity PZ from Sigma Aldrich (St. Louis, MO, USA) and approximately 270 g of 99.6% purity AMP from Merck KGaA (Darmstadt, Germany) into a 1000 mL HDPE volumetric flask. Deionised water was added to the mark after all the salt had dissolved.
2.3 Method development, validation and application
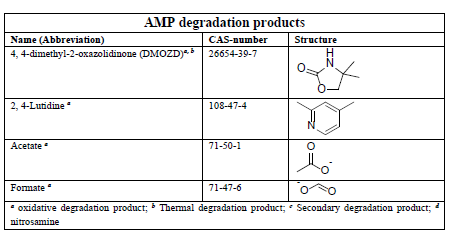
The general scheme in Figure 1 was used for the development, validation and application of the method.
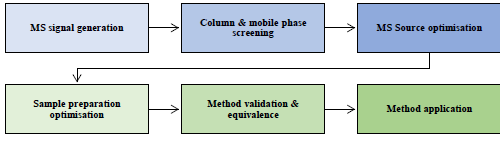
Figure 1: General method development process applied.
2.4 MS signal generation
For the analysis using the Agilent MassHunter Optimizer software, pure standards were diluted with a mobile phase composed of 0.1% formic acid in a 50:50 mixture of water and methanol to achieve a concentration of 0.1 µg·mL-1. Each standard was then injected into the LC-MS system using flow injection and a C18 column via autosampler. The collision energy (CE) was scanned from 0 to 80 V and the scanned precursor ions were [+H] and [+NH4]. A maximum of four product ions was determined with a low mass cut-off of 30 m/z. The optimization conditions included capillary and nozzle voltages of 500 V and 300 V, a drying gas flow of 15 L·min-1 at 230 °C, a sheath gas flow of 8 L·min-1 at 400 °C, and a nebulizer pressure of 15 Psi with a constant fragmentor voltage of 166 V.
2.5 Column and mobile phase screening
In order to select the most suitable column and mobile phase for our analysis, we conducted a thorough screening process. We prepared each standard at a concentration of 0.1 µg·mL-1 and injected them into various RP columns (C18, C8, PGC, PFP, PH, RP-Amide, and CN) using different compositions and ratios of the mobile phase. We tested aqueous solutions of water, 0.1% formic acid in water, 6 mM and 12 mM ammonium acetate, and ammonium formate in different ratios to the organic solvent. Additionally, we used methanol, 0.1% formic acid in methanol, and acetonitrile as the organic composition of the mobile phase in isocratic mode. The retention factor (k) was calculated with a target value between 1-5. We also tested the OH5 and CN columns in HILIC mode with acetonitrile as the organic phase. The final selection of the column and mobile phase was based on achieving acceptable retention factors for a large number of analytes in a single method with optimal selectivity between the analytes and the main amines.
2.6 MS source optimisation
Once the column and mobile phase were selected, we used them as the base method to create a dynamic multiple- reaction monitoring method with one transition per molecule. The Agilent MassHunter Workstation Source Optimiser was then used to optimize ion funnel voltages, gas temperatures and flows, nebulizer pressure, capillary voltage, and nozzle voltage using the “One Factor at a Time” (OFAT) approach.
2.7 Sample Preparation Optimization
In addition, we utilized a Resolution III screening design to optimize the sample preparation process. This involved investigating the influence of different factors and their interactions on the quantification of the sample. We utilized a screening design with seven factors and two levels, generated using Statgraphics® Centurion 18. The peak areas of the prepared sample were selected as the experimental response with the aim of maximization. We also performed a thorough check for the identification of degradation products and confirmation of the results by checking the blank response to detect the formation of artefacts, ensuring a difference of ± 0.1 min between the retention time of the degradation product in the sample and the standard, and verifying the presence of two fragment ions and an ion ratio within ± 30%. Table 2 shows the parameters analyzed and their ranges. Identified significant variables were later analyzed one factor at a time.15,16
Table 2: Design parameters of the factors that could influence the instrumental determination of NVDP.
| Experimental factor | Units | Variable type | Low factor level (-) | High factor level (+) |
| Mass of sample | g | continuous | 0.25 | 0.5 |
| Extraction solvent | – | categorical | methanol | water |
| pH of extraction solvent | – | continuous | 3 | 7 |
| Extraction solvent ratio | – | continuous | 1 | 10 |
| Vortex time | minutes | continuous | 1 | 5 |
| Injection solvent | – | categorical | methanol | aqueous mobile phase |
| Column temperature | °C | continuous | 25 | 35 |
2.8 Sample preparation
The samples, stored in 30 mL HDPE bottles, underwent a meticulous preparation process. Initially, the samples were equilibrated in a water bath at 45°C for thirty minutes, with regular shaking every ten minutes to ensure thorough mixing and dissolution of any precipitated PZ.5 Subsequently, the samples were allowed to equilibrate at room temperature for one hour and then mixed ten times by inverting to achieve homogeneity. The homogenized samples were then filtered through a 0.2 µm PTFE syringe filter, effectively removing any suspended particles in the solution.
2.9 Extraction and Partitioning
To extract the analytical portion, a 15 mL centrifuge tube was utilized as the container. The extraction solvent was carefully added to the analytical portion, and the container was sealed with a cap. The vortex was employed to shake the mixture, with specific attention given to the extraction solvent, the sample-to-solvent ratio, and the shaking time, which were all meticulously analyzed.11
2.10 Calibration solutions
Prior to calibration, individual standard solutions (Ri) were prepared in six replicates at 0.1 µg·mL-1 and compared with the detector response of the same standards in a mixed solution (Rm) at the same concentration. The comparison determines whether the detector response of the individual standards is affected when the standards are mixed for a multi-standard calibration. The effect of mixing standards on the calibration (EMC) was calculated using the adopted relationship [EMC= ((𝑅𝑅𝑚𝑚⁄𝑅𝑅𝑖𝑖) − 1) × 100)].16 The effect is considered significant for a standard if it leads to a deviation of more than ±10 %. Matrix effects (ME) were compared by comparing the slope of the prepared calibration standards in the blank CESAR1 solvent (matrix-matched slope, Sm) and in the solvent (Ss). The effect on the signal compared by the relationship [ME= ((𝑆𝑆𝑚𝑚⁄𝑆𝑆𝑖𝑖 ) − 1) × 100)]. The effects were considered significant if they were greater than ±20 %16. The linearity and range were determined from 0- 150 % of the highest MNPZ concentration in the ALIGN-CCUS campaign, 5- 5000 ng·mL-1.17
2.11 Fortifications
For recovery studies, a precise volume of standard solutions at the desired concentration was added to a weighed CESAR1 blank sample. The fortified sample underwent thorough mixing for 30 seconds using a vortex. Subsequently, the sample was allowed to stand for approximately five minutes to ensure even distribution of degradation products and their interaction with the matrix.
2.12 LC-MS analysis
The LC-MS analysis involved the use of a carefully selected column and optimized source conditions. The flow rate and injection volume were specifically tailored to the column dimensions and analyte response. To ensure accurate results, time segments were employed to divert highly concentrated main amines away from the mass spectrometer. Additionally, an isotopically labelled MNPZ-d8 was used as an injection internal standard (I-IS) at a concentration of 30 ng·mL-1 in the calibration standards and the final extract of each sample. The I-IS played a crucial role in minimizing biases resulting from injection errors and matrix effects.16
To quantify and report an identified degradation product in the sample, the following criteria needed to be met:15,16
- The retention time should differ by no more than ± 0.1 minutes from that of a standard with a similar concentration.
- Two transitions (qualifier and quantifier product ions) were required, and the ratio of the transitions needed to fall within ± 30%.
- The recovery result of the fortified samples had to be within the expected range based on concentration.
- The linearity parameter R2 needed to be greater than or equal to 0.995.
2.13 Method validation, equivalence and application
The method validation process involved thorough examination of various parameters to ensure the reliability and accuracy of the final sample preparation method. This included evaluating selectivity, linearity, limit of detection (LOD), limit of quantification (LOQ), accuracy, repeatability, and measurement uncertainty.15,16,18 Selectivity was assessed by analyzing the response of target molecules in blank samples and specific qualifier and quantifier ions. The LOD and LOQ were determined from the calibration curve parameters using the three lowest calibration levels.19 The LOQ was set as the lowest fortification level that met the performance criteria of the method. Accuracy was evaluated through recovery and expressed as relative bias, while repeatability was assessed as relative standard deviation. Measurement uncertainty was determined from the validation data using the bias and repeatability components.15,16,18
Furthermore, method equivalence was established by comparing TCM LC-MS results with those obtained by SINTEF industrial laboratories during the 2019/2020 campaign. Hypothesis tests were conducted using a t-test to compare mean values, regression line analysis to cover the linear range, and the non-parametric Wilcoxon signed-rank test to validate the parametric assumption of previous tests. The results were used to assess the stability of degradation products during storage and, if stable, to perform method equivalence studies. Finally, the validated method was applied to real samples from the 2019/2020 ALIGN-CCUS campaign, which were stored at 5°C in high-density polyethylene (HDPE) containers.20,15
3 Results and discussion
3.1 MS signal optimization
In the positive ionization mode, all molecules were ionized with the protonated molecule [M+H]+. The optimization process automatically adjusted the corresponding transitions and fine-tuned the collision energies, maintaining a constant fragmentor voltage of 166 V. We used the multiple reaction monitoring (MRM) transition with the highest abundance for quantification and the second highest for qualification. In cases where two transitions had comparable abundance, we selected the transition with the higher molecular mass to minimize spectral and matrix-related interference effects. The detailed results can be found in Table 3. Given the close pKa values of NVDPs and the main amines, as well as the high concentration of the main amines in the samples, we optimized PZ and AMP to ensure that the selectivity experiments were conducted at a controlled concentration. This approach was adopted to manage the separation, prevent detector saturation, and minimize alterations to the column chemistry.
Table 3: pKa, Transitions and corresponding collision energies (CE) at a fragmentor voltage of 166 V selected for analysing NVDPs in CESAR1 solvent using ESI in the LC-MS/MS system.
| Compound | pKa | precursor ion | quantifier ion (CEa) | qualifier ion (CEa) |
| FPZ | 8.58 | 115.1 | 87.2 (8) | 44.4 (24) |
| DMOZD | 12.91 | 116.07 | 72.2 (12) | 55.2 (16) |
| OPZ | 15.47 | 101.07 | 72.2 (12) | 44.3 (20) |
| MPZ | 4.94/9.09 | 101.11 | 58.2 (24) | 44.3 (24) |
| BHEP | 14.96 | 175.15 | 88.1 (20) | 45.3 (36) |
| HEP | 14.66 | 131.12 | 88.1 (16) | 44.3 (32) |
| MNPZ | 8.07 | 116.08 | 86.2 (4) | 56.2 (20) |
| EDA | 10.71 | 61.08 | 44.3 (8) | 29.3 (76) |
| 2,4-Lutidine | 6.99 | 108.08 | 92.1 (24) | 65.2 (28) |
| PZb | 9.73 | 87.1 | 44.3 (20) | 30.3 (60) |
| AMPb | 12.91/9.7 | 90.1 | 55.2 (16) | 45.3 (24) |
| MNPZ-d8 | ̶ | 124.13 | 94.2 (4) | 62.2 (24) |
a is the Collision Energy associated with the ion in volts.
b These were only used for the preliminary selectivity studies.
3.2 Column and mobile phase screening
Among the columns tested, PGC and PFP showed the best selectivity for NVDPs compared to the main amines. C8, C18, CN, and PH were only able to retain DMOZD using a low solvent strength mobile phase. It is possible that “dewetting” of the stationary phase occurred. The elution order and selectivity are presented in Figure 2.21
The PGC column, designated as method one, showed adequate retention of most analytes at a pH of about seven. There was adequate separation with NVDP eluting at retention times between the two main amines using a mobile phase of 12 mM ammonium acetate: methanol (50:50 % v/v) in isocratic mode. HEP, BHEP, FPZ, MNPZ, and MPZ eluted between the two main amines of AMP and PZ at an injection volume of 2.5 µL, a flow rate of 1.0 mL·min-1
and a run time of 27 minutes. The polarizable PGC surface could contribute to charge induction and retention of polar compounds, while the flat surface could be partially responsible for the resolution of closely related structures. Although OPZ, EDA, and DMOZD were retained by PGC, OPZ coeluted with AMP, while EDA coeluted with PZ, resulting in interfering matrix effects. Spectral interference occurred between DMOZD and MNPZ so they could not be determined by one method. The PGC column did not retain 2,4-lutidine.22,23 On the other hand, PFP showed controlled retention and different selectivity when the composition of the mobile phase was systematically changed. At a pH of about seven, OPZ and DMOZD eluted earlier than a non-separated peak of AMP and PZ when 12 mM ammonium acetate: methanol (50:50 % v/v) was used as the mobile phase in isocratic elution. An injection volume of 5.0 µL, a flow rate of 0.3 mL·min-1 and a run time of 15 minutes were used. This was referred to as method two. This suitability was chosen because in addition to the spectral interference between DMOZD and MNPZ, MNPZ and EDA were also coeluted with PZ, resulting in matrix interference. The elution order and separation can be explained by the predominant ion-exchange retention mechanism of the basic analytes, while non-ionic retention mechanisms could explain the significant selectivity differences between the analytes.24
At a pH of about seven, neither PGC nor PFP columns retained 2,4-lutidine. This could perhaps be due to its lower pKa value (6.99), so that it was in a non-ionised form. This could mean that the polarisability on the PGC surface was no longer present and the ion exchange mechanisms prevalent in the PFP phase are ineffective. To overcome this, method three was tested in which 2,4-lutidine was eluted after the main amines of AMP and PZ, respectively, at a pH of approximately three. The separation was performed using the PFP phase and a mobile phase consisting of 0.1 % formic acid in water: methanol (75:25 % v/v) in isocratic mode. An injection volume of 2.0 µL, a flow rate of 0.3 mL·min-1 and a run time of 15 minutes were used. This pH was lower than the pKa of 2,4-lutidine and was therefore ionised, allowing the use of the ion-exchange retention mechanism of the PFP phase. At this pH, EDA coeluted with PZ, while only FPZ and DMOZD were retained by the PGC phase. The coelution of PZ and EDA could be because the two nitrogen atoms are the predominant active sites in EDA and there are no other predominant analyte-column interactions.21
Figure 2: Elution and retention of degradation products in relation to the main amines. The blue highlight shows the elution zone of NVDP of interest. The three methods showed different retentions for a) HEP, BHEP, FPZ, MNPZ and MPZ, all eluted between AMP and PZ in method one, using Hypercarb™ PGC (4.6 × 150 mm, 3 µm), b) OPZ and DMOZD, which were eluted in the second method using Discovery® HS F5 PFP (2.1 × 150 mm, 3 µm) and c) 2,4-lutidine, which was eluted after the AMP and PZ peaks using Discovery® HS F5 PFP (2.1 × 150 mm, 3 µm). In the final dMRM methods, the main amines were diverted to waste to avoid saturation of the detector.
3.3 MS source optimisation
The performance of a mass spectrometer (MS) can be significantly impacted by the efficiency of ion transmission from the source to the MS, which in turn affects the sensitivity and signal intensity of different molecules. Various factors come into play in optimizing this process. For instance, the nebulizer pressure, temperature, and flow rate of the drying gas and sheath gas are influenced by the flow rate of the liquid chromatography (LC) system. Additionally, the ion funnel voltage, capillary voltage, sheath gas temperature, and nozzle voltage are dependent on the specific molecular properties. For more detailed information, please refer to Table 4 for the results.
Table 4: Optimised MS source conditions for the analysis of NVDPs in CESAR1 solvent.
| Parameter | Method one | result Method two | Method three |
| HPRF a voltage (V) | 130 | 130 | 210 |
| LPRF b voltage (V) | 40 | 60 | 60 |
| Sheath gas temperature (°C) | 400 | 400 | 400 |
| Sheath gas flow (Litres/ min) | 12 | 10 | 12 |
| Gas temperature (°C) | 230 | 170 | 110 |
| Gas flow (Litres/ min) | 17 | 13 | 11 |
| Nebulizer (psi) | 40 | 60 | 20 |
| Capillary voltage (V) | 2000 | 2000 | 1000 |
| Nozzle voltage (V) | 500 | 0 | 0 |
a High-pressure Ion funnel radio frequency.
b Low-pressure Ion funnel radio frequency.
3.4 Sample Preparation Optimization
When the dilution factor was appropriately scaled, the sample size did not significantly affect the quantification of NVDPs. However, a higher sample-to-solvent ratio seemed beneficial, possibly due to the larger volume available for distribution. At a dilution factor of 1000, the extraction of a 0.5 g sample in 5 mL solvent (1:10 ratio) and dilution to 1000 µL in vials (1:100 ratio) was found to be better than the extraction of 0.5 g in 0.5 mL solvent (1:1 ratio) and dilution to 1000 µL in vials (1:1000 ratio).
NVDPs extraction was tested at one, three, five, seven, and ten minutes of shaking with a vortex. The concentration of MNPZ, MPZ, and FPZ peaked at three minutes (Figure 3). Therefore, four minutes was set as the standard extraction time for all methods. Although initial analysis suggested that the low pH (about three) of the extraction solvent and methanol was significant, further evaluation indicated that the high observed response was due to the formation of artefacts of FPZ, MPZ, and MNPZ.
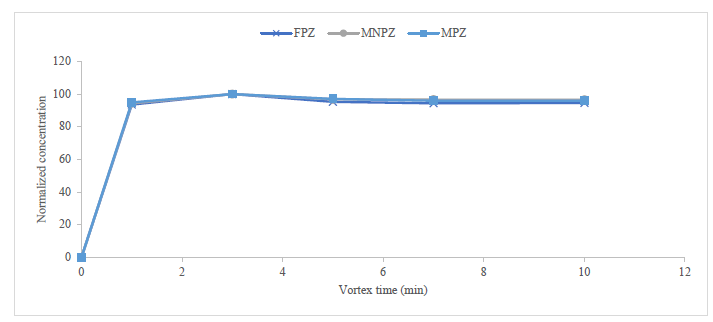
Figure 3: Influence of vortex time on the amount of degradation product determined. The normalised concentration is plotted against the vortex time to eliminate the influence of the actual concentration value.
At a low extraction pH, the high added concentration of formic acid additive could have led to the formation of FPZ.6,14 The presence of MNPZ could be attributed to nitrosation when an acidified extraction solvent was used.9 This occurrence was not observed when the pH of the aqueous injection solution was adjusted to around five. The use of methanol and acidified methanol for extraction may have led to the formation of MPZ and MNPZ artefacts through alkylation25,26 potentially OH-initiated nitrosation.27 Extraction with water without pH adjustment was standardized for all methods. To preserve the integrity of the silicate-based PFP column, the pH of the injection solution was adjusted to around five using 0.015% formic acid for methods one and two. In method three, 0.1% formic acid was adequate to achieve a final pH of approximately five, which was below the pKa of 2,4-lutidine.
These measures ensured that the pH of the injection solution remained within the operational limits of the silica-based PFP phase, preventing the formation of artefacts. Matching the mobile phase and injection solution guaranteed that the methods produced good and acceptable peaks.28,29 Column temperature did not significantly affect the quantified amount of degradation products. However, higher temperatures led to unacceptable retention times concerning the void volume for early eluting degradation products.15 The column temperature was maintained at 25 ±2°C. Table 5 details the final method protocol used during method validation and application.
Table 5: Method protocol for the measurement of NVDPs In CESAR1 solvent.
| Step | Procedure |
| 0 | Place the samples in a liquid water bath at 45 °C for 30 minutes and shake them by hand every 10 minutes. Allow the samples to equilibrate for one hour at room temperature. Homogenise the sample by inverting 10 times. |
| 1 | Filter sample through 0.2 µm pore size and transfer 0.5 g of an analytical portion into a 15 mL centrifuge tube. |
| 2 | Add 4.5 mL of deionised water. |
| 3 | Shake by vortex for four minutes. |
| 4 | For methods one and two, take 10 µL of the sample and add it to a vial containing 960 µL of diluent (12 mM ammonium acetate with 0.015% formic acid) and 30 µL of the IS. Inject into the LC−MS module. For method three, take 10 µL of the sample and add it to a vial containing 960 µL of diluent (0.1% formic acid: methanol 75:25% v/v) and 30 µL of the IS. Inject into the LC−MS module. |
3.5 Method validation
The validation process involved testing all molecules at three different concentration levels: the target LOQ level of 10 ug.Kg-1, mid-level, and high-level concentrations. However, MNPZ was an exception as it was only validated at 100 ug.Kg-1 due to being purchased pre-diluted at a low concentration. The accuracy, repeatability, and expanded uncertainty assessments demonstrate that the method of analysis is reliable and meets the acceptable guidelines as outlined in the references.15-18,30 For detailed results of the validation, please refer to Table 6 below.
Table 6: Summary of the method validation results for the analysis of NVDPs in CESAR1 solvent using LC-MS/MS.
| Degradation compound | Instrumental limits | Validation level | Accuracy | Repeatability | Expanded uncertainty | |
| LOD (ug·Kg-1) | LOQ (ug·Kg-1) | Concentration (ug·Kg-1) a | Relative bias (%) | Relative standard deviation (%) | U (K=2) (%) | |
| FPZ | 3.36 | 10.07 | 10 | -1.70 | 10.56 | 28.57 |
| 500 | 0.18 | 6.37 | 17.26 | |||
| 4000 | 4.71 | 3.10 | 12.75 | |||
| MPZ | 1.71 | 5.12 | 10 | 0.48 | 2.37 | 6.50 |
| 500 | 3.26 | 5.07 | 15.58 | |||
| 4000 | -0.92 | 2.87 | 7.96 | |||
| MNPZ d | 5.93 | 17.78 | 100 | -10.88 | 2.46 | 22.67 |
| HEP | 0.74 | 2.23 | 10 | 14.39 | 8.75 | 38.34 |
| 500 | 8.40 | 2.97 | 18.77 | |||
| 4000 | -0.34 | 3.33 | 9.02 | |||
| BHEP | 2.39 | 7.17 | 10 | -1.65 | 3.61 | 10.25 |
| 500 | 7.35 | 6.64 | 23.70 | |||
| 4000 | -6.43 | 5.57 | 19.48 | |||
| DMOZD | 2.46 | 7.39 | 10 | 1.03 | 4.25 | 12.09 |
| 300 | -9.75 | 3.30 | 21.39 | |||
| 2500 | -6.51 | 5.38 | 19.52 | |||
| OPZ | 0.88 | 2.65 | 10 | -0.08 | 5.32 | 14.83 |
| 300 | -12.92 | 3.24 | 27.20 | |||
| 2500 | 0.37 | 5.50 | 15.39 | |||
| 2,4 Lutidine | 1.40 | 4.19 | 10 | -10.17 | 4.68 | 23.85 |
| 300 | -0.63 | 3.83 | 10.72 | |||
| 2500 | -12.49 | 5.21 | 30.35 |
d for a 1000-fold diluted sample, the concentration corresponds to mg·Kg-1 in the sample
As shown in Figure 4, the comparative evaluation showed agreement of the developed methods with the methods of the service provider using three complementary statistical tests.
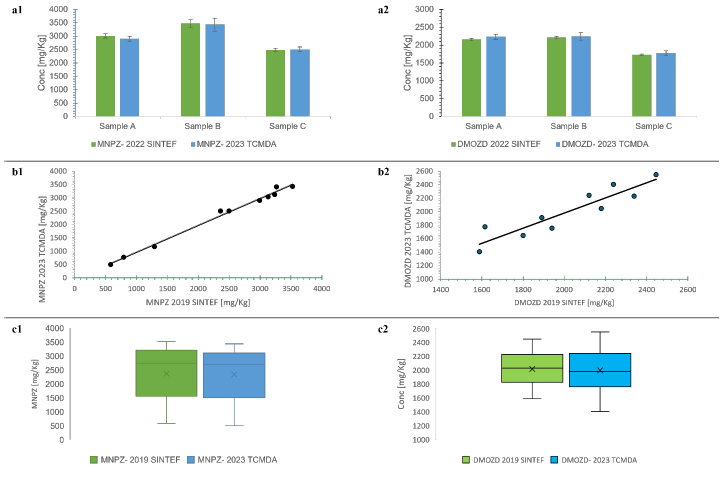
Figure 4: Method equivalence tests that show the comparability of the developed methods with the methods of the service provider. The “a” figures show the results of the t-test. The two methods were not significantly different at the concentrations tested (a1 MNPZ: Sample A: P (|t|≥2.20) = 0.05; Sample B: P (|t|≥0.35) = 0.73; Sample C: P (|t|≥0.63) = 0.54, and a2 DMOZD: Sample A: P (|t|≥2.16) = 0.08; Sample B: P (|t|≥0.71) = 0.51; Sample C: P (|t|≥1.63) = 0.15; at α= 0.05). The “b” figures show the results of the linear model. The two methods did not differ significantly over the entire measurement range (b1 MNPZ: intercept: P (|t|≥0.61) =0.56; slope: P (|t|≥0.31) = 0.77, and b2 DMOZD: P (|t|≥0.77) = 0.46; slope: P (|t|≥0.72) = 0.49 at α= 0.05). While the “c” figures show the results of the Wilcoxon signed-rank test. There was no statistically significant difference between the results obtained using the methods of the two laboratories (c1 MNPZ: W=20 ≥ 8 (test statistic), and c2 DMOZD: W=22 ≥ 8 (test statistic) at α= 0.05).19, 20
3.7 Method application
Ten samples from the ALIGN-CCUS campaign conducted in 2019/2020 were analysed using the newly developed methods. The samples represented the development of the matrix during more than 1200 hours of operation under different test conditions.5,6 The results presented in Figure 5 show that the samples contained five of the eight degradation products analysed, with 2,4-lutidine, HEP and BHEP below the LOQ equivalent of 10 mg·Kg-1. Additionally, PZ and MPZ, which were previously suspected but not quantified, were detected in the samples.5, 6 The validity of these findings was confirmed by the retention time falling within ± 0.1 min, two transitions, the ratio of transitions within ± 30 %, recovery results of the quality control (QC) sample at the LOQ (70−120 %), and linearity (R2 ≥ 0.995).15,16 These results affirm the efficacy of the developed methods in monitoring the degradation of CESAR1 for NVDPs.
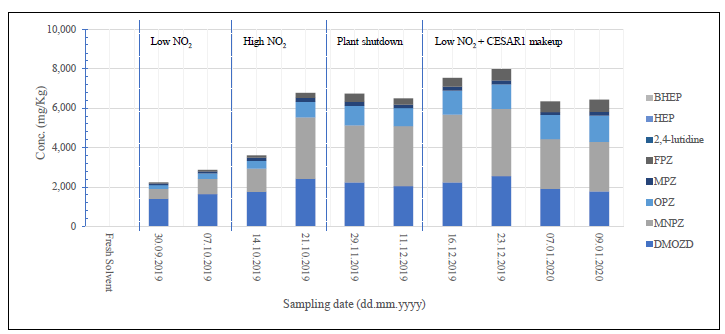
Figure 5: Results of aged CESAR1 solvent from the 2019/2020 ALIGN-CCUS campaign using the developed methods. The results show an increase in solvent degradation at high NO2 concentrations in the flue gas. As expected, solvent degradation decreased during a plant shutdown and increased again after start-up. The addition of fresh solvent diluted the degradation products. BHEP, HEP and 2,4-lutidine were below the LOQ (10 mg.Kg-1). All targeted degradation products were below the LOQ in the fresh solvent. Details on the operation of the plant are published in papers.2,5,6
3.8 Analyte stability of some NVDPs
The concentration of DMOZD, MNPZ, and 2,4-lutidine remained stable throughout the storage period. However, there was a significant decrease in the concentration of OPZ, ranging from 35% to 54% over the three-year period, as illustrated in Figure 6. Further analysis is required to ascertain the reason behind this decline. It is plausible that OPZ underwent degradation or transformation.
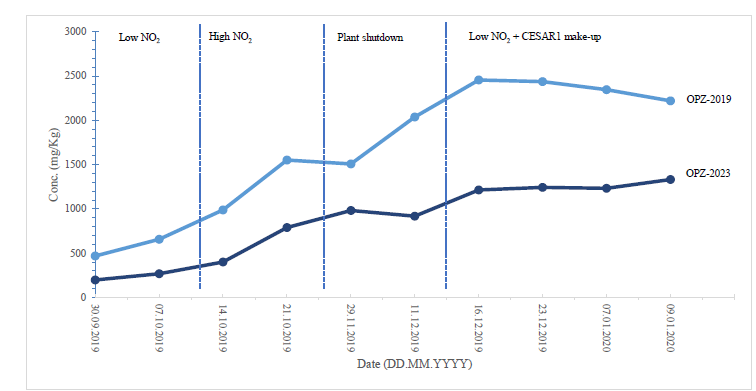
Figure 6: Comparison of results between SINTEF 2019 and TCM 2023 for OPZ with losses between 35- 54 %.
4. Conclusion
Our study validates the effectiveness of using LC-MS/MS for the ex-situ quantification of non-volatile degradation products (NVDPs) of solvents in the context of amine-based carbon capture process. We found that the stationary phases PGC and PFP were effective in separating most cyclic NVDPs from the primary amines using standard LC- MS/MS compatible solvents in isocratic mode. The separation of linearly structured NVDPs proved challenging in the reverse phase and requires further investigation. Our identification of previously unmonitored NVDPs in substantial quantities indicates the need to broaden the scope of analytes to be monitored. This may be achievable through simultaneous or combined target and non-target analyses.31,32 We also observed the loss of some degradation products with prolonged storage, which may impact sample stability and preservation, as well as the use of aged solvents for carbon capture.11
The availability of high-precision instrumentation on-site could greatly benefit carbon capture facilities. LC-MS/MS can effectively monitor NVDPs in solvents, absorber water, acid washes, and absorber emissions captured in solutions or filters in near real-time. It can serve as a complementary technique to inline online and at-line processes analysers.4
5. Acknowledgements
The authors express their sincere gratitude to TCMDA, Gassnova, Equinor, Shell, and TotalEnergies for their contributions and efforts toward this research. We also acknowledge the support provided by the Erasmus+ programme of the European Union through the EMQAL program, along with the Department of Chemistry at the University of Bergen (UiB).
6. References
- a International Energy Agency Greenhouse Gas R&D Programme (IEAGHG) Further Assessment of
Emerging CO2 Capture Technologies for the Power Sector and their Potential to Reduce Costs; IEAGHG:
Cheltenham, UK, September 2019. b Feron, P. & Cousins, Ashleigh & Jiang, Kaiqi & Zhai, Rongrong & Garcia,
Monica, 2020. An update of the benchmark post-combustion CO2-capture technology. Fuel. 273. 117776.
10.1016/j.fuel.2020.117776. c Garcia, S., et.al., Process Integration of Advanced Amine-based Solvents in Power and Industrial Plants: A New Benchmark for Post-combustion Carbon Capture? (March 31, 2021). Proceedings of the 15th Greenhouse Gas Control Technologies Conference 15-18 March 2021, Available at SSRN: https://ssrn.com/abstract=3816508 or http://dx.doi.org/10.2139/ssrn.3816508 - Hume, S. A.; Shah, M. I.; Lombardo, G.; Kleppe, E. R. In Results from Cesar-1 Testing with Combined
Heat and Power (CHP) Flue Gas at the CO2 Technology Centre Mongstad, TCCS–11. CO2 Capture, Transport and Storage. Trondheim 22nd–23rd June 2021. Short Papers from the 11th International Trondheim CCS Conference, SINTEF Academic Press: 2021. - Languille, B.; Drageset, A.; Mikoviny, T.; Zardin, E.; Benquet, C.; Ullestad, Ø.; Aronson, M.; Kleppe,
E. R.; Wisthaler, A., Atmospheric emissions of amino-methyl-propanol, piperazine and their degradation products during the 2019-20 ALIGN-CCUS campaign at the Technology Centre Mongstad. In The 15th Greenhouse Gas Control Technologies Conference (GHGT-15), 2021. - Languille, B.; Drageset, A.; Mikoviny, T.; Zardin, E.; Benquet, C.; Ullestad, Ø.; Aronson, M.; Kleppe,
E. R.; Wisthaler, A. In Best practices for the measurement of 2-amino-2-methyl-1-propanol, piperazine and their degradation products in amine plant emissions, Proceedings of the 15th Greenhouse Gas Control Technologies Conference, 2021; pp 15-18. - Benquet, C.; Knarvik, A. B. N.; Gjernes, E.; Hvidsten, O. A.; Romslo Kleppe, E.; Akhter, S. In First
process results and operational experience with CESAR1 solvent at TCM with high capture rates (ALIGN-CCUS
project), The 15th Greenhouse Gas Control Technologies Conference (GHGT-15), Abu Dhabi, 15-18 March; Abu Dhabi, 2021. - Campbell, M.; Akhter, S.; Knarvik, A.; Muhammad, Z.; Wakaa, A., CESAR1 solvent degradation and
thermal reclaiming results from TCM testing. In The 16th Greenhouse Gas Control Technologies Conference 2022 (GHGT-16), Lyon, France, 2022. - Gouedard, C.; Picq, D.; Launay, F.; Carrette, P. L., Amine degradation in CO2 capture. I. A review.
International Journal of Greenhouse Gas Control 2012, 10, 244-270. - Freeman, S. A. Thermal degradation and oxidation of aqueous piperazine for CO2 capture. University of
Texas at Austin, 2011. - Wang, T. Degradation of Aqueous 2-Amino-2-methyl-1-propanol for CO2 Capture. Telemark University
College, 2013. - Reynolds, A. J.; Verheyen, T. V.; Meuleman, E., 16 – Degradation of amine-based solvents. In AbsorptionBased Post-combustion Capture of CO2, Feron, P. H. M., Ed. Woodhead Publishing: 2016; pp 399-423.
- Cuccia, L.; Dugay, J.; Bontemps, D.; Louis-Louisy, M.; Vial, J., Analytical methods for the monitoring of
post-combustion CO2 capture process using amine solvents: A review. International Journal of Greenhouse Gas Control 2018, 72, 138-151. Electronic copy available at: https://ssrn.com/abstract=5024434 - Saeed, I. M.; Mazari, S. A.; Alaba, P.; Ali, B. S.; Jan, B. M.; Basirun, W. J.; Sani, Y. M.; Nizzamuddin,
S.; Mubarak, N. M., A review of gas chromatographic techniques for identification of aqueous amine degradation products in carbonated environments. Environmental Science and Pollution Research 2021, 28, 6324-6348. - Vevelstad, S. J.; Buvik, V.; Knuutila, H. K.; Grimstvedt, A.; da Silva, E. F., Important Aspects Regarding
the Chemical Stability of Aqueous Amine Solvents for CO2 Capture. Industrial & Engineering Chemistry Research 2022, 61 (43), 15737-15753. - Moser, P.; Wiechers, G.; Schmidt, S.; Figueiredo, R. V.; Skylogianni, E.; Monteiro, J. G. M.-S.,
Conclusions from 3 years of continuous capture plant operation without exchange of the AMP/PZ-based solvent at Niederaussem–Insights into solvent degradation management. In The 16th Greenhouse Gas Control Technologies (GHGT-16), IEAGHG: Lyon, France, 2022. - European Commission, 2002/657/EC: Commission Decision of 12 August 2002 implementing Council
Directive 96/23/EC concerning the performance of analytical methods and the interpretation of results (Text with EEA relevance) (notified under document number C(2002) 3044). European Commission, Ed. 2002. - European Commission Directorate-General for Health and Food Safety (SANTE), Analytical quality control
and method validation procedures for pesticide residues analysis in food and feed SANTE 11312/2021. DirectorateGeneral for Health and Food Safety: 2022. - Thompson, M.; Ellison, S. L. R.; Wood, R., Harmonized guidelines for single-laboratory validation of
methods of analysis (IUPAC Technical Report). Pure and Applied Chemistry 2002, 74 (5), 835-855. - Dr. Latimer, G. W., Jr. (ed.), Guidelines for Standard Method Performance Requirements. In Official
Methods of Analysis of AOAC INTERNATIONAL, 22 ed.; Dr. Latimer, G. W., Jr., Ed. Oxford University Press: New
York, 2023. - Konieczka, P.; Namiesnik, J., Quality assurance and quality control in the analytical chemical laboratory:
a practical approach. 2nd ed.; CRC Press Inc: Boca Raton, FL, USA, 2018. - Miller, J.; Miller, J. C., Statistics and Chemometrics for Analytical Chemistry. Pearson Education Limited:
2010; Vol. 6th. - Žuvela, P.; Skoczylas, M.; Jay Liu, J.; Ba̧ czek, T.; Kaliszan, R.; Wong, M. W.; Buszewski, B., Column
Characterization and Selection Systems in Reversed-Phase High-Performance Liquid Chromatography. Chemical reviews 2019, 119 (6), 3674-3729. - West, C.; Elfakir, C.; Lafosse, M., Porous graphitic carbon: a versatile stationary phase for liquid
chromatography. Journal of Chromatography A 2010, 1217 (19), 3201-3216. - Bapiro, T. E.; Richards, F. M.; Jodrell, D. I., Understanding the complexity of porous graphitic carbon (PGC)
chromatography: modulation of mobile-stationary phase interactions overcomes loss of retention and reduces variability. Analytical chemistry 2016, 88 (12), 6190-6194. - Bell, D. S.; Jones, A. D., Solute attributes and molecular interactions contributing to “U-shape” retention on
a fluorinated high-performance liquid chromatography stationary phase. Journal of Chromatography A 2005, 1073 (1-2), 99-109. - Lepaumier, H.; Picq, D.; Carrette, P.-L., New amines for CO2 capture. II. Oxidative degradation
mechanisms. Industrial & Engineering Chemistry Research 2009, 48 (20), 9068-9075. - Chen, W.; Fu, X.; Liu, X.; Ye, L.; Yuan, Y., Mechanistic insight into the photocatalytic N-alkylation of
piperazine with alcohols over TiO2 supported Pd catalysts. Molecular Catalysis 2023, 538, 112993.
Electronic copy available at: https://ssrn.com/abstract=5024434 - Tan, W.; Zhu, L.; Mikoviny, T.; Nielsen, C. J.; Wisthaler, A.; D’anna, B.; Antonsen, S.; Stenstrøm, Y.;
Farren, N. J.; Hamilton, J. F., Experimental and Theoretical Study of the OH-Initiated Degradation of Piperazine under
Simulated Atmospheric Conditions. The Journal of Physical Chemistry A 2020, 125 (1), 411-422. - Naidong, W.; Chen, Y.-L.; Shou, W.; Jiang, X., Importance of injection solution composition for LC–MS–
MS methods. Journal of pharmaceutical and biomedical analysis 2001, 26 (5-6), 753-767. - Wang, J.; Aubry, A.-F.; Cornelius, G.; Caporuscio, C.; Sleczka, B.; Ranasinghe, A.; Wang-Iverson, D.;
Olah, T.; Jemal, M., Importance of mobile phase and injection solvent selection during rapid method development and sample analysis in drug discovery bioanalysis illustrated using convenient multiplexed LC-MS/MS. Analytical methods 2010, 2 (4), 375-381. - Horwitz, W.; Albert, R., The Horwitz Ratio (HorRat): A Useful Index of Method Performance with Respect
to Precision. Journal of AOAC International 2006, 89 (4), 1095-1109. - Rajski, Ł.; Petromelidou, S.; Díaz-Galiano, F. J.; Ferrer, C.; Fernández-Alba, A. R., Improving the
simultaneous target and non-target analysis LC-amenable pesticide residues using high speed Orbitrap mass
spectrometry with combined multiple acquisition modes. Talanta 2021, 228, 122241. - García-Reyes, J. F.; Hernando, M. D.; Ferrer, C.; Molina-Díaz, A.; Fernández-Alba, A. R., Large scale
pesticide multiresidue methods in food combining liquid chromatography–time-of-flight mass spectrometry and tandem mass spectrometry. Analytical Chemistry 2007, 79 (19), 7308-7323