
1. Results from CESAR1 testing at the CO2 Technology Centre Mongstad. Verification of Residual Fluid Catalytic Cracker (RFCC) baseline results (2022)
Scott A. Humeb*, Blair McMastera,c, Audun Drageseta, Muhammad I. Shaha and Eirik R.
Kleppea,d, Matthew Campbella
aTechnology Centre Mongstad, 5954 Mongstad, Norway
bElectric Power Research Institute, Inc., 1300 West WT Harris Blvd, Charlotte, NC 28262, USA
cTotalEnergies EP Norge AS, Finnestadveien 44, Dusavik, 4029 Stavanger, Norway
d Equinor ASA, PO Box 8500, 4035 Stavanger, Norway
Abstract
Technology Centre Mongstad (TCM DA) was established in 2012 to test, verify, and demonstrate different post-combustion capture (PCC) of carbon dioxide technologies. The company is a joint venture between Gassnova (on behalf of the Norwegian state), Equinor, Shell, and TotalEnergies with a common vision for testing and research and development of carbon capture for the deployment of large-scale carbon capture. The facility is located next to the Equinor refinery in Mongstad, Norway and is provided flue gas from a nearby combined cycle gas turbine-based heat-and-power (CHP) plant as well as residue fluid catalytic cracker (RFCC) flue gas from the refinery.
The CESAR1 solvent, developed in the EU CESAR project, was utilized for the first time at TCM for the ALIGN CCUS (Accelerating Low Carbon Industrial Growth Through Carbon Capture Utilization and Storage) project test campaign in 2019. CESAR1 solvent is a blend of 27% wt 2-amino-2-methylpropan-1-ol (AMP) and 13% wt piperazine (PZ). This solvent is considered a better solvent than monoethanolamine (MEA) in terms of thermal energy performance and stability (lower degradation) and has been proposed by the IEAGHG as their new benchmark solvent. TCM DA carried out baseline testing of CESAR1 solvent in June 2020 using flue gas from the CHP source, controlled at 5% CO2 to simulate state of the art gas turbine flue gas, and continued with additional testing that lasted into late 2020 using flue gas from the RFCC source that has higher CO2 concentration. The main objectives of these campaigns were to produce knowledge and information that can be used to reduce the cost as well as technical, environmental, and financial risks of commercial-scale deployment of PCC using the CESAR1 solvent. This includes the establishment of an RFCC baseline performance with CESAR1 solvent.
The Electric Power Research Institute, Inc. assessed the performance of the CESAR1 process using an independent verification protocol (IVP) previously developed for TCM DA during CHP baseline testing MEA solvent. The IVP was also previously updated for use with the RFCC flue gas as this gas contains 13–14% CO2 content whereas the CHP flue gas has ~3.5% CO2 content by volume. The IVP provides a structured testing procedure for assessing the thermal and environmental performance of PCC processes under normal operating conditions. During the RFCC testing, TCM DA manually collected extractive samples from the depleted gas outlet and the product CO2 outlet throughout the testing period. As part of the IVP, EPRI also assessed plant critical instrumentation at TCM DA for accuracy and precision error based on a comparative analysis during testing operations and against calibration checks.
The CESAR1 baseline process was evaluated during twelve individual test periods over three days in November 2020. During the tests, extractive samples were taken to measure process contaminants such as aldehydes, ketones, amines (AMP/PZ), and ammonia. The extractive sampling and associated analysis techniques applied were consistent with the IVP recommendations. Sulfur oxides and nitrogen oxides were continuously monitored using Fourier transform infrared (FTIR) analyzers on the depleted flue gas and the product CO2 streams. Multiple measurements of the CO2 concentration (FTIR, non-destructive infra-red, and gas chromatography) are available at TCM allowing comparative confirmation of test period stability. The capture rate was calculated via four methods. CO2 recovery (mass balance) was evaluated, and the thermal performance (energy consumption) was assessed based on measured data taken during the tests.
The CO2 capture rate achieved during the testing was about 91%, providing specific reboiler duties (SRD) of 3.2–3.3 GJ/t-CO2 and the CO2 gas mass balance closures were close to 100%. These data and assessments, along with the results from TCM DA sampling during these tests, will be presented in this paper and provide a baseline case for CESAR1 solvent in higher concentration flue gas capture cases.
1. Introduction
The CO2 Technology Centre Mongstad (TCM) is located next to the Equinor refinery in Mongstad, Norway. TCM DA is a joint venture owned by Gassnova representing the Norwegian state, Equinor, Shell, and TotalEnergies. TCM is home to one of the largest post-combustion CO2 capture (PCC) test centres in the world and recently marked the completion of 10 years of technology testing. This facility entered the operational phase in August 2012 and is dubbed the “amine plant.” A unique aspect of the facility is that either a flue gas slipstream from a natural gas-fired combined- cycle gas turbine (CCGT) based combined heat-and-power (CHP) plant or an equivalent volumetric flow from a residual fluid catalytic cracker (RFCC) unit can be used for CO2 capture. The CHP flue gas contains about 3.5% CO2 and the RFCC flue gas contains about 13–14% CO2, the latter of which is comparable to CO2 levels seen in a coal- fired flue gas.
The amine plant, designed and constructed by Aker Solutions and Kværner, is a highly flexible and well- instrumented facility that can accommodate a variety of technologies with capabilities of treating flue gas streams of up to 60,000 Sm3/hr. The plant is offered to developers of solvent-based CO2 capture technologies to test the performance of their solvent technology and to verify technologies aimed to reduce the atmospheric emissions and environmental impact of solvent emissions and degradation products from these processes.
The objective of TCM DA is to test, verify, and demonstrate CO2 capture technologies suitable for deployment at full scale. A significant number of vendors have already successfully tested using the TCM DA facilities to assess their CO2 capture technologies. Multiple tests using the CESAR1 solvent have been carried out at TCM to define the baseline performance of the solvent for defined operating conditions using RFCC flue gas at 13.5% CO2 content in accordance with an independent verification protocol (IVP), which provides a structured testing procedure, developed by the Electric Power Research Institute, Inc. (EPRI) [1].
2. Amine Plant
The TCM 234 tonnes-CO2/day amine plant was designed to be flexible to allow testing of different process configurations. The amine plant is configured to remove CO2 from a natural gas-fired combustion turbine-based CHP plant flue gas or a RFCC off-gas. The typical characteristics of the RFCC gas stream is shown in Table 1.
Table 1. Nominal characteristics of flue gas supplied to TCM
| Parameter | Units | RFCC Flue Gas |
| Temperature | °C | 27 |
| N2+Ar | % vol, dry | 82.5 |
| O2 | % vol, dry | 4.3 |
| CO2 | % vol, dry | 13.2 |
| SO2 | ppmv, dry | 20 to 60 |
| NO | ppmv, dry | 50 to 115 |
| NO2 | ppmv, dry | 3 |
| SO3 | ppmv, dry | 7 to 10* |
| CO | ppmv, dry | 0 to 3 |
| NH3 | ppmv, dry | 1 |
| Particulates | mg/Nm3 | 14 to 41* |
| Chloride | mg/Nm3 | < 0.1 |
* controlled via Brownian demister filter
The RFCC type flue gas was used for the tests performed in this work. A process flow diagram showing high-level equipment contained within the amine plant along with key existing instrumentation is shown in Figure 1.
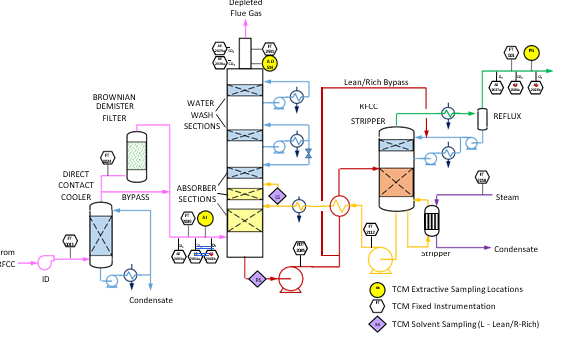
Major system components include:
- An induced draft (ID) blower to overcome pressure drops and blow the flue gas through the plant with an output capacity of up to 270 mbar and 60,000 Sm3/hr.
- A direct-contact cooler (DCC) system to initially lower the temperature of and saturate the incoming flue gas
by a counter-current water flow to improve the efficiency of the absorption process and provide pre-scrubbing of the flue gas. The DCC system has two individually operated packed columns for operations with the CHP flue gas and the RFCC flue gas, respectively. When operating with RFCC flue gas, including the tests reported in this paper, caustic (NaOH) is injected under pH control with a target pH of 8 to reduce levels of acidic SO2 aerosols.
- A Brownian demister module designed to remove particulate and aerosol particles from the flue gas when
using the RFCC. The module has a bypass line to facilitate controlled aerosol levels entering the downstream absorber unit.
- An absorber to remove CO2 from the flue gas using multiple packed sections. The absorber also has water- wash systems located in the upper region of the tower to scrub and clean the flue gas, particularly of any solvent
carry over. When operating with RFCC flue gas, the upper water wash is operated with maximum cooling duty, the lower water wash with minimum cooling duty and additionally, the upper 6 m of absorber packing is utilized as a 3rd “once through” water wash section. The CO2 depleted flue gas passes through a mesh mist eliminator before exiting the absorber column to the atmosphere through a stack located at the top of the column.
- Stripper columns to recover the captured CO2 and return CO2-lean solvent to the absorber. The amine plant consists of two independent stripper columns with a common overhead condenser system. The two stripper
columns are operated independently considering the CO2 content in the flue gas due to column design, hydraulics, and gas velocity effects. Both strippers circulate solvent to the reboilers by thermosiphon. The RFCC stripper also has a circulating pump to assist at low-load operation and during startup. The RFCC reboiler is a shell-and-tube arrangement.
- Balance of plant units include a lean-solvent trim cooler, pumps used to move the CO2-lean and CO2-rich solvent streams between the absorber and stripper, a cross heat exchanger to recover heat from the lean stream, a
reflux drum, stripper condenser, and pumps to dry the product CO2 that exits the stripper.
More details of these components are available in Hume et al [2].
The TCM facility can test virtually any PCC solvent-based process as the amine plant has been designed to accommodate a variety of technologies. The facility also has excellent instrumentation and an on-site lab for detailed analysis.
An IVP was developed to be used as part of the overall performance assessment of amine-based processes and has been updated over time to apply to either CHP or RFCC operation on the TCM amine facility. The IVP is designed to provide a structured testing procedure for assessing thermal and environmental performance of PCC processes under normal operating conditions.
3. CESAR1 RFCC Campaign Overview
The CESAR1 solvent, developed in the EU CESAR project [3], was utilized for the first time at TCM for the ALIGN CCUS (Accelerating Low Carbon Industrial Growth Through Carbon Capture Utilization and Storage) project test campaign in 2019 [4,5]. CESAR1 is a blend of 27% wt 2-amino-2-methylpropan-1-ol (AMP) and 13% wt piperazine (PZ). This solvent is considered a better solvent than monoethanolamine (MEA) in terms of thermal energy performance and stability [6,7] and has been proposed by the IEAGHG as their new benchmark solvent [6]. TCM DA carried out baseline testing of CESAR1 solvent in June 2020 using flue gas from the CHP source, controlled at 5% CO2 to simulate state of the art gas turbine flue gas [2]. During the baseline testing of CESAR1 solvent with RFCC flue gas reported in this paper the average measured solvent concentration was 28.8 / 10.4% wt AMP/PZ.
RFCC flue gas capture performance assessment periods were conducted in November 2020. During the testing, personnel from TCM DA manually collected extractive samples from the depleted gas outlet and the product CO2 line downstream of the RFCC stripper. In previous tests, this was sometimes performed by an independent testing
contractor. However, TCM DA’s competency related to performing this testing was deemed adequate by EPRI during prior MEA baseline campaigns, especially since TCM DA is not commercially involved in the outcome and hence can be considered to be unbiased.
While EPRI was unable to travel to the site to observe TCM’s in-house sampling campaign for the CESAR1 solvent firsthand as a result of travel restrictions due to the SARS-CoV-2 pandemic, several meetings were conducted remotely during the planning phase of the test campaign and EPRI received the data for the tests from TCM DA for analysis. Data logs for all sampling periods containing pertinent flows, temperatures, pressures, and concentrations measured by permanent plant instruments were supplied by TCM DA for the entire test period. The sampling time periods, and sampling period designators are shown in Table 2 along with additional sampling undertaken on each day.
Table 2. CESAR1 RFCC Sampling Periods
| Date | Start Time – Stop Time | Stream Sampled | Sampling Results Reported | Test Period |
| 9:16 – 9:36 | Product CO2 | Aldehydes/Ketones | C7-1 | |
| 17 November 2020 | 9:21 – 9:41 | Absorber Outlet | Aldehydes/Ketones | C7-2 |
| 9:43 – 11:47 | Product CO2 | AMP, PZ, NH3 | C7-3 | |
| 9:54 – 11:58 | Absorber Outlet | AMP, PZ, NH3 | C7-4 | |
| 9:17 – 9:37 | Product CO2 | Aldehydes/Ketones | C7-5 | |
| 18 November 2020 | 9:40 – 11:40 | Product CO2 | AMP, PZ, NH3 | C7-6 |
| 9:51 – 10:11 | Absorber Outlet | Aldehydes/Ketones | C7-7 | |
| 10:24 – 12:31 | Absorber Outlet | AMP, PZ, NH3 | C7-8 | |
| 9:09 – 9:29 | Product CO2 | Aldehydes/Ketones | C7-9 | |
| 22 November 2020 | 9:30 – 9:50 | Absorber Outlet | Aldehydes/Ketones | C7-10 |
| 9:32 – 11:39 | Product CO2 | AMP, PZ, NH3 | C7-11 | |
| 11:00 – 12:00 | Absorber Outlet | AMP, PZ, NH3 | C7-12 |
4. Instrument assessment
To determine the process plant performance, a key component is the quality of the instrumentation installed for measuring the respective compositions and flow rates. Instrumentation quality is determined using two parameters:
Accuracy/bias: This represents the difference between the instrument reading (or average of a set of readings under unchanging process conditions) being assessed and the true value of the parameter being measured. Appropriate determination of the “true value” must be achieved by simultaneous measurement of the parameter using a reference method or instrument with calibration that can be traced to primary standards.
Precision: A determination of the variability of the instrument reading when stream conditions are known to be steady state. Precision is therefore a measure of the random error associated with the measurement.
These measurement errors can be combined to assess the aggregate uncertainty in each measurement. In the absence of a calibration against primary standards for the entire measurement range needed, the uncertainty published by the instrument supplier represents only the precision error.
When the process parameter being measured does not change, precision is a measure of repeatability. In real plant situations, when attempting to operate at steady-state conditions, often process parameters (flow, pressure, and temperature) do vary over the measurement period. Thus, measurements over long periods of time (greater than process time constants) will also include an error term related to process uncertainty.
5. Gas Phase Composition
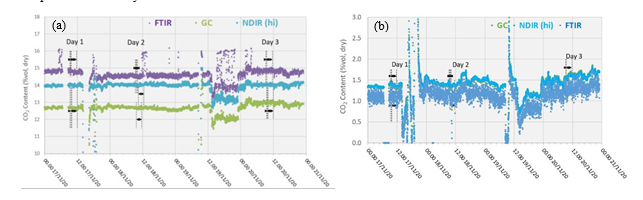
5.1 CO2 Measurement of Flue Gas Supply and Depleted Flue Gas
Figure 2 (a) displays the RFCC flue gas supply CO2 concentration data over the test campaign periods. The FTIR data have been corrected to be on a dry basis using the FTIR moisture assessment. The FTIR is biased 1% high and the GC is biased over 1% low in comparison to the HNDIR. Note that the CO2 concentration of RFCC flue gas is beyond the measurement range for the LNDIR and hence cannot be used for these evaluations. As per previous campaigns, the HNDIR data were used in preference to the FTIR and GC data as the NDIR instruments exhibit a higher precision due to a lower measurement spread for the same sampled conditions.
Figure 2 (b) shows the depleted flue gas CO2 measurements with the FTIR instrument included though it showed an excessive precision error. The GC and NDIR instruments agree well regarding changes in gas composition throughout each test day, typically to within 0.01% vol (dry). Although the GC was in good agreement with the NDIR(Hi), it showed a slightly lower precision, therefore as with prior tests, the NDIR(Hi) measurements were used for performance analysis for these tests.
5.2 Oxygen Measurement of Flue Gas Supply and Depleted Flue Gas
Figure 3 shows both the supply and the depleted flue gas oxygen measurements with the GC for the RFCC test period. As the capture rate was constant throughout the period, the concentrating effect, i.e., from 6% vol to 7% vol, for all other components can be clearly seen from the oxygen measurements.
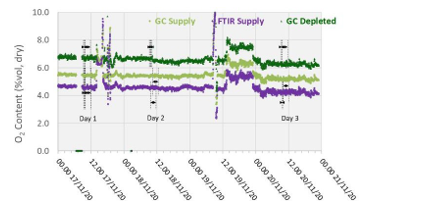
Variations in the inlet oxygen are represented with a similar response on the outlet stream. However, the apparent low precision error exhibited by this commensurate response cannot be determined as each measurement point is from the same core instrument (i.e., variation could indeed be from the instrument and not the process).
6. Gas Phase Flow Rates
6.1 Flue Gas Supply Flows
The RFCC flue gas supply flow is measured by two independent multi-point pitot tube instruments. FIC-0024-ACC and FT-2039, with FIC-0024-ACC attaining a lower precision uncertainty as shown in Table 3. The flow data for the test periods is shown in Figure 4.
Table 3. Key flue gas supply flow instrumentation
| Stream | Tag Number | Instrument Type | Primary Flow Measurement | Precision Uncertainty CHP / RFCC | |
| RFCC Flue Gas Supply | FIC-0024-ACC | Multi-pitot tube | Differential pressure | – | 2.59% |
| Flue Gas Supply at Absorber Inlet | FT-2039 | Multi-pitot tube | Differential pressure | 5.27% | 5.32% |
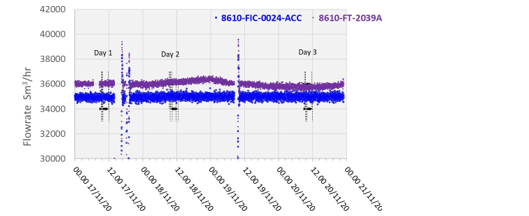
All calculations for CESAR1 RFCC flue gas tests are based on the measured RFCC flue gas flow using FIC-0024.
6.2 Depleted Flue Gas Flows
The depleted flue gas flow was measured by a single multi-pitot tube flow meter whose characteristics are listed in Table 4. Actual measurements depict poor accuracy showing consistent and variable negative bias, as shown in Figure 5, which is likely from plugging in the pitot tube elements caused by the condensation due to the super-saturated moisture condition of the depleted flue gas at this location. This instrument was therefore not utilized to determine the resultant absorber outlet flow. Instead, the conservation of inert components from the inlet stream (oxygen, nitrogen, and argon) was used to determine the appropriate flowrate achieved.
Table 4. Key depleted gas flow instrumentation
| Stream | Tag Number | Instrument Type | Primary Flow Measurement | Precision Uncertainty CHP / RFCC | |
| Absorber Outlet Depleted Flue Gas | FT-2431 | Multi-pitot tube | Differential pressure | 5.28% | 5.38% |
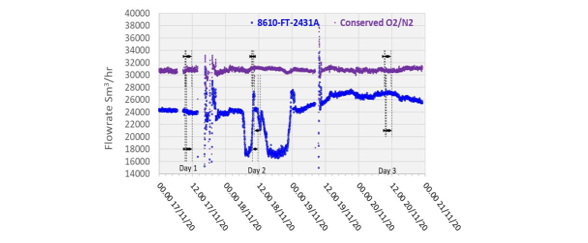
All performance calculations are based on the conserved oxygen and nitrogen method from the flue gas supply measurement as the depleted flue gas flow indication (FT-2431) was shown to not be accurate due to inconsistent measurements with a substantial negative bias due to the saturated flue gas at the absorber outlet.
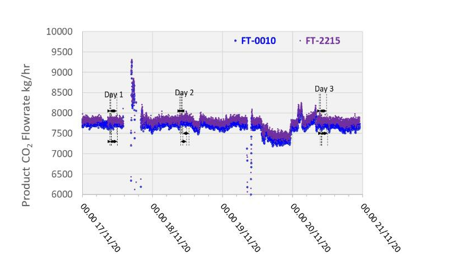
6.3 Product CO2
The product CO2 flow is normally measured by the vortex flow meter (FT-0010) and the precision uncertainty for this instrument are listed in Table 5.
Table 5. Key product CO2 gas flow instrumentation
| Stream | Tag Number | Instrument Type | Primary Flow Measurement | Precision Uncertainty CHP / RFCC | |
| Product CO2 | FT-0010 | Vortex | Flowing volume | 1.04% | 1.03% |
TCM installed an additional Coriolis flow meter instrument (FT-2215), which previously offered agreement with and exhibited a higher precision than FT-0010 during prior MEA baseline testing. However, this instrument has not undergone an accuracy study and so the precision uncertainty cannot be defined for these tests. The data from both flow meters are shown in Figure 6 for reference. The product CO2 flow was relatively steady throughout the test periods.
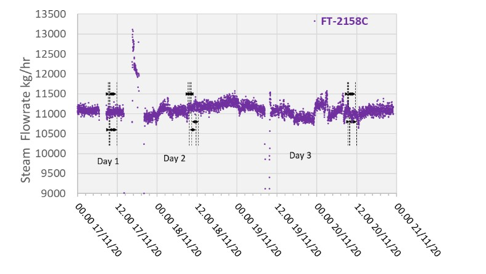
6.4 Steam/Condensate
High-pressure (HP) steam is delivered from the refinery to the TCM amine plant at a pressure of approximately 30 bar, superheated to 240–310°C. The HP steam is throttled to a pressure near the stripper reboiler steam pressure (approximately 4 barg) and then desuperheated with condensate. The stripper reboiler condensate collects in a receiver from which it is returned to the refinery. A small amount of medium-pressure (MP) steam is reduced to a lower pressure for use in steam heat tracing. The low-pressure (LP) steam condensate is returned to the same receiver as the stripper reboiler condensate. The reboiler steam flow rate for the CESAR1 RFCC tests is shown in Figure 7.
7. Results & Discussion
7.1 CO2 Capture Efficiency/Recovery
CO2 capture efficiency can be quantified in several ways depending on how measurements have been taken and the expected accuracy of each individual measurement. EPRI commonly uses the four individual methods that are indicated in Table 6.
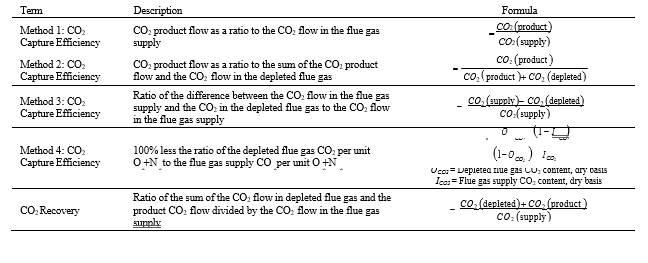
These methods can rely on combinations of the available information to determine a capture efficiency, using the measured gas flowrates in combination with the CO2 analyser measurements. Method 4 simplifies the measurement uncertainty by utilizing only CO2 concentration data and making the well-founded assumption that all incoming inert gases (such as nitrogen and oxygen) will be unchanged through the absorption process. Hence, Method 4 can be used to compare against the other methods that utilize the flow measurements. In addition, the “CO2 Recovery” calculation is indicated in Table 6. The CO2 Recovery is a measure of the CO2 mass balance, being the fraction of CO2 mass flow in the flue gas supply that is accounted for by measured CO2 mass flows in the depleted flue gas and product CO2. It is therefore a measure of the degree to which the CO2 mass balance is closed.
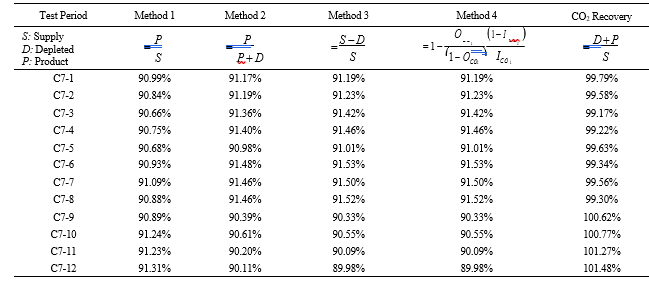
Table 7 shows the four calculation methods of CO2 capture and recovery for the test periods. Note that CO2 product flow can be based on either the measured CO2 product flow (P) or by using the difference between the NDIR-measured CO2 supply and depleted flows (S – D). CO2 capture rates calculated by Methods 2, 3, and 4 were in good agreement within each test period, with Method 1 giving a consistently slightly higher value for CESAR1 CHP testing. It should be noted that Methods 3 and 4 are equivalent due to using the conserved oxygen and nitrogen method for outlet gas flow determination. The CO2 recovery (mass balance) was slightly above 100% for the RFCC tests.
Table 7. CO2 capture results
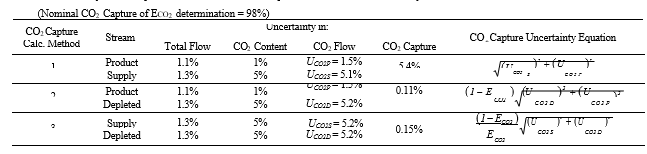
he uncertainty in measurement of flow and composition propagates into the uncertainty in the CO2 capture. The uncertainty calculations and representative results from each of the calculation methods are shown in Table 8. The following assumptions were used:
- Flow metering uncertainties are those theoretically estimated and calculated by internal work at TCM DA for the indicated flow meters
- Concentration uncertainties for the flue gas flows are those described in previously in Section 6
- Concentration uncertainty for the product CO2 is arbitrarily assigned to be 1% vol, which allows for actual CO2 content as low as 99% vol
- CO2 capture of 90% is representative of that measured during all test periods
- The uncertainty in CO2 capture (ECO2) is almost all due to uncertainty in CO2 content of the flue gas supply for the assigned total (low) flow uncertainties. The CO2 capture uncertainty is relatively insensitive to both the product CO2 content uncertainty and the depleted flue gas CO2 content uncertainty.
7.2 Thermal Use
The thermal results are detailed in Table 9. The reboiler heat duty or the heat released in the reboiler is calculated as the difference between steam enthalpy at reboiler inlet and the saturated water enthalpy at the reboiler condensate temperature. The specific thermal use is then calculated by dividing the reboiler heat duty by the product CO2 flow. The two corresponding values for specific thermal energy consumption are shown in results and were consistent during all test periods.
Table 9. Stripper reboiler thermal use calculation
| Test Period | Reboiler Steam Flow Rate kg/hr | Reboiler Heat Duty MJ/hr | Using Product CO2 Flow (P) | Using CO2 Removed from the Flue Gas (S – D) | ||
| Product CO2 Flow kg/hr | Specific Thermal Use GJ/t-CO2 | Captured CO2 kg/hr | Specific Thermal Use GJ/t-CO2 | |||
| C7-1 | 11062 | 25222 | 7790 | 3.24 | 7806 | 3.23 |
| C7-2 | 11059 | 25214 | 7778 | 3.24 | 7811 | 3.23 |
| C7-3 | 11044 | 25177 | 7772 | 3.24 | 7838 | 3.21 |
| C7-4 | 11045 | 25179 | 7776 | 3.24 | 7837 | 3.21 |
| C7-5 | 11098 | 25266 | 7822 | 3.23 | 7850 | 3.22 |
| C7-6 | 11174 | 25413 | 7846 | 3.24 | 7898 | 3.22 |
| C7-7 | 11170 | 25413 | 7845 | 3.24 | 7879 | 3.23 |
| C7-8 | 11179 | 25415 | 7844 | 3.24 | 7899 | 3.22 |
| C7-9 | 11130 | 25246 | 7750 | 3.26 | 7702 | 3.28 |
| C7-10 | 11048 | 25065 | 7790 | 3.22 | 7730 | 3.24 |
| C7-11 | 10992 | 24995 | 7775 | 3.21 | 7678 | 3.26 |
| C7-12 | 10978 | 24977 | 7775 | 3.21 | 7662 | 3.26 |
Previous testing at TCM [8] using conventional 5M MEA solvent (30% wt) with RFCC flue gas at approximately 190 tonnes per day load yielded a regeneration energy range of 3.43–3.55 GJ/t-CO2 using the product CO2 flow (P) and 3.51–3.65 GJ/t-CO2 using the gas-side difference method (S – D), all carried out at a nominal 91% capture rate. The CESAR1 RFCC tests achieved circa 187 tonnes per day load and delivered a regeneration energy range of 3.21-
3.26 GJ/t-CO2 using product flow (P) and a very consistent 3.21-3.28 GJ/t-CO2 using gas-side difference method (S – D). The capture rate was a commensurate 90% for these tests, allowing direct comparison with the MEA tests. The CESAR1 regeneration energy at the same nominal load and capture rate had between 8-10% lower regeneration energy than 5M MEA. The liquid-gas ratio (L/G) for the CESAR1 testing, 2.7 kg/Sm3, was lower than the 5M MEA testing,
3.8 kg/Sm3 due to the higher cyclic capacity of the CESAR1 solvent.
A notable difference between the conditions of the RFCC flue gas testing with 5M MEA and CESAR1 was the flue gas inlet temperature to the absorber. A temperature of 31oC was used for the 5M MEA testing, however due to precipitation in the lower absorber packing, the flue gas temperature was raised to 40oC with CESAR1 to allow stable operation [5]. This increased flue gas temperature for CESAR1 is likely to incur a regeneration energy penalty relative
to testing at the same temperature as 5M MEA. Benquet et al, reported results from early TCM testing with CESAR1 solvent and CHP flue gas including regeneration energy penalty for higher flue gas temperatures due to precipitation issues [5].
7.3 Process Contaminats
Formaldehyde, acetaldehyde, and acetone concentrations were determined by extractive sampling during the CESAR1 RFCC test periods, as shown in Table 10.
Table 10. Depleted flue gas aldehyde/ketone concentrations and mass rates
| Test Period | Formaldehyde | Acetaldehyde | Acetone | ||||||
| ppmvd | mg/Sm3 | g/h | ppmvd | mg/Sm3 | g/h | ppmvd | mg/Sm3 | g/h | |
| C7-2 | 0.286 | 0.36 | 10.39 | 0.099 | 0.18 | 5.27 | 0.779 | 1.91 | 54.72 |
| C7-7 | 0.254 | 0.32 | 9.31 | 0.157 | 0.29 | 8.44 | 1.158 | 2.84 | 82.10 |
| C7-10 | 0.298 | 0.38 | 10.79 | 0.144 | 0.27 | 7.65 | 1.030 | 2.53 | 72.13 |
The formaldehyde levels are substantially higher than the previous MEA RFCC baseline testing measured concentration of 0.06 mg/Sm3. The acetaldehyde levels are considerably lower with CESAR1 than the MEA RFCC test samples of 1.7 mg/Sm3. Acetone levels measured during the MEA tests were sufficiently low at or below the detection limit of 1 mg/Sm3, while with CESAR1 they were between 1–3 mg/Sm3. CO2 product results are shown in Table 11.
Table 11. Product CO2 aldehyde/ketone concentrations and mass rates
| Test Period | Formaldehyde | Acetaldehyde | Acetone | ||||||
| ppmvd | mg/Sm3 | g/h | ppmvd | mg/Sm3 | g/h | ppmvd | mg/Sm3 | g/h | |
| C7-1 | 0.077 | 0.098 | 0.41 | 0.173 | 0.32 | 1.35 | 3.111 | 7.64 | 32.00 |
| C7-5 | 0.075 | 0.095 | 0.40 | 0.153 | 0.29 | 1.20 | 2.701 | 6.64 | 27.89 |
| C7-9 | 0.088 | 0.112 | 0.47 | 0.191 | 0.36 | 1.48 | 3.210 | 7.89 | 32.85 |
For the CO2 product, the formaldehyde levels detected were 2x higher the manual sampled measurements during the MEA RFCC baseline campaign (0.06 mg/Sm3) and the acetaldehyde levels are considerably lower than the previous level of 6.2 mg/Sm3. Unlike the MEA tests, acetone was easily detected in the CO2 product, whereas in the previous MEA baseline all measurements taken were below the detection limit of 0.9 mg/Sm3.
The data suggests that formaldehyde and acetone are generated from the CESAR1 solvent at higher relative rates to acetaldehyde than is the case for MEA.
TCM DA measured concentrations of solvent components (AMP and PZ) along with ammonia during the CESAR1 testing, results of these manually extracted samples are shown in Table 12.
Table 12. Depleted flue gas stream ammonia and solvent component concentrations and mass rates
| Test Period | AMP | PZ | Ammonia | ||||||
| ppmvd | mg/Sm3 | g/h | ppmvd | mg/Sm3 | g/h | ppmvd | mg/Sm3 | g/h | |
| C7-4 | 0.113 | 0.426 | 12.23 | 0.090 | 0.33 | 9.41 | 4.590 | 3.31 | 94.91 |
| C7-8 | 0.203 | 0.765 | 22.04 | 0.174 | 0.63 | 18.26 | 4.310 | 3.10 | 89.41 |
| C7-12 | 0.232 | 0.875 | 24.91 | 0.102 | 0.37 | 10.58 | 4.925 | 3.55 | 101.0 |
The solvent components of CESAR1 appear to show substantially lower vapor pressure than is associated with MEA solvent. PZ concentrations were lower than AMP, and the combined AMP/PZ concentrations are ~10 times lower than the MEA equivalent case of 2.9 ppmvd [8]. Ammonia levels are far lower than the MEA tests results, suggesting that ammonia does not represent a significant degradation product of CESAR1.
Extractive solvent and ammonia samples were taken from the CO2 product, and the results are shown in Table 13. In this instance, the AMP measurements were higher than the MEA samples, that were below the detection limit. PZ was detected in 2 of 3 samples, but was present at very low concentrations. Ammonia desorption into the product gas is almost 2 orders of magnitude lower than the depleted flue gas levels, it is comparable with the ammonia concentration detected from the MEA RFCC tests.
Table 13. Product CO2 ammonia and solvent component concentrations and mass rates
| Test Period | AMP | PZ | Ammonia | ||||||
| ppmvd | mg/Sm3 | g/h | ppmvd | mg/Sm3 | g/h | ppmvd | mg/Sm3 | g/h | |
| C7-3 | 0.357 | 0.922 | 5.62 | 0.020 | 0.07 | 0.30 | 0.120 | 0.09 | 0.36 |
| C7-6* | 0.013 | 0.034 | 0.21 | <0.01 | <0.04 | <0.15 | <0.20 | <0.14 | <0.61 |
| C7-11 | 0.523 | 1.351 | 8.24 | 0.005 | 0.02 | 0.08 | 0.119 | 0.09 | 0.36 |
* ‘<’ indicates sample measured below detection limit
Test C7-6 has abnormally low solvent and ammonia levels, not consistent with online measurements. Sulfur dioxide and nitrogen oxide components were measured using FTIR, as shown in Table 14. Prior SO2 measurements for the MEA campaign were under <1 ppmv and this test period was similar. The NO gas appears to largely pass through the absorption process without significant interaction with the solvent. However, the majority of NO2 entering the absorber will react with the solvent as reported by Campbell et al [9].
Table 14. Depleted flue gas SO2 and NO concentrations and mass rates
| Test Period | SO2 | NOx (as NO2) | ||||
| ppmvd | mg/Sm3 | g/h | ppmvd | mg/Sm3 | g/h | |
| C7-1 | 0.04 | 0.11 | 3.1 | 107.7 | 209.6 | 5,994 |
| C7-2 | 0.06 | 0.15 | 4.4 | 108.2 | 210.4 | 6,019 |
| C7-3 | 0.12 | 0.34 | 9.6 | 107.2 | 208.5 | 5,986 |
| C7-4 | 0.14 | 0.38 | 10.9 | 107.1 | 208.5 | 5,985 |
| C7-5 | 0.41 | 1.10 | 31.8 | 108.6 | 211.2 | 6,080 |
| C7-6 | 0.43 | 1.17 | 33.7 | 107.6 | 209.3 | 6,034 |
| C7-7 | 0.21 | 0.58 | 16.8 | 110.6 | 215.2 | 6,213 |
| C7-8 | 0.50 | 1.35 | 39.0 | 107.2 | 208.6 | 6,008 |
| C7-9 | 0.02 | 0.04 | 1.2 | 116.2 | 226.1 | 6,442 |
| C7-10 | – | – | – | 117.4 | 228.4 | 6,511 |
| C7-11 | 0.00 | 0.00 | 0.1 | 117.0 | 227.7 | 6,487 |
| C7-12 | 0.00 | 0.00 | 0.1 | 117.1 | 227.9 | 6,491 |
- Comparison to earlier TCM RFCC CESAR1 Testing
7.4 Comparison to earlier TCM RFCC CESAR1 Testing
The EPRI verification period in November 2020 was the last section of a longer TCM test campaign with CESAR1 solvent and RFCC flue gas. From parametric testing earlier in this campaign, not verified by EPRI, TCM identified a test condition, B4REP2, with an optimum SRD of 3.06 GJ/t-CO2 for 90% capture rate testing with 18m absorber packing height. This case was selected to be repeated during the EPRI verification period. From TCM internal analysis, both overall and CO2 mass balance closure during the B4REP2 test were within 2%.
During the EPRI verification period, higher SRD values than the original B4REP2 test were observed. The major contributing factor to this difference is likely to be foaming in the stripper, which can incur significant SRD penalties as shown in CESAR1 CHP baseline testing. During the EPRI verification period, repeated addition of antifoam had very limited remedial effect. This led to the solvent circulation rate being increased from 85,000 to 95,000 kg/h which reduced but did not eliminate the foaming behaviour. This increase in solvent circulation rate moved the testing during the EPRI verification period away from the optimum L/G ratio identified earlier in the TCM test campaign and incurred an SRD penalty, as described in Table 15 where an additional test condition at 95,000 kg/h from earlier in the campaign, B1, is also included for comparison.
Table 15 – Comparison of CESAR1 RFCC EPRI Baseline Verification Period with earlier TCM CESAR1 RFCC Testing
| EPRI Baseline | B4REP2 Test | B1 | ||
| Date | 17/11/2020 – 20/11/2020 | 02/11/2020 | 24/10/2020 | |
| Lean Solvent Circulation | kg/hr | 95,000 | 84,988 | 94,455 |
| SRD | GJ/t-CO2 | 3.23 | 3.06 | 3.13 |
| Capture Rate | % | 91 | 89.6 | 89.52 |
| Solvent AMP:Piperazine Ratio | Mass Basis | 2.77 | 2.61 | 2.58 |
| Solvent Iron Content | mg/l | 1.36 | 1.02 | 0.98 |
Another contributing factor to the higher-than-expected SRD value is variation in concentration and quality of the CESAR1 solvent due to preferential losses of the piperazine component particularly due to reaction with NO2 as reported by Benquet et al [5], as shown in Table 15. During the EPRI verification period, the average measured solvent concentration was 28.8 / 10.4% wt AMP/PZ compared to the target concentration of 27 / 13% wt AMP/PZ.
7.3 Comparison to pilot and demonstration sites reported in literature
SRD results from previous pilot or demonstration scale testing with CESAR1 solvent with similar capture rate and flue gas CO2 concentration to this TCM EPRI verified baseline are shown in Table 16 with a range of packing materials, solvent concentrations and plant configurations used across the various sites. From the reported results, foaming issues do not appear to have been as prevalent at other sites when compared to TCM.
Table 16 – SRD Results from CESAR1 Pilots at 90% Capture Rate and 13-15% CO2
| Inlet CO2 | Packing | Packing Type | Capture | SRD | Solvent Conc. | Notes | |
| Site | mol%,d | m | – | % | GJ/ t | % wt | – |
| TCM RFCC Baseline | 14% | 18 | Koch Glitsch Flexipac | 91% | 3.23 | 28.8 / 10.4 | |
| RWE Niederaussem [10] | 15% | 16 | Not reported | 90% | 2.97 | 27 / 13 | Intercooler |
| Kaiserslautern [11] | 10% | 4.25 | Sulzer BX 500 | 90% | 3.3 | 28 / 17 | |
| CO2 SEPPL [12] | 13% | 12 | Raschig Superpak 250y | 90% | 3.18 | 28 / 17 | |
| Esbjerg [13] | 13.6% | 16 | Sulzer Mellapak 250X | 90% | 3.1 | 25 / 15 |
The SRD results reported in this paper are within but towards the upper range of the results reported by other CESAR1 test sites. From this comparison, recommendations for future CESAR1 testing at TCM should include the effect of absorber intercooling, mitigation measures for foaming behavior and variation of the piperazine content in the solvent within the precipitation limits.
8. Conclusions
The CESAR1 baseline with RFCC flue gas comparison to the earlier 30% wt MEA baseline performed at TCM DA using the same flue gas source [8] is shown in Table 17.
Table 17. Comparison of TCM DA RFCC baseline conditions and results with CESAR1 and MEA solvents
| MEA Baseline 30% wt | CESAR1 Baseline 28.8 / 10.4% wt AMP/PZ | Notes | ||
| Date | May 2018 | November 2020 | ||
| Flue Gas | RFCC | RFCC | ||
| Packing Height | m | 18 | 18 | |
| Flue Gas Flow | Sm3/h | 35,000 | 35,000 | |
| CO2 Capture Rate | % | 91 | 91 | |
| Flue Gas Temperature | oC | 31 | 40 | Higher due to CESAR1 precipitation limitation |
| SRD | GJ/tCO2 | 3.55 | 3.23 | 9% decrease from CESAR1 to MEA |
| kg/Sm3 | 3.8 | 2.7 | Higher capacity of CESAR1 solvent. CESAR1 L/G not optimized due to foaming. | |
| Liquid:Gas Ratio | ||||
| Stripper Bottom Temperature | oC | 121 | 121 |
The CESAR1 baseline case was conducted at conditions as close to the MEA baseline as possible using the same flue gas source along with an identical packing height, flue gas flowrate, targeted capture rate and the stripper regeneration temperature. The CESAR1 solvent did exhibit precipitation in the absorber packing when the flue gas temperature was too low, hence the higher inlet temperature. The liquid to gas ratio is lower than MEA and was determined based on the solvent characteristics and performance during the tests. The SRD achieved using CESAR1 solvent was 9% lower than what was possible using 30% wt MEA solvent in the same configuration.
Acknowledgements
The authors gratefully acknowledge the staff of TCM DA, Gassnova, Equinor, Shell and Total for their contribution and work at the TCM DA facility. The authors also gratefully acknowledge Gassnova, Equinor, Shell, and TotalEnergies as the owners of TCM DA for their financial support and contributions.
References
- Thimsen D, Maxson A, Smith V, Cents T, Falk-Pedersen O, Gorset O, Hamborg ES, Energy Procedia 2014; 63:5938- 5958.
- Hume SA, Shah MI, Lombardo G, Kleppe ER. Results From CESAR1 Testing with Combined Heat and Power (CHP) Flue Gas at the CO2 Technology Centre Mongstad, TCCS-11 Trondheim Conference on CO2 Capture, Transport & Storage, Trondheim, Norway, June 21-23 2021. Pg 355 – 361
- Kvamsdal HM, Haugen G, Svendsen HF, Tobiesen A, Mangalapally H, Hartono A, Mejdell T. Modelling and simulation of the Esbjerg pilot plant using the CESAR 1 solvent. Energy Procedia 2011; 4:1644-1651.
- Accelerating Low carbon Industrial Growth through CCUS: ALIGN-CCUS, project homepage https://www.alignccus.eu/ accessed: 15.11.2021
- Benquet C, Knarvik A, Gjernes E, Hvidsten OA, Kleppe ER, Akhter S. First Process Results and Operational Experience with CESAR1 Solvent at TCM with High Capture Rates (ALIGN-CCUS Project), 15th International Conference on Greenhouse Gas Control Technologies, GHGT-15, 15th -18th March 2021 Abu Dhabi, UAE http://dx.doi.org/10.2139/ssrn.3814712
- Further Assessment of Emerging CO2 Capture Technologies for the Power Sector and their Potential to Reduce Costs IEAGHG, 2019-09
- Wiechers G, Moser P, Benquet C, Gibbons J, Monteiro J, Hartono A, Solli KA, Knuutila H. Guidelines for effective solvent management, Deliverable Nr. D1.2.6, ALIGN-CCUS.
- Hume SA, Shah MI, Lombardo G, de Cazenove T, Feste JK, Maxson A, Benquet C. Results from MEA testing at the CO2 Technology Centre Mongstad. Verification of Residual Fluid Catalytic Cracker (RFCC) baseline results, 15th International Conference on Greenhouse Gas Control Technologies, GHGT-15, 15th -18th March 2021 Abu Dhabi, UAE
- Campbell M, Akhter S, Knarvik A, Zeeshan M, Wakaa A. CESAR1 Solvent Degradation and Thermal Reclaiming Results from TCM Testing, 16th International Conference on Greenhouse Gas Control Technologies, GHGT-16, 23rd– 27th October 2022, Lyon, France.
- Moser P, Wiechers G, Schmidt S, Garcia M, Monteiro J, Goetheer E, Charalambous C, Saleh A, van der Spek M, Garcia
- S. ALIGN-CCUS: Results of the 18-Month Test with Aqueous AMP/PZ Solvent at the Pilot Plant at Niederaussem – Solvent Management, Emissions and Dynamic Behaviour (February 8, 2021). Proceedings of the 15th Greenhouse Gas Control Technologies Conference 15-18 March 2021, http://dx.doi.org/10.2139/ssrn.3812132
- Mangalapally HP, Hans H. Pilot plant experiments for post combustion carbon dioxide capture by reactive absorption with novel solvents. Energy Procedia 2011; 4:1-8.
- Rabensteiner, Markus, et al. “Pilot plant study of aqueous solution of piperazine activated 2-amino-2-methyl-1-propanol for post combustion carbon dioxide capture.” International Journal of Greenhouse Gas Control 51 (2016): 106-117.
- Schumacher N, et al. “CESAR 1 solvent test campaign at the pilot facility at Esbjerg power station”, CESAR Project Deliverable (2010).