
6. Results from MEA testing at the CO2 Technology Centre Mongstad. Part II: Verification of baseline results (2014)
Espen S. Hamborga,b, Vian Smitha,c, Toine Centsa,c, Natasha Brigmana,c, Olav Falk- Pedersena,d, Thomas De Cazenovea, Milan Chhaganlala,b, Jane K. Festea,b, Øyvind Ullestada,b, Helge Ulvatna,b, Oddvar Gorsete, Inga Askestade, Lars K. Gramf, Berit F. Foståsb, Muhammad I. Shahd, Andrew Maxsong, David Thimseng,*
aCO2 Technology Centre Mongstad (TCM DA), 5954 Mongstad, Norway bStatoil ASA, P.O. Box 8500, 4035 Stavanger, Norway cSasol Technology, P.O. Box 5486, Johannesburg 2000, South Africa dGassnova SF, Dokkvegen 10, 3920 Porsgrunn, Norway eAker Solutions, P. O. Box 222, 1326 Lysaker, Norway fFORCE Technology, Park Allé 345, 2605 Brøndby, Denmark gElectric Power Research Institute, 3420 Hillview Avenue, Palo Alto, CA 34304, USA *Corresponding author

Abstract

Independent verification protocol (IVP) work has been conducted at the CO2 Technology Centre Mongstad (TCM DA) during treatment of flue gas from a natural gas-fired combined heat and power (CHP) plant. The testing applied an aqueous 30 wt% monoethanolamine (MEA) solvent system treating flue gases with a flow rate of about 47.000 Sm3/hr and a CO2 content of about 3.5%. The CO2 capture rate was about 90% and the thermal steam consumption was about 4.1 GJ/t CO2. Emissions of MEA were very low and MEA-related degradation products were all below detection levels, and all within the emission limits set by the Norwegian environmental authorities. The current work may be considered an independently verified baseline for a non- proprietary post-combustion amine based solvent system carried out at an industrial-scale plant facility.
Long-term performance indices, such as material corrosion, MEA solvent degradation, etc., have not been considered in the current IVP work. Additional minor process adaption to the aqueous MEA solvent system, such as increased MEA concentrations, the use of anti-foam solutions, etc., may lead to lower thermal steam consumptions than aforementioned.
1. Introduction
CO2 Technology Centre Mongstad (TCM DA), located next to the Statoil refinery near Mongstad, Norway, is one of the largest post-combustion capture (PCC) test facilities in the world. TCM DA is a joint venture between Gassnova, Statoil, Shell, and Sasol. The purpose of this facility, which started operation in August 2012, is to allow vendors of suitable amine formulations and other PCC processes to test their technology and collect performance data to support full-scale design and anticipate the associated performance and operating costs. A unique aspect of the facility is that either a slipstream from a natural gas-fired combined heat and power (CHP) plant or an equivalent volumetric flow from a refinery residue fluid catalytic cracker (RFCC), whose higher CO2 content (about 12.9% compared with about 3.5% for the natural gas-based flue gas) is closer to that seen in coal flue gas, can be used for CO2 capture. In the CHP plant, the natural gas is combusted in a gas turbine and the flue gas content and characteristics are similar to those of a combined cycle gas turbine (CCGT) power plant. One of the testing facilities in place at TCM DA is a highly flexible and well-instrumented generic amine plant, designed and constructed by Aker Solutions and Kværner, aimed to accommodate a variety of technologies with capabilities of treating flue gas streams of up to 60,000 Sm3/hr. This plant is being offered to vendors of solvent-based CO2 capture technologies to primarily test: (1) the performance of their solvent technology; and (2) technologies aimed to reduce the atmospheric emissions of amines and amine-based degradation products from such solvent-based CO2 capture processes.
An independent verification protocol (IVP) has been developed by the Electric Power Research Institute (EPRI)
to be used as part of the overall performance assessment of amine-based TSA processes, as described in details elsewhere [1]. The IVP is designed to provide a structured testing procedure for assessing thermal and environmental performance of PCC processes under normal operating conditions.
The IVP has been applied during base-case testing done 6–10 January 2014 on the TCM amine plant using aqueous 30 wt% monoethanolamine (MEA) as the solvent while treating flue gas at a flow rate of about 47.000 Sm3/hr from the CHP plant. The IVP project was performed jointly between TCM DA, Aker Solutions, FORCE Technology, and the Electric Power Research Institute (EPRI), and the base-case testing is part of Aker Solutions’ test campaigns at TCM DA.
This work is part of a continuous effort of gaining better understanding of the performance potential of the non- proprietary aqueous MEA solvent system, conducted by TCM DA and its affiliates and owners, in order to test, verify, and demonstrate CO2 capture technologies [1, 2, 3]. The purpose of the current work is to provide the results of the IVP done for aqueous 30 wt% MEA, which provides a baseline that can be commensurately compared against other (solvent-based) PCC processes. This work may thus be considered the baseline for a non-proprietary PCC amine-based solvent system treating low CO2 partial pressure flue gases at a significant flow rate from the combustion of natural gas in a gas turbine.
2. Project overview
The TCM pilot-scale amine plant was designed and constructed by Aker Solutions and Kværner. The amine plant was designed to be flexible to allow testing of different configurations, and has respective capacities of about 80 and 275 tonnes-CO2/day for CHP and RFCC flue gas operations. The TCM DA amine plant process flow diagram showing high-level equipment contained within the plant along with key extant instrumentation and the nominal CHP flue gas characteristics is given elsewhere [1]. The major systems include:
- An induced draft (ID) blower to overcome pressure drops and blow the flue gas through the plant with a blower output capacity of up to about 270 mbar and 70,000 Sm3/hr.
- A direct-contact cooler (DCC) system to initially quench and lower the temperature and saturate the incoming flue gas by a counter-current flow water in order to improve the efficiency of the absorption process and provide pre-scrubbing on the flue gas. The DCC system has two individually operated packed columns for operations with respectively the CHP flue gas and the flue gas from the refinery cracking unit. The DCC column designed for CHP flue gas operations has of a 3-m diameter and a total of 16 m of height. The section where water counter currently contacts the flue gas is of 3.1 m of height with Flexipack 3X structured stainless-steel packing of Koch Glitsch. The DCC column designed for the flue gas from the refinery cracking unit has a diameter of 2.7 m and a total height of 16 m. The section where water counter currently contacts the flue gas is of 3 m of height with Intalox Snowflake random polypropylene packing of Koch Glitsch.
- An absorber to remove CO2 from the flue gas using solvent. The absorber has rectangular polypropylene-lined concrete column with a cross-section measuring 3.55 x 2 m of a total of 62 m of height. The lower regions of the tower, where the amine solution contacts the flue gas, consist of three sections of Koch Glitsch Flexipac 2X structured stainless-steel packing of 12 m, 6 m, and 6 m of height, respectively. Water-wash systems are located in the upper region of the tower to scrub and clean the flue gas particularly of any solvent carry over, and consist of two sections of Koch Glitsch Flexipac 2Y HC structured stainless-steel packing of both 3 m of height. The water wash system is also used to maintain the water balance of the solvent system by adjusting the temperature of the circulating water of the upper water-wash section. Liquid (re-)distributors, liquid collector trays, and mesh mist eliminators by Koch Glitsch are located at various locations in the tower. The CO2 depleted flue gas exits the absorber column to the atmosphere through a stack located at the top of the absorber column.
- Stripper columns to recover the captured CO2 and return CO2-lean solvent to the absorber. The amine plant consist of two independent stripper columns with overhead condenser systems; one measuring 1.3 m in diameter and a total of 30 m of height, the second measuring 2.2 m in diameter and also a total of 30 m of height. The lower regions of both stripper column, where the amine solutions is stripped, consist of Koch Glitsch Flexipac 2X structured stainless-steel packing of 8 m of height, and in the upper regions of the strippers consist of a rectifying water-wash section of Koch Glitsch Flexipac 2Y HC structured stainless-steel packing of 1.6 m of height. Liquid (re-)distributors, liquid collector trays, and mesh mist eliminators by Koch Glitsch are located at various locations in the strippers. Each stripper column is connected to its respective stream-driven thermosiphon reboiler system, providing the necessary heat required for the stripping process. The two stripper columns are operated independently considering the CO2 content in the flue gas, due to column design and hydraulics and gas velocities effects, i.e., the smaller diameter stripper column is utilized when treating CHP flue gas, whereas the large diameter column is utilized when treating flue gases of higher CO2 content.
- A set of pumps used to move the CO2-lean and CO2-rich solvent streams between the absorber and stripper and through a cross-flow heat exchanger to recover heat from the lean stream.
- A reflux drum, condenser, and pumps to dry the product CO2 that exits from the stripper. A portion of the product CO2 can also be recycled back to the inlet of the DCC to increase the concentration of the CO2 in the inlet flue gas stream.
The roles and responsibilities of the organizations that conducted the current IVP project are as follows:
- TCM DA is the prime on the project and its personnel organized the field testing including contracting to do gas sampling during the test period. Personnel from TCM DA and TCM DA owner organizations were responsible for planning and setting the test program for the base-case testing, and also operating the plant throughout. TCM DA personnel collected samples during the base-case testing for quantification of trace species in the depleted flue gas stream.
- Aker Solutions is the technology vendor testing its solvent-based PCC technologies at TCM DA. A part of Aker Solutions’ test period was to conduct a campaign based on the non-proprietary MEA solvent system, which was intended to be used as a reference for future testing. The base-case testing done 6–10 January 2014 was consequently a part of Aker Solutions’ test campaigns at the TCM DA amine plant.
- FORCE Technology brought a single sampling crew on-site during the base-case testing to extract and analyse samples from the CHP flue gas supply, depleted flue gas, and product CO2 streams. This sampling was conducted sequentially with a single set of continuous emissions monitors (CEMs). FORCE Technology also collected gas samples for off-site analysis of particulate, SO2/SO3, and amine-related compounds.
- EPRI was contracted to develop the IVP and help apply it during the base-case MEA testing. Two EPRI engineers were on-site during the testing to observe the conduct of the tests. EPRI is also the lead on the current IVC work.
3. Independent verification protocol approach
Base-case testing of the performance of the TCM amine plant using a nominal 30% MEA as the solvent was conducted the week of 6 January 2014 after approximately 6 weeks of operating the amine plant with the 30% MEA solution. The plant was operated at steady state through the entire week. (Note: The MEA solution concentration did drift down approximately 1 percentage point during the week of base-case testing.) The only operational abnormality was a short loss of flue gas flow for about 15 minutes at 15:00 hrs on 8 January 2014 from which operations were quickly restarted.
FORCE Technology was on-site to manually collect samples sequentially from the flue gas supply, depleted fuel gas, and product CO2. During all sampling periods the following sample data were collected:
- CO, CO2, NOX, O2, SO2, and N2 (by difference) concentrations in vol%
- Flow rate, pressure, and temperature.
The sampling time periods and sampling period designator are shown in Table 1 along with additional sampling undertaken on each day. Data logs for all sampling periods containing pertinent flows, temperatures, pressures, and concentrations measured by permanent plant instruments were supplied by TCM DA.
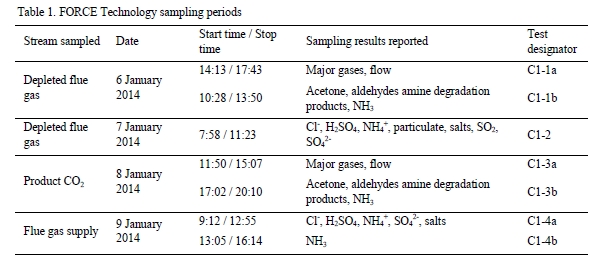
Table 1. FORCE Technology sampling periods.
4. Instrument assessment
This section assesses the quality of the instrumentation installed for measuring the respective compositions and flow rates. There are two measures of instrumentation quality:
- Accuracy / bias – Measure of the difference between the instrument reading (or average of a set of readings under unchanging process conditions) and the true value of the parameter. The “true value” must be determined by means other than the measurement in question. This is usually accomplished by simultaneous measurement of the parameter by the plant instrument and a reference method or instrument with calibration that can be traced to primary standards.
- Precision – Variability of the instrument reading when stream conditions do not change. Precision is a measure of the random error associated with the measurement.
The aggregate uncertainty in a measurement includes both precision error and bias error. Absent a calibration against primary standards, the uncertainty published by the instrument supplier is only the precision error.
Note also that precision is a measure of repeatability when the process parameter being measured does not change. It is often the case that the process parameter (flow, pressure, and temperature) does change over the measurement period. Thus, measurements over long periods of time (greater than process time constants) will also include an error term related to process uncertainty.
4.1 Gas phase compositions
The CO2 and O2 content of the flue gas supply, depleted flue gas, and CO2 product stream is routinely determined by the respective plant Fourier Transform Infrared (FTIR) (Applied Instrument Technologies and Finetech, model: Anafin 2000) and O2 (Siemens, model: Oxymat 6) sampling and analysis system. The sampling system admits the gas stream, sampled from various single points as given by Thimsen et al [1]. The sample is continuously drawn by a selection system serving the analyzer. The gas supply samples are diverted to the common analyzers in a 90-minute cycle, i.e., the analyzer cycles between flue gas supply for 15 minutes, depleted flue gas for 30 minutes, and CO2 product stream for 15 minutes. In each sampling, the analyzer sampling lines and cells are sufficient flushed with the gas to be measured and, after a certain time, wet-gas concentration for every 1½ minutes for a total of 10 concentrations are reported. The plant control system displays to the operators the most recent concentration report. Thus, the last report of the 10 is displayed for approximately 75 minutes until the next sampling cycle for the flue gas supply and CO2 product stream and approximately 60 minutes for the depleted flue gas.
The flue gas supply, depleted flue gas, and CO2 product stream compositions were analyzed by FORCE Technology during the base-case operations. The measurements reported by FORCE Technology were on a dry basis. (The sample is dried before analysis.) These dry-basis data were converted to wet basis by assuming that the flue gas supply is saturated with water at the temperature and pressure measured by the plant data acquisition system. The recalculated FORCE Technology data are given in Fig. 1 and Fig. 2, and compared to the values determined by the FTIR system. Details include:
- Fig. 1 displays the CHP flue gas supply CO2 and O2 concentration data over the test campaign. The agreement between FORCE Technology O2 measurements and those measured by TCM DA O2 analyzer on 9 January are as good as the agreement in respective CO2 measurements. These data show that for the last 2½ days of the campaign, CHP flue gas supplied to the pilot plant was of relatively uniform composition. This is probably not the case for the first 1½ days of the campaign. The variability in CO2 and O2 concentrations are significantly greater than the precision uncertainty in the measurements indicating that the changes in measured concentration represent real changes in CHP flue gas composition.
- Fig. 2 displays the depleted flue gas CO2 and O2 concentration data over the test campaign. The FORCE Technology O2 data collected on 6 January differ significantly from the TCM DA O2 data for the first half of the sampling period, but are in general agreement over the last half of the sampling period. The relative uniformity of the FORCE Technology data on 6 January suggests that the TCM DA O2 data above 15% O2 may be spurious and not a result of process changes. There was significant variation in the depleted flue gas FORCE Technology CO2 and TCM DA FTIR concentration data for the sampling period. The precision error for this measurement is in excess of 20%. In addition, there was a significant positive bias in the FTIR data compared to FORCE Technology data taken simultaneously on 6 January. The bias could be corrected by multiplying the FTIR data by 0.7 over this time period. Although the bias is significant, the error was about 0.1% points.
- The product CO2 composition data reported by FORCE Technology include O2 content between 1–2%. It is difficult to imagine a mechanism by which the product CO2 stream (stripper overhead) can contain this much oxygen, and it is therefore presumed that this oxygen is due to air in-leakage into the sampling system, thereby disqualifying the data. For the purposes of calculating CO2 removal and recovery, it is assumed here that the product CO2 stream consists only of CO2 saturated with water at the measured temperature and pressure.
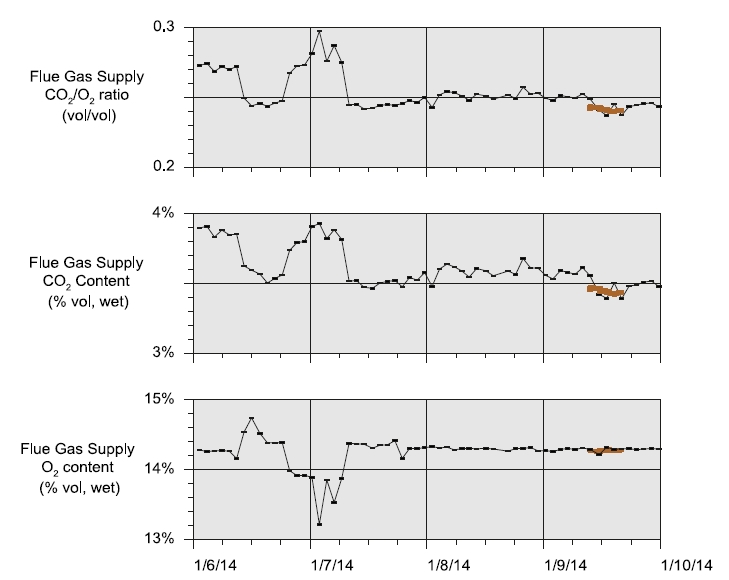
Fig. 1. CHP flue gas supply CO2 and O2 data. FTIR and O2 analyzer data are averaged over analysis circles. Data collected by FORCE
Technology on 9 January are also shown.
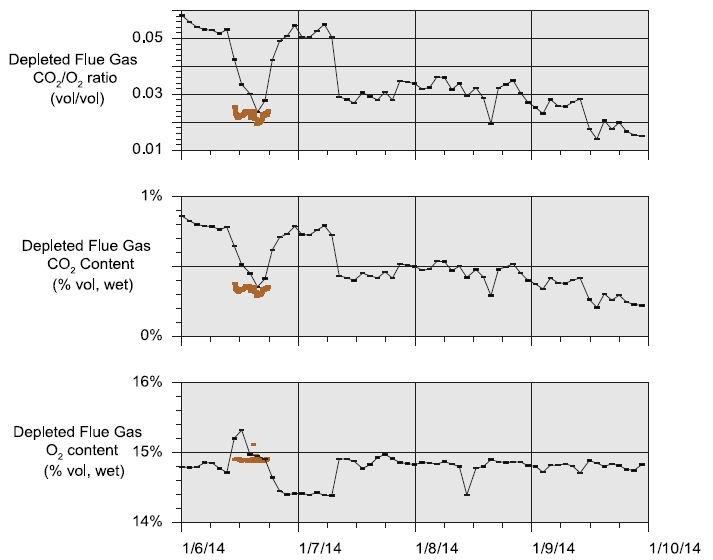
Fig. 2. Depleted flue gas CO2 and O2 data. FTIR and O2 analyzer data are averaged over analysis cycles. Data collected by FORCE Technology
on 6 January are also shown.
4.2 Gas phase flow rates
The flow rates of the flue gas, depleted flue gas, and CO2 product stream are continuously determined by plant instrumentation. The TCM DA amine plant facility is particularly well instrumented for determining the flue gas supply flow rate, with several different types of flow meters in series.
The flue gas, depleted flue gas, and CO2 product stream flow rates were determined by pitot-tube traversing during the base-case operations by FORCE Technology and the results compared to plant instrumentation are discussed below:
- The CHP flue gas supply flow is measured by two instruments, an ultra-sonic flow meter (FT-0150) and a multi- pitot-tube flow meter (FIC-0124), which are characterized in Table 2. The data from these flow meters are shown in Fig. 3. The flow rates are defined standard conditions of 15 °C and 1 atmosphere. The CHP flue gas flow was very steady over the test week with the exception of a 15-minute period on 8 January when the flow went to zero due to a trip of the ID blower. FORCE Technology made an independent measurement of flow on 9 January as indicated in Fig. 3. The difference between the value measured by FORCE Technology and that measured by the plant instruments is less than 1%. This result must be tempered by the reported uncertainty in the FORCE Technology measurement of 10%. The test period flow averages used for all calculations are the data reported by the ultrasonic flow meter (FT-0150).
- The depleted flue gas flow is measured by a single multi-pitot tube flow meter whose characteristics are listed in Table 2. The depleted flue gas flow rate of this instrument varies in a fashion that is uncorrelated with any known operational parameter rendering this data of little use for the purposes of the base-case testing. Investigation of this has indicated variation of the measured flue gas flow rate with the ambient air pressure. This may be related to the physical installation position of the instrument; however, exact cause for this flow rate variation is not yet understood. FORCE Technology measured a flow of 47.000 Sm3/hr (±10%) at this location on 7 January 2014.
- The key product CO2 flow meters are listed in Table 2. The product CO2 flow measured by the vortex flow meter (FT-0100) is the primary flow meter used by TCM operators. The data from this flow meter are shown in Fig. 4. The product CO2 flow was relatively steady over the test week with the exception of the 15-minute period on 8 January 2014 when the flow went to zero due to an ID blower trip. FORCE Technology made an independent measurement of flow on 8 January as indicated in Fig. 4. The difference between the value measured by FORCE Technology and that measured by the plant instruments is approximately 6%, within the uncertainty reported by FORCE Technology measurement of 10%.
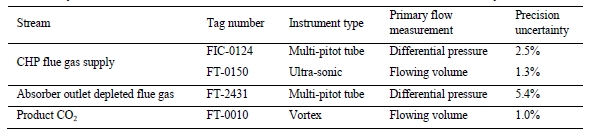
Table 2. Key flow instrumentation. Precision uncertainties are based internal instrument assessment by TCM DA.
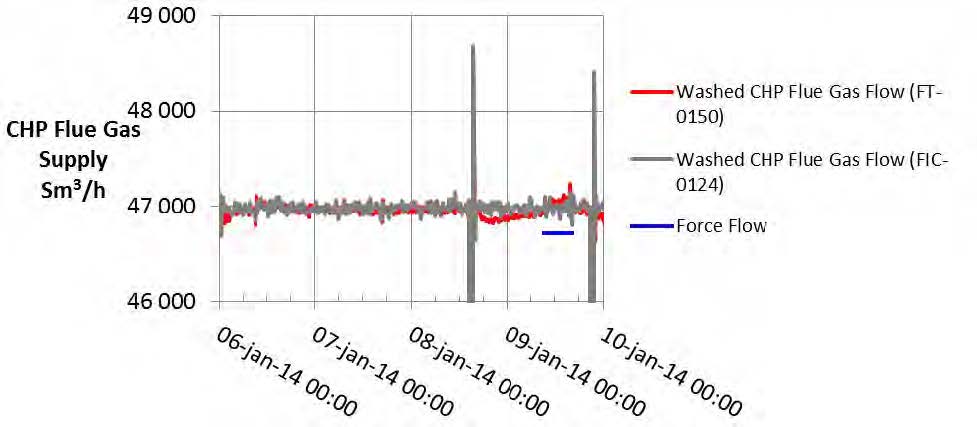
Fig. 3. CHP flue gas supply flow measurements.
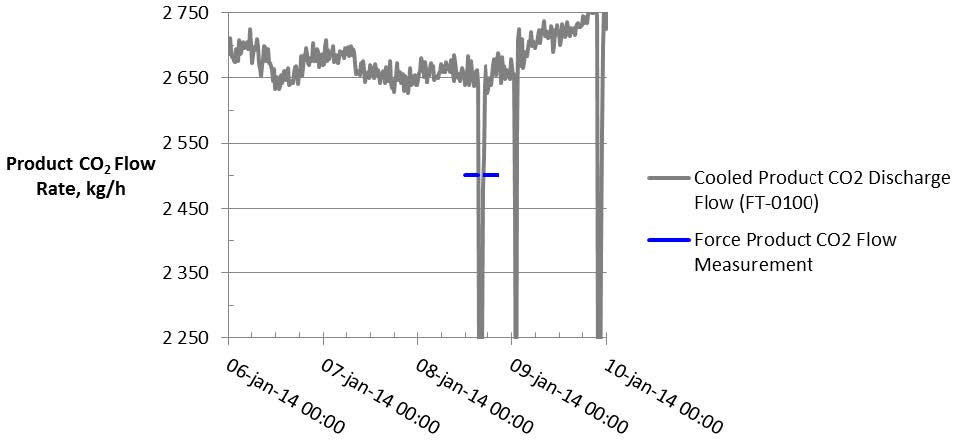
Fig. 4. Product flue gas flow rate and test period averages.
4.3 Steam and condensate flow rates
A schematic of the system supplying steam to the stripper reboiler is shown in Fig. 5. High-pressure (HP) steam is delivered from the refinery to the TCM amine plant at a pressure of approximately 30 bars, superheated to approximately 240°C to 310°C. The HP steam is throttled to a pressure near the stripper reboiler steam pressure at approximately 5 bars and then desuperheated with condensate. The stripper reboiler condensate collects in a receiver from which it is returned to the refinery. A small amount of medium-pressure (MP) steam is reduced to a lower pressure for use in steam heat tracing. The low-pressure (LP) steam condensate is returned to the same receiver as the stripper reboiler condensate.
The parameter of interest is the steam flow to the reboiler. A check on this parameter is the HP condensate flow returned to the refinery. The condensate return flow should be the sum of the reboiler steam flow and any condensate flow produced in steam heat tracing. Fig. 5 shows these two parameters. The condensate return flow indicated (FT- 2455) is consistently higher than the reboiler steam flow (FT-2386) by typically 2% to 8%. This difference is in the correct direction when heat tracing condensate (not measured by the reboiler steam flow meter) is entering the condensate receiver.
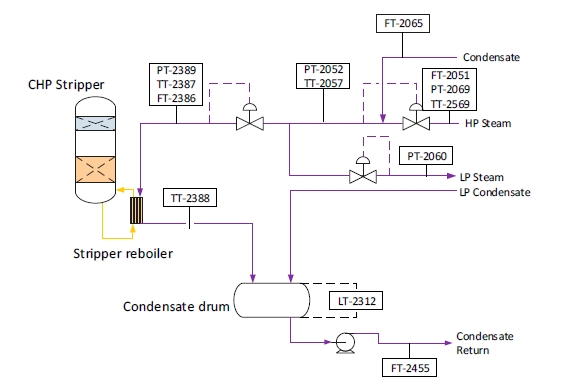
Fig. 5. Stripper reboiler steam supply flow schematic.
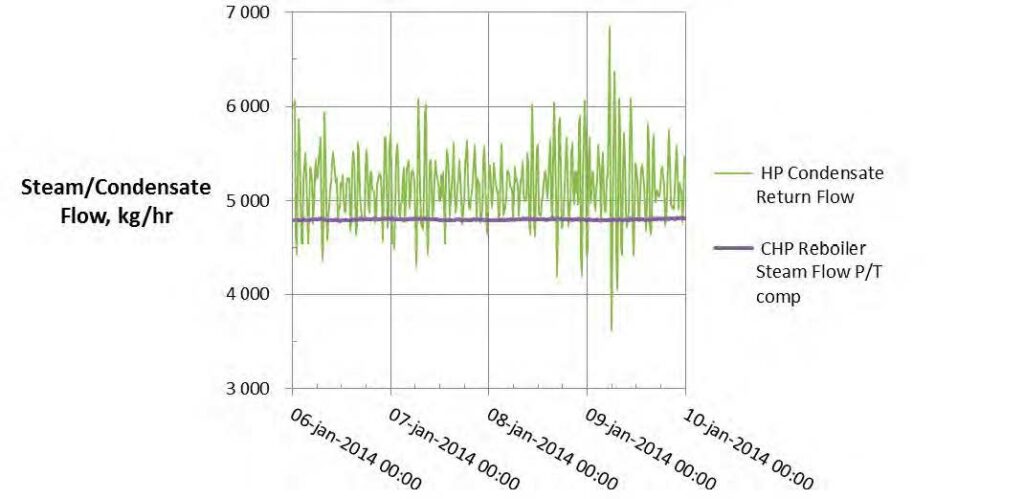
Fig. 6. Reboiler steam flow and HP condensate return flow.
5. Results and discussions
5.1 CO2 capture efficiency and recovery
CO2 capture efficiency can be quantified in four ways as described by Thimsen et al. [1] and indicated in Table 3. In addition, the CO2 recovery calculation is given in Table 3. The CO2 recovery is a measure of the CO2 mass balance.
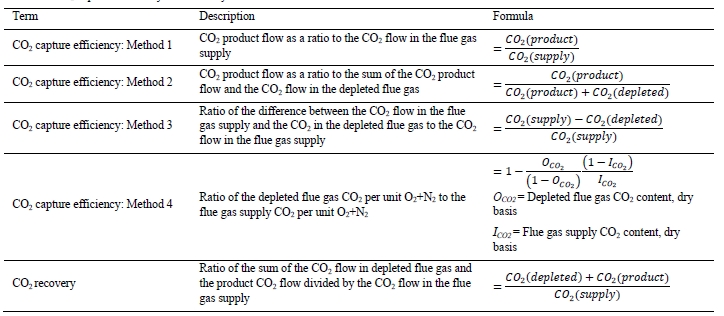
Table 3. CO2 capture efficiency and recovery calculations.
The depleted flue gas flow measurement is not yet a reliable measurement. A value can be calculated for the depleted flue gas flow by assuming that the oxygen and nitrogen entering the absorber with the flue gas supply leaves in the depleted flue gas. The depleted flue gas temperature may be used to calculate saturated water content. The depleted flue gas CO2 concentration may be used to calculate CO2 flow. Note that these are essentially the same assumptions as those used for Method 4, hence the Method 3 and Method 4 calculations result in essentially identical CO2 capture rates. Using the calculated flow of depleted flue gas allows an estimate of the CO2 recovery to be calculated.
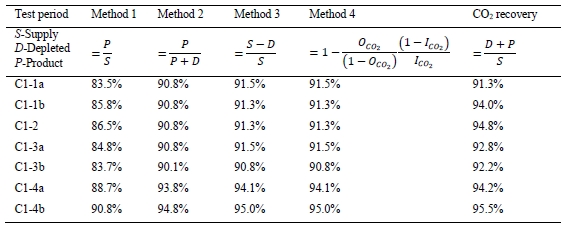
Table 4 shows the four calculations of CO2 capture and recovery for the base-case test periods (using the calculated value for depleted flue gas flow). The first thing to note is that all calculated CO2 captures were fairly steady for the first three days of operation (test periods C1-1a to C1-3b). The CO2 capture on the last day (C1-4a, C1-4b) was significantly higher by approximately 3–4 percentage points. The CO2 recovery (mass balance) was neither greater than 95.5% nor as low as 91.3%. Note also that the CO2 capture calculated by Method 1 is always less than the CO2 capture calculated by Methods 2, 3, and 4. These two facts suggest that either quantification of CO2 flow in the CHP flue gas supply is biased high or that calculation of CO2 flow in the product is biased low.
The uncertainty in measurement of flow and composition propagate into uncertainty in the CO2 capture. The uncertainty calculations and representative results from the each of the calculation methods are shown in Table 5. The following assumptions are used:
- Flow metering uncertainties are those theoretically estimated and calculated by internal work at TCM DA for the indicated flow meters [1]
- Concentration uncertainties for the flue gas flows are those aforementioned
- Concentration uncertainty for the product CO2 is arbitrarily assigned to be 2%, which allows for actual CO2 content as low as 98%
- CO2 capture percentage of 90% is representative of that measured during base-case testing. (The calculation is not particularly sensitive to this parameter between 85 and 95%.)
A few notes on the CO2 capture uncertainty results:
- The uncertainty in CO2 capture is almost all due to uncertainty in CO2 content of the CHP flue gas supply for the assigned total flow uncertainties. The CO2 capture uncertainty is relatively insensitive to both the product CO2 content uncertainty and the depleted flue gas CO2 content uncertainty.
- The fact that CO2 recovery is less than 100% suggests that one or more of the flows has a significant bias error than calculated from instrument specifications. Hence the need for a relative accuracy test audit of the pertinent flow meters to assign more realistic uncertainties. These are likely to be higher than the calculated values, which will increase overall CO2 capture uncertainty above that indicated in Table 5.
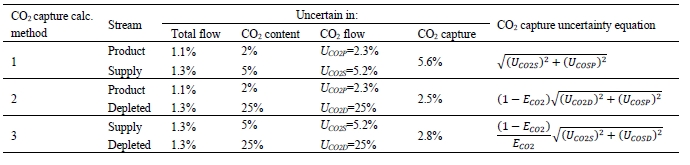
Table 5. Uncertainty in CO2 capture as a function of flow/composition measurement uncertainty (Nominal CO2 capture of ECO2 = 90%).
The heat released in the reboiler is calculated as the difference between steam enthalpy at the measured reboiler inlet temperature (T) and pressure (P) and saturated water enthalpy at the reboiler condensate temperature. The pertinent data are given in Table 6.
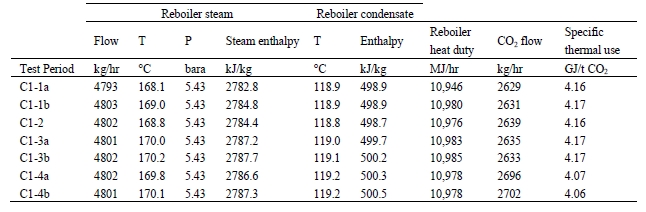
Table 6. Stripper reboiler thermal use calculation
The thermal steam consumption data give in Table 6 are based on aqueous 30 wt% MEA solvent system without the addition of any anti-foam solution. Upon addition of anti-foam solution and increase of the MEA solvent concentration during the MEA test campaign at TCM DA, the steam consumption was further reduced during CHP flue gas treatment, as described by Brigman et al [2]. Those tests were not a part of the current IVP work. Additionally, TCM DA has a LVC system installed; however, this system was not operated during Base-Case test and is consequently also not a part of the current IVP work. LVC systems have previously been showed by Knudsen et al. [4] to substantially decrease the thermal steam consumptions during amine plant operations with the aqueous MEA solvent systems.
5.3 Process contaminants
FORCE Technology measured gas-phase concentrations of the compounds listed below and the results are provided in Table 7. During the base-case testing time period, the CHP plant received refinery gas from the Mongstad refinery, which was, to some extent, co-fired with the natural gas.
- SO2 concentrations were measured on different days. The CHP flue gas supply SO2 concentrations are very low as are concentrations in the other streams.
- H2SO4 concentrations were measured in the two flue gas streams on different days. The flue gas H2SO4 concentrations are very low as are concentrations in the other streams. The H2SO4 concentrations were determined by extracting aqueous H2SO4 containing droplets, referred to as SO3 mist droplets, on a heated filter.
- NOx concentrations were below detectable limits for all streams
- Total particulates concentrations were measured on different days. The CHP flue gas supply total particulate concentrations are very low and were below detection limit in the depleted flue gas.
- Acetone, acetaldehyde, and formaldehyde were measured in the depleted flue gas and the product CO2 stream on separate days. The emissions concentrations of acetone and the aldehydes are higher in the product CO2 than the depleted flue gas, likely due to the low temperature boiling point nature of these compounds.
- NH3 concentrations were measured for both depleted flue gas and product CO2. The results indicated emissions of NH3, likely arising from MEA degradation process occurring in the solvent system.
- MEA concentrations were determined by iso-kinetic sampling conducted by TCM DA personnel and further sample analysis by the TCM DA laboratories. The MEA concentrations in the depleted flue gas are very low, and were below the emission limits set by the Norwegian environmental authorities (Miljødirektoratet). [3]
- MEA degradation products were determined by iso-kinetic sampling from the depleted flue gas and product CO2 by FORCE Technology and further laboratory analysis. The concentrations of any nitrosamines and nitramines were all below detection limits for both the depleted flue gas and the CO2 product. [3] The emissions of MEA degradation products were below the emission limits set by the Norwegian environmental authorities.
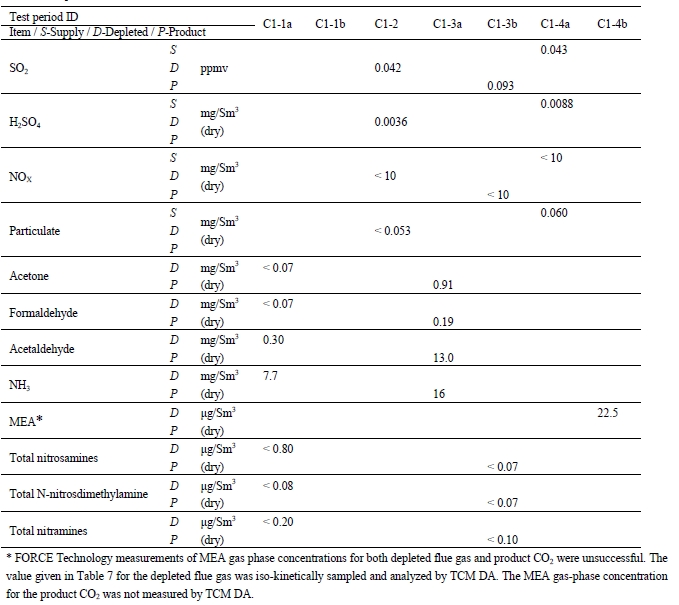
Table 7. Gas-phase concentrations.
5.4 Process stream information
Additional amine plant process information for the base-case test is given in Appendix A. This information is not covered by the current IVP work, but is given for the convenience of the reader.
6. Conclusions
IVP work has been conducted at CO2 Technology Centre Mongstad during treatment of flue gas from a natural gas-fired combined heat and power (CHP) plant. The testing is referred to as the base-case testing, applying an aqueous 30 wt% MEA solvent system treating flue gases with a flow rate of about 47.000 Sm3/hr and a CO2 content of about 3.5%. For the base-case considered, the CO2 capture was about 90% and the thermal steam consumption was about 4.1 GJ/t-CO2. Emissions of MEA were very low and MEA related degradation products were all below detection levels, and all within the emission limits set by the Norwegian environmental authorities. The current work may be considered an independently verified baseline for a non-proprietary PCC amine-based solvent system.
The following process aspects were not considered in the current IVP work:
- Long-term performance indices such as heat exchanger fouling, mass transfer packing fouling, foaming, material corrosion, solvent quality control measures, solvent loss/replacement, etc.
- Use of anti-foam solution, which has proven to reduce the thermal steam consumptions at TCM DA
- Use of the installed lean vapor compressor system at TCM DA.
These aspects warrant further (IVC) work and studies in order to gain better understanding of the performance potential of the aqueous MEA solvent system as a non-proprietary PCC system.
Acknowledgements
The authors gratefully acknowledge the staff of TCM DA, Gassnova, Statoil, Shell, Sasol, and Aker Solutions for their contribution and work at the TCM DA facility.
The authors also gratefully acknowledge Gassnova, Statoil, Shell, and Sasol as the owners of TCM DA and Aker Solutions for their financial support and contributions.
Espen S. Hamborg et al. / Energy Procedia 63 (2014) 5994 – 6011 6009
Appendix A. Amine plant process information
Table 8 provides the amine plant main process information averaged over the base-case test time period. Process fluctuations, generally attributed to fluctuations in the CO2 content of the CHP flue gas, cannot be derived from the given values.
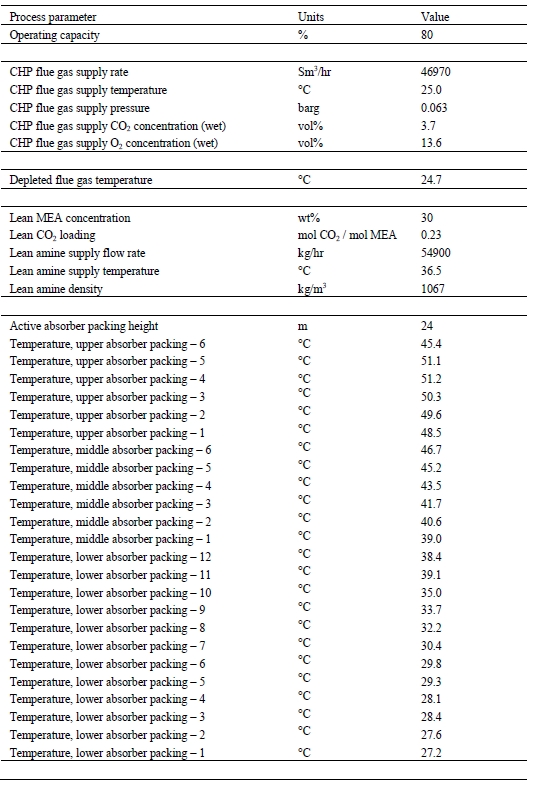
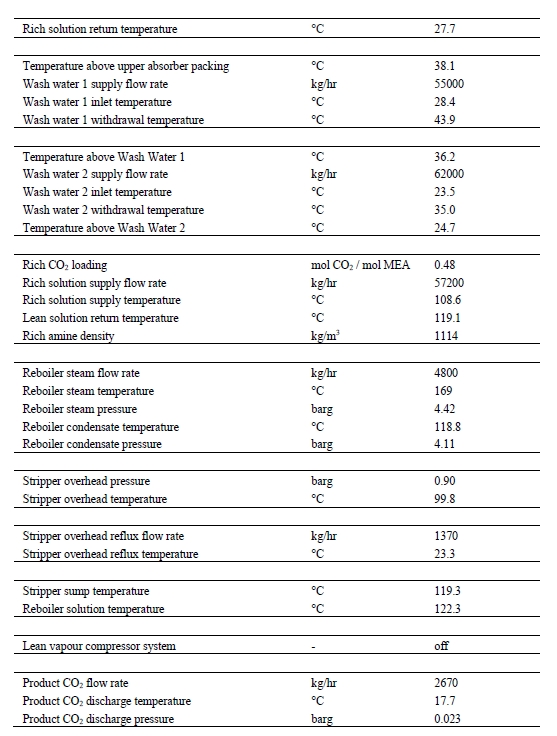
Table 8. Typical amine plant process information during Base-Case testing.
References
- Thimsen D, Maxson A, Smith V, Cents T, Falk-Pedersen O, Gorset O, Hamborg E S. Results from MEA testing at the CO2 Technology Centre Mongstad. Part I: Post-Combustion CO2 capture testing methodology. Energy Procedia; 2014.
- Brigman N, Shah M I, Falk-Pedersen O, Cents T, Smith V, De Cazenove T, Morken A K, Hvidsten O A, Chhaganlal M, Feste J K, Lombardo G, Bade O M, Knudsen J, Subramoney S C, Fostås B F, De Koeijer G, Hamborg E S. Results of amine plant operations from 30 wt% and 40 wt% aqueous MEA testing at the CO2 Technology Centre Mongstad. Energy Procedia; 2014.
- Morken A K, Nenseter B, Pedersen S, Chhaganlal M, Feste J K, Tyborgnes R B, Ullestad Ø, Ulvatn H, Zhu L, Mikoviny T, Wisthaler A, Cents T, Bade O M, Knudsen J, De Koeijer G, Falk-Pedersen O, Hamborg E S. Emission results of amine plant operations from MEA testing at the CO2 Technology Centre Mongstad. Energy Procedia; 2014.
- Knudsen J N, Andersen J, Jensen J N, Biede O. Evaluation of process upgrades and novel solvents for the post combustion CO2 capture process in pilot-scale. Energy Procedia 2011;4:1558-1565.