
2. Results from CESAR-1 Testing with Combined Heat and Power (CHP) Flue Gas at the CO2 Technology Centre Mongstad (2021)
Scott A. Hume,2* Muhammad I. Shah,1 Gerard Lombardo,1 and Eirik Romslo Kleppe1
1Technology Centre Mongstad (TCM), 5954 Mongstad, Norway 2Electric Power Research Institute, Inc., 3420 Hillview Avenue, Palo Alto, CA 94394, USA *Corresponding author
Abstract

Technology Centre Mongstad (TCM) houses a demonstration-scale test facility for CO2 capture solvents termed the “amine plant,” where multiple test campaigns have been performed on numerous solvents that the owners of TCM, TCM DA, have conducted since its inauguration in 2012. The large number of public, industrial, research, and academic participants involved in these campaigns have enriched the projects and ensured that the significant results serve a broad audience. The main objective of these campaigns was to produce knowledge that can be used to reduce the cost as well as the technical, environmental, and financial risks for the commercial-scale deployment of post- combustion CO2 capture (PCC). This includes demonstration of a model-based control system, dynamic operation of the amine plant, investigation of amine aerosol emissions, and establishment of the baseline performance with monoethanolamine for residual fluid catalytic cracker (RFCC) and combined-cycle gas turbine (CCGT)-based combined-heat-and-power plant (CHP) flue gases. The RFCC flue gas is sourced from a nearby Equinor refinery that emulates coal flue gas in composition with 13%–14% vol CO2 content and the CHP flue gas represents flue gas from CCGT power plants with a 3.5% vol CO2 content. In addition to baseline testing, specific tests targeted at reducing CO2 avoided cost have also been conducted utilizing both flue gas sources. This paper focuses on the testing of the CESAR-1 solvent, a blend of 2-amino-2-methyl-1-propanol and piperazine.
The Electric Power Research Institute, Inc. (EPRI) assessed the performance of the process using an independent verification protocol (IVP) developed previously. The IVP provides a structured testing procedure for assessing the thermal and environmental performance of PCC processes under normal operating conditions. Throughout the CESAR-1 testing, TCM manually collected extractive samples from the depleted flue gas and product CO2 outlets sequentially. As part of the IVP, EPRI also assessed critical plant instrumentation at TCM for accuracy and precision error based on a comparative analysis done during testing operations and against calibration checks.
The CESAR-1 process was evaluated during 16 individual test periods over four days in June 2020. During the tests, extractive samples were taken to measure process contaminants such as aldehydes, ketones, amines, and ammonia. Sulfur oxides and nitrogen oxides were continuously monitored using Fourier-transform infrared (FTIR) analysers on the depleted flue gas and product CO2 streams. TCM has installed multiple measurements (FTIR, non-dispersive infrared sensor, and gas chromatography) of the CO2 concentration allowing comparative confirmation during the test periods. The capture rate was calculated via four methods along with evaluation of the CO2 recovery, which is indicative of the overall mass balance. The overall thermal performance (energy consumption) was assessed based on measured data taken during each of the sampling periods. The CO2 capture rate achieved during the CESAR-1 testing was 97–99%, with steam reboiler duties of 3.41–3.54 GJ/tonne CO2, and the CO2 gas mass balance closures were close to 100%. These data and the associated assessments, along with the results of TCM sampling during these tests, are presented in this paper.
1. Introduction
The Technology Centre Mongstad (TCM) is located next to the Equinor refinery in Mongstad, Norway. TCM DA is a joint venture owned by Gassnova representing the Norwegian state, Equinor, Shell, and TotalEnergies. TCM is home to one of the largest post-combustion CO2 capture (PCC) test centers in the world. This facility entered the operational phase in August 2012 and is dubbed the “amine plant.”
A unique aspect of the facility is that either a flue gas slipstream from a natural gas-fired combined-heat-and-power (CHP) plant or an equivalent volumetric flow from a residual fluid catalytic cracker (RFCC) unit can be used for CO2 capture. The CHP flue gas contains about 3.5 vol% CO2 and the RFCC flue gas contains about 13–14 vol% CO2, the latter of which is comparable to CO2 levels seen in a coal-fired flue gas. The amine plant, designed and constructed by Aker Solutions and Kværner, is a highly flexible and well-instrumented facility that can accommodate a variety of technologies with capabilities of treating flue gas streams of up to 60,000 Sm3/hr.
The plant is offered to developers of solvent-based CO2 capture technologies to test the performance of their solvent technology and to verify systems aimed to reduce the atmospheric emissions and environmental impact of solvent emissions and degradation products from these processes.
The objective of TCM DA is to test, verify, and demonstrate CO2 capture technologies suitable for deployment at full scale. A significant number of vendors, including Aker Solutions, Alstom (now GE Power), Cansolv Technologies Inc., and Carbon Clean Solutions Ltd., have already successfully tested using the TCM DA facilities to assess their CO2 capture technologies.
Multiple tests using the CESAR-1 solvent have been carried out at TCM to define the baseline performance of the solvent for defined operating conditions using CHP flue gas boosted to 5 vol% CO2 content using recycle in accordance with an independent verification protocol (IVP), which provides a structured testing procedure, developed by the Electric Power Research Institute, Inc. (EPRI) [1]. These tests are compared with prior MEA testing at TCM using the CHP flue gas without recycle at 3.5 vol%.
2. Amine Plant
The TCM 234 tonnes-CO2/day amine plant was designed to be flexible to allow testing of different configurations. The amine plant is configured to remove CO2 from a natural gas-fired combustion turbine-based CHP plant flue gas or a RFCC off-gas. The typical characteristics of these two flue gas streams are shown in Table 1.
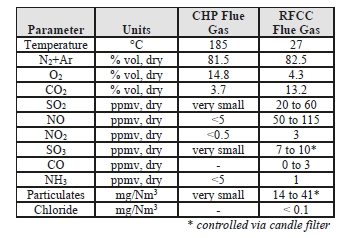
Table 1: Nominal characteristics of flue gas supplie.
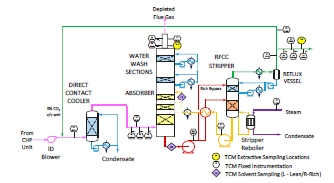
For these tests, a portion of the product CO2 was recycled to the CHP flue gas inlet stream in a controlled way to maintain the incoming CO2 concentration at 5% vol, dry. A process flow diagram showing high-level equipment contained within the amine plant along with key existing instrumentation is shown in Figure 1.
Major systems include:
- An induced draft (ID) blower to overcome pressure drops and blow the flue gas through the plant with an output capacity of up to 270 mbar and 70,000 Sm3/hr.
- A direct-contact cooler (DCC) system to initially lower the temperature of and saturate the incoming flue gas by a counter-current water flow to improve the efficiency of the absorption process and provide pre- scrubbing of the flue gas. The DCC system has two individually operated packed columns for operations with the CHP flue gas and the RFCC flue gas, respectively. The DCC column designed for CHP gas operations is 3-m diameter and a total 16 m height. The section where water counter currently contacts the flue gas is 3.1 m high with Flexipac 3X structured stainless- steel packing of Koch Glitsch.
- An absorber to remove CO2 from the flue gas. The absorber has a rectangular, polypropylene-lined concrete column with a 3.55 x 2 m cross-section and a total height of 62 m. The lower regions of the tower, where the amine solution contacts the flue gas, consist of three sections of Koch-Glitsch Flexipac 2X structured stainless-steel packing of 12 m, 6 m, and 6 m of height, respectively. Water-wash systems are located in the upper region of the tower to scrub and clean the flue gas, particularly of any solvent carry over, and consist of two sections of Koch-Glitsch Flexipac 2Y HC structured stainless-steel packing, each 3 m in height. The lower water-wash section is used to cool the depleted flue gas for overall plant water balance by adjusting the temperature of the circulating water. The uppermost water-wash section was operated as an adiabatic acid-wash stage for further emission mitigation. Liquid distributors, liquid collector trays, and mesh mist eliminators (Koch-Glitsch) are located at various locations in the tower, and the final mesh mist eliminator at the top of the tower is by Sulzer. The CO2 depleted flue gas exits the absorber column to the atmosphere through a stack located at the top of the column.
- Stripper columns to recover the captured CO2 and return CO2-lean solvent to the absorber. The amine plant consists of two independent stripper columns with a common overhead condenser system. The two stripper columns are operated independently considering the CO2 content in the flue gas due to column design, hydraulics, and gas velocity effects. The smaller diameter stripper column is used when treating CHP flue gas or RFCC gas diluted with air, whereas the larger diameter column is used when treating flue gases of undiluted (i.e., higher CO2 content) RFCC gas or when operating with CHP using CO2 recycle, as is the case with these tests. The CHP stripper is 1.25 m in diameter and 28 m in height tangent-to-tangent. The RFCC stripper is 2.2 m in diameter and is also 28 m tangent-to-tangent. The lower regions of both stripper columns, where the amine solution is stripped, consist of Koch-Glitsch Flexipac 2X structured stainless-steel packing 8 m high. The upper regions of the strippers consist of a rectifying water-wash section of Koch-Glitsch Flexipac 2Y HC structured stainless-steel packing 1.6 m high. Liquid distributors, liquid collector trays, and mesh mist eliminators (all by Koch-Glitsch) are located at various locations in the strippers. Each stripper column is connected to its respective steam-heated reboiler, providing the necessary heat required for the stripping process. Both strippers circulate solvent to the reboilers by thermosiphon. The RFCC stripper also has a circulating pump to assist at low-load operation and during startup. The RFCC reboiler is a shell-and-tube arrangement and the CHP reboiler is a plate-in shell heat exchanger.
- A lean-solvent trim cooler that uses seawater to cool the lean solvent leaving the cross heat exchanger to a desired temperature before admission to the absorber column.
- A set of pumps used to move the CO2-lean and CO2-rich solvent streams between the absorber and stripper and through a cross heat exchanger to recover heat from the lean stream.
- A reflux drum, condenser, and pumps to dry the product CO2 that exits the stripper. A portion of the product CO2 can also be recycled back to the inlet of the CHP DCC to increase the concentration of the CO2 in the inlet flue gas stream when using CHP flue gas.
The TCM facility can test virtually any PCC solvent- based process as the amine plant has been designed to accommodate a variety of technologies. The facility also has excellent instrumentation and an on-site lab for detailed analysis.
An IVP was developed to be used as part of the overall performance assessment of amine-based processes and has been updated over time to apply to either CHP or RFCC operation on the TCM amine facility. The IVP is designed to provide a structured testing procedure for assessing thermal and environmental performance of PCC processes under normal operating conditions. Uncertainty for key flow measurements was carried out as part of the IVP previously [2].
3. CESAR-1 CHP Campaign Overview
The CESAR-1 solvent is a blend of 2-amino-2-methyl-1- propanol (AMP) and piperazine (PZ). CHP flue gas capture performance assessment periods were conducted in June 2020. During the testing, personnel from TCM manually collected extractive samples from the depleted gas outlet and the product CO2 line downstream of the RFCC stripper. In previous tests, this was sometimes performed by an independent testing contractor.
However, TCM’s competency related to performing this testing was deemed adequate by EPRI during prior monoethanolamine (MEA) baseline campaigns, especially since TCM is not commercially involved in the outcome and hence can be considered to be unbiased.
Data logs for all sampling periods containing pertinent flows, temperatures, pressures, and concentrations measured by permanent plant instruments were supplied by TCM for the entire test period. The sampling time periods, and sampling period designators are shown in Table 2 along with additional sampling undertaken on each day.
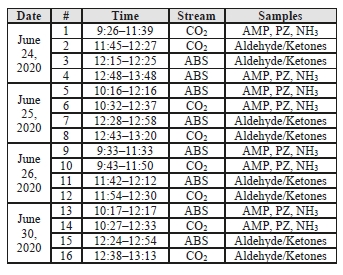
Table 2: CESAR-1 CHP sampling periods.
The plant operated in a stable condition through the entire test period, as shown in Figures 2 and 3 with controlled flue gas flow at 59,000 Sm3/h and CO2 controlled at 5 vol%, dry using recycled product gas.
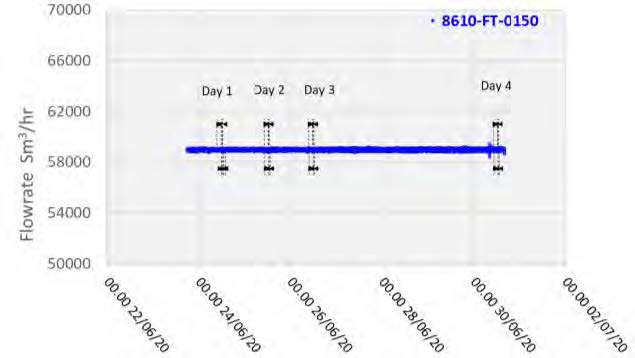
Figure 2: Flue gas flowrate through testing period.
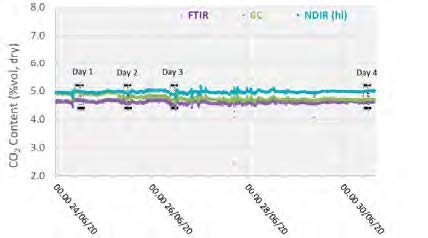
Figure 3: Inlet CO2 concentration through testing period.
3.1 CO2 Capture Efficiency and Recovery
CO2 capture efficiency can be quantified in several ways depending on how measurements have been taken and the expected accuracy of each individual measurement. Using different combinations of the measured parameters at the boundary of the process, four individual methods can be applied as detailed in Table 3.
These methods can rely on combinations of the available information to determine a capture efficiency, using the measured gas flowrates in combination with the CO2 analyzer measurements.
Method 4 simplifies the measurement uncertainty by utilizing only CO2 concentration data and making the well-founded assumption that all incoming inert gases (such as nitrogen and oxygen) will be unchanged through the absorption process. Hence, Method 4 can be used to compare against the other methods that utilize the flow measurements.
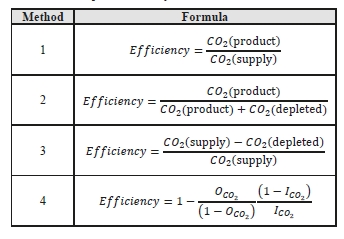
Table 3: CO2 capture efficiency calculation methods.
The “CO2 recovery” calculation is defined as the ratio of
the sum of the CO2 flow in depleted flue gas and the
product CO2 flow divided by the CO2 flow in the flue gas
supply.
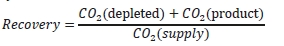
The CO2 recovery is a measure of the closure of the CO2 mass balance, being the fraction of CO2 mass flow in the
flue gas supply that is accounted for by measured CO2 mass flows in the depleted flue gas and product CO2.
Table 4 shows the four calculation methods of CO2 capture and recovery for the test periods. Note that CO2
product flow can be based on either the measured CO2 product flow or by using the difference between the nondispersive infrared-measured CO2 supply and depleted flows. CO2 capture rates calculated by all methods were in good agreement within each test period. It should be noted that Methods 3 and 4 are equivalent due to using the conserved oxygen and nitrogen method for outlet gas flow determination.
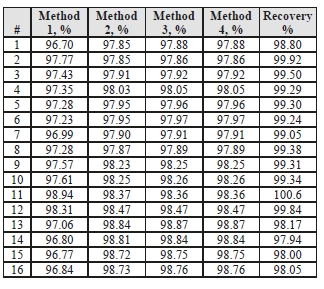
Table 4: CESAR-1 CHP sampling periods.
Regardless of the method used, the CO2 capture rate was consistently >96% as measured during all test periods. As the recovery rate was close to 100%, this implies consistency between the flue gas measurements and CO2 concentration determination at all 3 locations.
3.2 Thermal Use
The reboiler heat duty or the heat released in the reboiler is calculated as the difference between steam enthalpy at reboiler inlet and the saturated water enthalpy at the reboiler condensate temperature. The specific thermal use (STU) is then calculated by dividing the reboiler heat duty by the product CO2 flow.
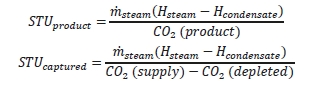
The two corresponding values for specific thermal energy consumption are shown in Table 5 and were consistent during all test periods.
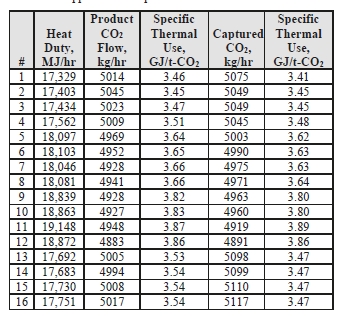
Table 5: Stripper reboiler specific thermal use.
Prior testing at TCM using conventional 5M MEA solvent with CHP flue gas (3.5 vol% CO2) at approximately an 80 tonnes-CO2/day load yielded a regeneration energy range of 3.61–3.66 GJ/t-CO2 using the product CO2 flow and 3.58–3.60 GJ/t-CO2 using the capture method, all carried out at 85% capture rate [3]. The CESAR-1 CHP tests (5 vol% CO2) achieved circa 119 tonnes-CO2/day load and achieved a regeneration energy range of 3.45–3.87 GJ/t-CO2 using product flow and 3.41–3.89 GJ/t-CO2 using the gas-side difference method.
It can be seen that the regeneration energy initially was near the bottom of the range for Tests 1 to 4 on June 24, and steadily increased in subsequent Tests 5 to 12. It was identified by TCM that excess foam formation in the stripper caused additional water condensation in the overhead stripper and an associated steam consumption increase. An antifoam agent was injected in the morning of June 30 by TCM operators with a subsequent rapid reduction in the regeneration energy measured in Tests 13 to 16, implying that the baseline CHP CESAR-1 regeneration energy is more in the range of 3.45–3.54 GJ/t-CO2 using product flow and 3.41–3.48 GJ/t-CO2 using the gas-side difference method when foaming is absent.
Importantly, the capture rate is 98% for these tests, far higher than the 85% capture rate for the MEA baseline tests, showing CESAR-1 solvent performs well at high capture rates as the regeneration energy is lower than MEA (when foaming was controlled) despite a capture rate of nearly 100%.
Recent testing at the Niederaussem pilot plant showed CESAR-1 solvent at 98% capture rate required only 3.22 GJ/tonne regeneration energy, however the inlet CO2 concentration was 15.2% vol, dry as the flue gas source is from coal combustion [4]. Although the lower CO2 concentration during these tests resulted in higher regeneration energy than observed at Niederaussem, some of the difference can also be attributed to the use of the RFCC stripper for these tests that is oversized for this regeneration load, operating at only 50% capacity. The CHP stripper was not used for these tests due to a combination of the 5% vol, dry inlet CO2 concentration and the targeted 98% capture rate.
3.2 Process Contaminants
3.2.1 Aldehydes and Ketones
Formaldehyde, acetaldehyde, and acetone concentrations were determined by extractive sampling during the CESAR-1 CHP test periods. The data are shown in Table 6 for the depleted flue gas and in Table 7 for the CO2 product.
Table 6: Depleted flue gas aldehyde/ketone concentrations.
The formaldehyde levels are lower than the previous MEA CHP baseline testing, which measured concentrations of 0.72 mg/Sm3 by an external contractor. The acetaldehyde levels are also considerably lower with CESAR-1 than the MEA CHP test samples of 16 mg/Sm3.
Acetone levels measured during the MEA tests were sufficiently low at or below the detection limit of 1 mg/Sm3, while with CESAR-1 they were measurable at between 1–3 mg/Sm3 even though the upper water wash was configured as an acid wash for these tests and not in the MEA campaign These species were also measured continuously with the Proton-Transfer-Reaction mass spectrometer (PTR-MS) that exhibits a very low detection limit capability (measuring in the ppb range). A sample of the data collected is shown in Figure 4, with higher formaldehyde levels (700–800 ppb) than measured by extractive samples (20–50 ppb), and comparable acetaldehyde and acetone measurements.
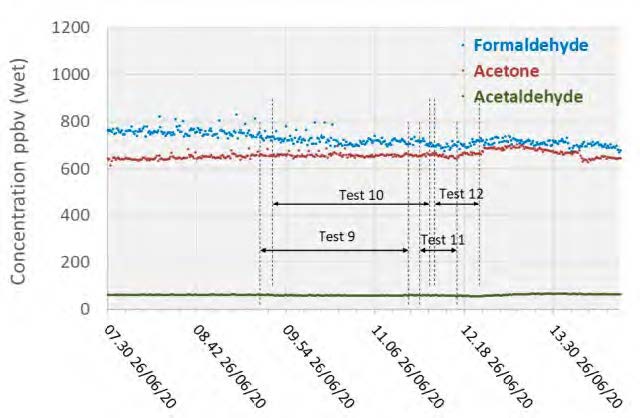
Figure 4: Depleted flue gas PTR-MS aldehyde and ketone measurements.
For the CO2 product, the formaldehyde levels detected were 2–4x higher than the manual-sampled measurements during the MEA CHP baseline campaign (0.14 mg/Sm3) and the acetaldehyde levels were considerably lower than the previous level of 150 mg/Sm3 measured for MEA.
Unlike the MEA tests, acetone was easily detected in the CO2 product for CESAR-1, whereas in the previous MEA baseline all measurements taken were below the detection limit of 0.9 mg/Sm3.
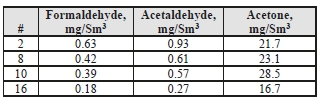
Table 7: Product CO2 aldehyde/ketone concentrations.
The concentration of the depleted flue gas will be impacted by the CO2 recycle stream, passing a portion of the contaminants shown back to the absorber inlet. With the exception of acetone, these components in the flue gas for the CESAR-1 testing were significantly lower than previous MEA measurements. This in turn suggests that these components are not significant degradation compounds from AMP and PZ, or that these solvents were not degraded to the same condition as for MEA.
3.2.2 Ammonia and Solvent Components
TCM measured concentrations of solvent components (AMP and PZ) along with ammonia during the CESAR- 1 testing. Results of these manually extracted samples are shown in Table 8.

The solvent components of CESAR-1 appear to show higher vapor pressure than is associated with MEA solvent, which was previously measured by an external contractor at 0.006 mg/Sm3 during testing on CHP flue gas. PZ was barely detected, only showing up in Test 4, which shows that perhaps a longer extraction sample period would help to improve determination of this species at the ppb level. Ammonia levels are far lower than the previous MEA CHP tests results, measured at 13 mg/Sm3, suggesting that ammonia does not represent a significant degradation product of CESAR-1.
With the exception of the first test, the AMP measurements were lower than the extractive samples. However, both strategies were likely near their method detection limits as levels were measured below 20 ppb in all cases. PZ was not detected by the PTR-MS instrument and hence was not included in Figure 5, however Acetonitrile was detected at 0.1 ppmv.
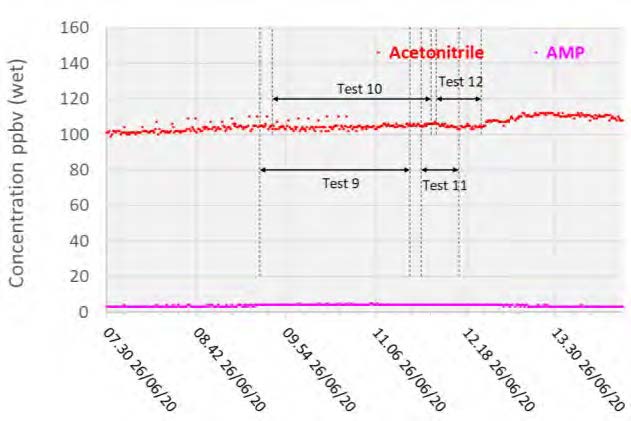
Figure 5: Depleted flue gas PTR-MS solvent measurements.
Extractive solvent and ammonia samples were taken from the CO2 product, and the results are shown in Table 9.
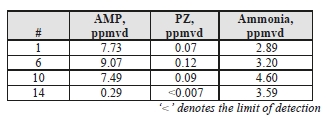
Table 9: Product CO2 ammonia and solvent component concentrations.
Similar to the depleted flue gas measurements, the AMP measurements were higher than the equivalent MEA samples, at 0.076 mg/Sm3, and up to 2 orders of magnitude higher for AMP. PZ was detected in 3 of the 4 samples, but was present at very low concentrations.
Although ammonia desorption into the product gas is 2 orders of magnitude higher than the depleted flue gas levels, this is 4 times lower than the ammonia detected from the MEA CHP tests at 16 mg/Sm3.
3.3.3 SO2 and NOx
The TCM Fourier-transform infrared units installed for the flue gas supply and the depleted flue gas were configured to measure SO2, NO, and NO2 concentrations. The reported data are shown in Figures 6 and 7.
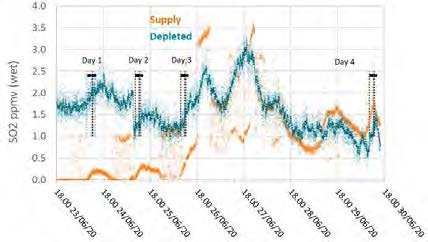
Figure 6: Supply and depleted flue gas SO2 measurements throughout the test period.
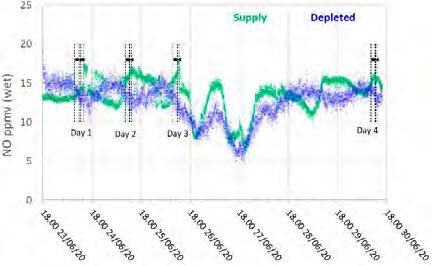
Figure 7: Supply and depleted flue gas NO measurements throughout the test period.
During previous MEA testing, SO2 levels leaving the absorber were consistently lower than the inlet measurement, likely due to absorption. This doesn’t appear to be the case for CESAR-1 solvent, though the inconsistency in the incoming flue gas data doesn’t allow a strong relationship to be established. Therefore, there was no way to determine SO2 absorption rates for this solvent from the tests.
The NO data shows similar levels at the inlet and outlet, indicating minimal absorption into the CESAR-1 solvent. While absorbed NO2 is known to contribute to the formation of nitrosamines in some solvents, the NO2 data for the depleted gas were not recorded for these test periods. The average measured values in the flue gas for both NO and SO2 leaving the absorber are shown in Table 10.
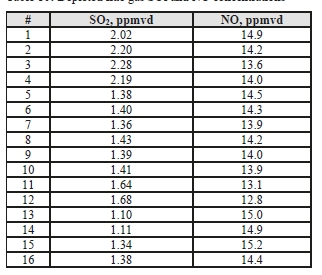
Table 10: Depleted flue gas SO2 and NO concentrations.
4. Conclusions
CESAR-1 solvent was tested at the TCM amine plant over 16 individual tests, during which extractive samples were taken, an overall summary of the tests is given in Table 11.
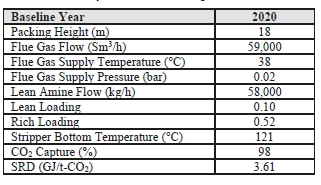
Table 11: Summary of CESAR-1 testing.
The plant was operated at 119 tonnes/day of CO2 production with capture rates of 96–99%, exhibiting a near 100% mass balance.
Foaming was identified as causing stripper performance issues; however, when foaming was controlled, the regeneration energy for CESAR-1 solvent was 3.41–3.54 GJ/t-CO2, lower than prior baseline testing of MEA at a lower capture rate of 85% at 3.58–3.66 GJ/t-CO2.
Degradation products including formaldehyde, acetaldehyde and ammonia, were measured at lower levels for CESAR-1 solvent with acid water wash compared to results from MEA testing. As the solvent is a blend of AMP and PZ, both species were sampled showing higher levels of AMP than was measured for MEA and PZ being barely detectable due to the low vapor pressure of PZ.
5. Acknowledgements
The authors gratefully acknowledge the staff of TCM DA, Gassnova, Equinor, Shell, and Total for their contribution and work at the TCM DA facility.
The authors also gratefully acknowledge Gassnova, Equinor, Shell, and TotalEnergies as the owners of TCM DA for their financial support and contributions.
6. References
- Thimsen et al., Energy Procedia 63, 5938–5958; 2014.
- Flue Gas Composition and Energy & Mass Balance Accuracy Studies at CO2 Technology Centre Mongstad (TCM DA): Results Related to the Amine Capture Unit.” K-E Frøysa and R. Sakariassen.CRM-12-F14016-RA-2: 7 June 2012
- Faramarzi et al., Energy Procedia 114, 1128–1145; 2017.
- Moser et al., ALIGN-CCUS: Results of the 18- Month Test with Aqueous AMP/PZ Solvent at the Pilot Plant at Niederaussem – Solvent Management, Emissions and Dynamic Behavior. Proceedings of the 15th Greenhouse Gas Control Technologies Conference 15-18 March 2021, http://dx.doi.org/10.2139/ssrn.3812132