
4. Results from MEA testing at the CO2 Technology Centre Mongstad: Verification of baseline results in 2015 (2016)
Leila Faramarzia,b,*, David Thimsenc, Scott Humec, Andrew Maxonc, Guillaume Watsond, Pedersen Sa, Erik Gjernese, Berit F. Foståsb, Gerard Lombardoe, Toine Centsf, Anne Kolstad Morkena,b, Muhammad Ismail Shaha,e, Thomas de Cazenovea, Espen Steinseth Hamborga,b
aCO2 Technology Centre Mongstad (TCM DA), 5954 Mongstad, Norway bStatoil ASA, P.O. Box 8500, 4035 Stavanger, Norway cElectric Power Research Institute, Inc., 3420 Hillview Avenue, Palo Alto, CA 34304, USA dShell Global Solutions International B.V., PO Box 663, 2501CR The Hague, The Netherlands eGassnova SF, Dokkvegen 10, 3920 Porsgrunn, Norway fSasol Technology, P.O. Box 5486, Johannesburg 2000, South Africa *Corresponding author
Abstract

In 2015, the CO2 Technology Center Mongstad (TCM DA) operated a post-combustion CO2 capture test campaign using aqueous monoethanolamine solvent at 30 weight%. The main objective was to demonstrate and document the performance of the TCM DA amine plant located in Mongstad, Norway.
During the treatment of flue gas from the natural gas-fired combined heat and power plant at Mongstad, a revised baseline was established for the TCM DA amine plant in accordance to the verification protocol developed by the Electrical Research Institute, Inc. This paper presents the revised baseline, which can be considered as a reference case for the solvent-based CO2 capture processes applied to natural gas-based flue gases.
1. Introduction
The CO2 Technology Centre Mongstad (TCM) is located next to the Statoil refinery in Mongstad, Norway. TCM DA is a joint venture set up by Gassnova representing the Norwegian state, Statoil, Shell, and Sasol. The facility run by TCM DA entered the operational phase in August 2012 and is one of the largest post-combustion CO2 capture (PCC) test centres in the world. A unique aspect of the facility is that either a flue gas slipstream from a natural gas- based combined heat and power (CHP) plant or an equivalent volumetric flow from a residual fluid catalytic cracker (RFCC) unit can be used for CO2 capture. The CHP flue gas contains about 3.5% CO2 and the RFCC flue gas contains about 13-14% CO2, the latter of which is comparable to CO2 levels seen in coal-fired flue gas. One of the main test plants at TCM DA is a highly flexible and well-instrumented amine plant. The amine plant was designed and constructed by Aker Solutions and Kværner to accommodate a variety of technologies, with capabilities of treating flue gas streams of up to 60,000 standard cubic meters per hour. The plant is being offered to vendors of solvent-based CO2 capture technologies to, among others, test: (1) the performance of their solvent technology; and
(2) technologies aimed to reduce the atmospheric emissions and environmental impact of amines and amine-based degradation products from solvent-based CO2 capture processes. The objective of TCM DA is to test, verify, and demonstrate CO2 capture technologies suitable for deployment at full-scale. A significant number of vendors, Aker Solutions, Alstom (now GE Power), Cansolv Technologies Inc., and Carbon Clean Solutions Ltd. have already successfully used the TCM DA facilities to verify their CO2 capture technologies.
From 6 July to 17 October 2015 TCM DA, in collaboration with partners, operated a monoethanolamine (MEA) campaign with the main objective to document and demonstrate the amine plant performance.
TCM DA investigated the stripper performance and concluded that the use of anti-foam made it possible to utilise the full flue gas supply capacity of 60,000 standard cubic meters per hour. At the full CHP flue gas capacity, the CO2 capture rate was about 85% when MEA at 30 weight% (wt%) was used. The corresponding specific reboiler duty (SRD) was about 3.6 GJ/ton CO2. Total and CO2 mass balance closures were near 100 %. Emission levels of MEA, NH3, aldehydes, nitrosamines, nitramines, and other compounds were also measured during extractive samples for the defined time periods and were all below the permissible levels set by the Norwegian Environment Agency (Miljødirektoratet).
During the treatment of the CHP flue gas at full capacity, a revised baseline was established for the TCM DA amine plant. The revised CHP baseline was verified by the Electric Power Research Institute, Inc. (EPRI).
EPRI has developed a structured CO2 capture testing methodology for characterizing PCC processes. EPRI’s methodology is designed to provide relevant information for baselining and comparing technologies, referred to as an independent verification protocol (IVP). This methodology has been tailored to the TCM DA amine plant facility and is presented in detail elsewhere [1].
The amine plant is planned and equipped for conducting research and development activities and TCM DA has recently installed a number of additional gas-phase analysers to improve the speed and accuracy of measurements. The IVP methodology has therefore been updated by EPRI to reflect these recently installed instruments.
The revised CHP baseline was verified by EPRI, following their requirements including the use of third-party gas phase and emission measurements done by FORCE Technology. FORCE Technology performed comprehensive measurements on flow rates, temperatures, and compositions on the absorber inlet, the absorber outlet (depleted flue gas), and the stripper outlet.
This paper will present the revised baseline for the TCM DA amine plant, in accordance to the IVP developed by EPRI.
2. Amine plant
The schematic of the TCM DA amine plant when treating the CHP flue gas is shown in Figure 1.
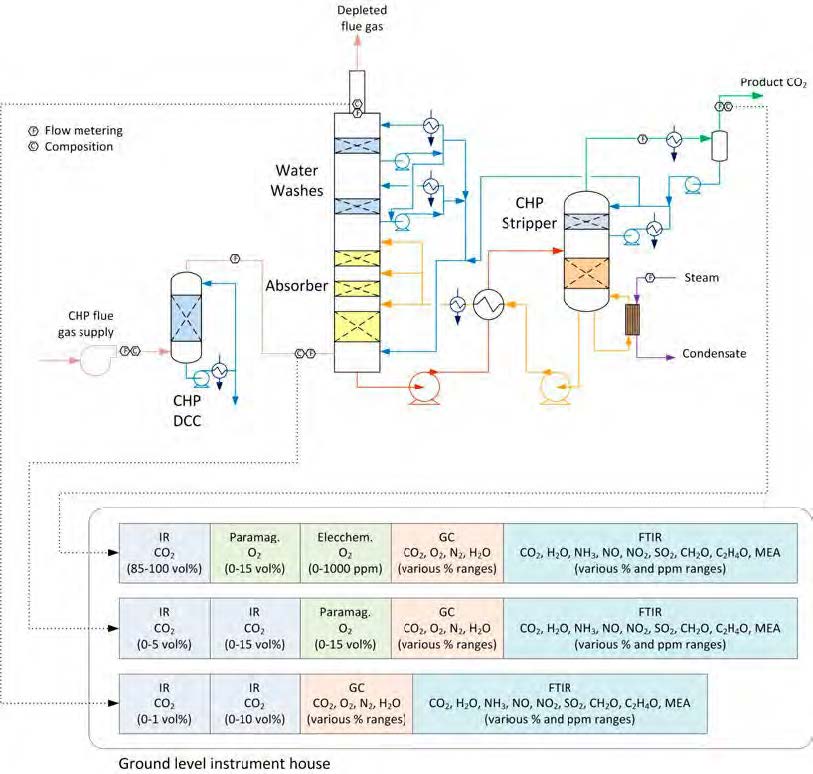
Figure 1. The TCM DA amine plant when treating the CHP flue gas.
The nominal CHP flue gas characteristics along with the existing instrumentations are specified elsewhere [2].
The main systems in the plant are also explained in detail in a previously published paper [1].
3. IVP project overview
The roles and responsibilities of the organizations that conducted the current IVP project are as follows;
- TCM DA is the project owner and organized the field testing during the test period. The test program for the baseline testing was developed by the owners of TCM DA. TCM DA personnel operated the plant throughout the testing and collected lean and rich liquid samples for laboratory analysis during the test period.
- FORCE Technology was contracted by TCM DA to collect and analyse samples from the CHP flue gas supply, depleted flue gas, and product CO2 streams. Two crews from FORCE Technology conducted the sampling sequentially with a single set of continuous emissions monitors (CEMs). FORCE Technology also collected gas samples for off-site analysis of particulate, SO2, SO3, amine, and degraded amine components.
- Laborelec carried out particulate concentration and size distribution measurements during the baselining period. Laborelec characterized the size of and the number of particles formed at different points through the absorber tower by using an electrical low-pressure impactor (ELPI+) device.
- EPRI was contracted by TCM DA to apply the IVP during the MEA baseline testing. Two EPRI engineers were on-site during the testing to observe the conduct of the tests. EPRI also led analyzing the results from the IVP project.
4. IVP
4.1 Approach
A detailed description of the IVP approach was previously reported [1]. A summary of the approach is provided here.
The purpose of the IVP is to measure and report key performance indices of the PCC process (those indices critical to up-scaling the process). Key performance indices (dependent parameters) include CO2 capture, CO2 production, emission, utility usage (steam, power and cooling), and trace constituents of the depleted flue gas and product CO2. The key performance indices depend on a number of independent parameters including: the overall process design, physical characteristics (and operating conditions) of process equipment, flue gas supply conditions and flow rate, lean and rich solutions conditions and flow rate, and stripper pressure.
Many of the dependent parameters can be modeled using commonly available chemical engineering computer process modeling tools. Field measurement of these key performance indices (along with the uncertainty in the measurements) can be used to calibrate the computer process models. Other dependent parameters (such as trace components in the depleted flue gas and product CO2) are difficult to model with currently available tools. Field measurements of these parameters will serve as primary data for up-scaling process designs.
The IVP approach to field performance testing is generally consistent with the approach taken by others for performance testing of a number of power processes [3]. The IVP specifies procedures for collecting composition, temperature, pressure, and flow data at TCM DA sufficient to calculate and report key performance indices and the corresponding numerical uncertainty in the values reported. Industry-accepted standard reference test methods are specified for the collection of composition, temperature, pressure, and flow data. Procedures for reducing the data are also specified. The IVP focuses on campaign-style testing in which days are dedicated to testing at previously selected optimum process operating conditions, but the IVP principles can also guide parametric testing undertaken to identify optimum process conditions.
4.2 MEA 2015 test campaign conduct
The second campaign of base-case testing of the performance of the TCM DA amine plant using a nominal 30% MEA as the solvent was conducted the week of 7 September 2015 after approximately eight weeks of operating the amine plant with the 30 wt% MEA solution. The plant was operated at steady state throughout the week.
FORCE Technology was on-site to manually collect contemporaneous samples from the flue gas supply, depleted flue gas, and product CO2. Laborelec was also on-site to manually collect samples for particulate and aerosol size distribution analysis at different locations through the absorber tower.
During all sampling periods the following data were collected:
- CO, CO2, NOX, O2, SO2, and N2 (by difference) concentrations in volume percent (vol%)
- Flow rate, pressure, and temperature.
The sampling time periods and sampling period designators are shown in Table 1 along with additional sampling undertaken on each day. Data logs for all sampling periods containing pertinent flows, temperatures, pressures, and concentrations measured by permanent plant instruments were supplied by TCM DA.
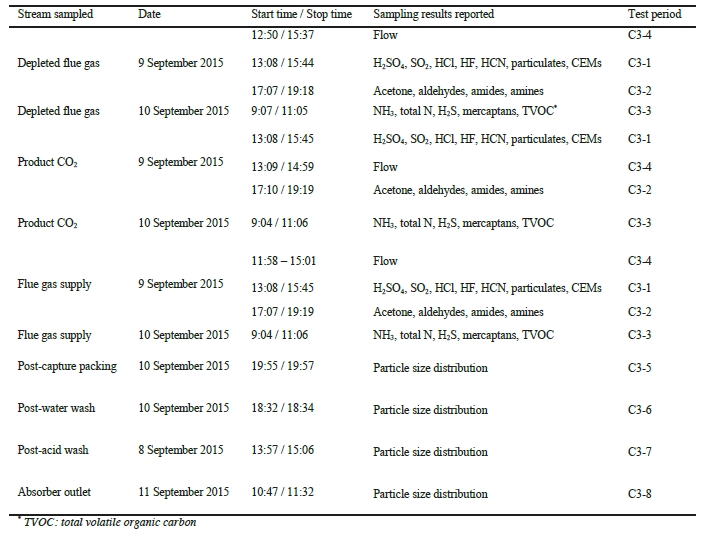
Table 1. FORCE Technology and Laborelec sampling periods.
5. Instrument assessment
An important component in the determination of process plant performance is the quality of the instrumentation installed for measuring the respective compositions and flow rates. Two measures of instrumentation quality are:
- Accuracy/bias: This represents the difference between the instrument reading (or average of a set of readings under unchanging process conditions) being assessed and the true value of the parameter being measured. Appropriate determination of the “true value” must be achieved by simultaneous measurement of the parameter using a reference method or instrument with calibration that can be traced to primary standards.
- Precision: A determination of the variability of the instrument reading when stream conditions are known to be steady state. Precision is therefore a measure of the random error associated with the measurement.
These measurement errors can be combined to assess the aggregate uncertainty in a given measurement. In the absence of a calibration against primary standards for the entire measurement range needed, the uncertainty published by the instrument supplier represents only the precision error.
When the process parameter being measured does not change, precision is a measure of repeatability. In real plant situations, it is often the case that the process parameters (flow, pressure, and temperature) do vary over the measurement period. Thus, measurements over long periods of time (greater than process time constants) will also include an error term related to process uncertainty.
5.1 Gas phase compositions
In the first baseline MEA in 2014, the CO2 and O2 content of the flue gas supply, depleted flue gas, and CO2 product stream were routinely determined by a single Fourier Transform Infrared (FTIR) instrument (Applied Instrument Technologies and Finetech, model: Anafin 2000) along with an O2 instrument (Siemens, model: Oxymat 6). Since these instruments were shared between the sampling points, a sampling system was installed to extract from the various single points as given by Thimsen et al. [1]. The sample was continuously drawn by a selection system serving the analysers and was diverted to the common analysers in a 90-minute cycle; i.e., the analyser cycles between flue gas supply for 15 minutes, depleted flue gas for 30 minutes, and CO2 product stream for 15 minutes, and an additional 30 minutes for purging operations.
Following the first MEA baseline campaign, TCM DA has since installed a number of additions to the gas measurement systems to improve the speed and accuracy of the measurements and widen the breadth of measurement techniques. To complement the original FTIR unit, two new additional Gasmet FTIR units (model: FCX) were installed, facilitating dedicated and continuous FTIR measurements at all three locations. Additionally, the CO2 concentration at the inlet and outlet of the absorber column was also determined by two non-dispersive infrared (NDIR) units (Siemens, model: Ultramat 6) at each location, one set to high range (vol%) and one low range (ppmv) on a dry-gas basis. A trace O2 instrument [Teledyne Instruments 3001] was installed to quantify O2 content of the product CO2. The system has been further complemented with a new Siemens Maxum Edition II gas chromatograph (GC) unit that is capable of measuring the CO2, O2, and nitrogen content at all three locations in a near-simultaneous fashion.
During the September 2015 operations, FORCE Technology carried out simultaneous analysis on three process streams (flue gas supply, depleted flue gas, and CO2 product stream). Comparison of the TCM DA values determined by the FTIR systems (after converting to dry basis assuming saturation at the measured pressure and temperature), NDIR analysers, and GC with the FORCE Technology data are given in Figure 2 and Figure 3. Details include:
- Figure 2 displays the CHP flue gas supply CO2 and O2 concentration data over the test campaign. There is good agreement between the FORCE Technology CO2 NDIR and the TCM GC CO2 measurements (<0.5% point difference) with the two TCM NDIR units showing a similar offset of 2% of the measured value (<0.08 vol%). The TCM FTIR CO2 average values compare well with the FORCE Technology measurements, however the instantaneous measurements showed significant scatter from the mean value (7% spread, representing ±0.3 vol%). The TCM FTIR O2 measurements agree more closely (less than 0.5 vol% dry O2) than the GC, which is over 1 vol% dry O2 higher in all measurement points. On the morning of 10 September 2015, the second O2 measurement period carried out by FORCE Technology has an overall similar offset as observed on 9 September 2015 following a morning calibration of the instrument.
- Figure 3 displays the depleted flue gas CO2 and O2 concentration data over the test campaign. The data from all of the TCM instruments closely track together, suggesting that the process CO2 concentration had a degree of variability (±0.2 vol%) during that operating period. The FORCE Technology measurements showed more variability than the TCM instruments. Data from all four TCM instruments are consistently higher than the FORCE Technology data by 10% to 25% (FTIR is the closest). The consistency in this bias, especially between the TCM NDIR and FORCE Technology NDIR instruments suggests either a difference in the calibrations of the respective instruments during the FORCE Technology campaign or, possibly, an anomaly in the FORCE Technology sampling system that diluted the sample with ambient air. It is also important to note that the FORCE Technology measurements of depleted flue gas CO2 were at or below the stated limit of detection of 0.5 vol%, although the NDIR was calibrated using “low-range” calibration gases and values down to 0.3 vol% were reported to a single significant figure to reflect the increased uncertainty of the measurements at these low levels.
- The product CO2 composition data reported by FORCE Technology had an O2 content of between 5-12 ppmv, far lower than the 1-2 vol% reported by FORCE Technology during the MEA campaign in February 2014 [4], which was thought to be contaminated by air in-leakage and subsequently disqualified. The TCM GC instrument measured nitrogen in the product with an average of 180 ppmv. For the purposes of calculating CO2 removal and recovery, it is assumed here that the product CO2 stream is saturated with water at the measured temperature and pressure and contains the small trace quantities of O2 and N2 measured. The balance is presumed to be CO2.
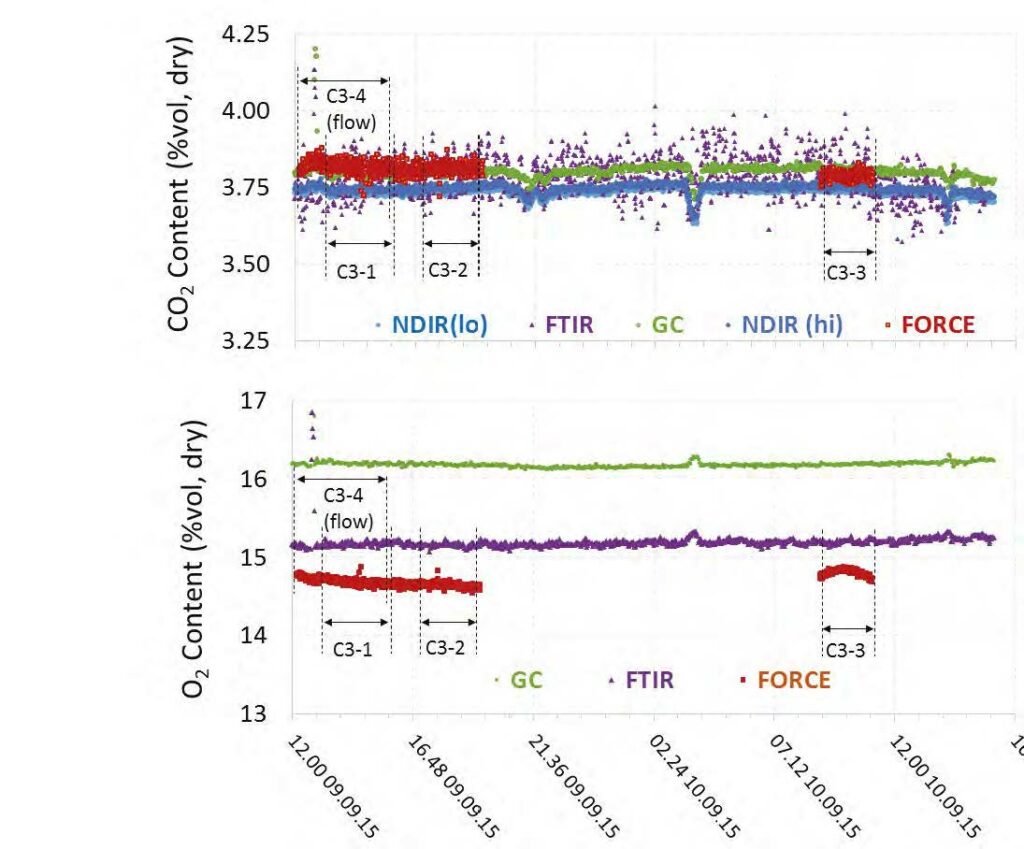
Figure 2. CHP flue gas supply CO2 and O2 data for all analysers. Data collected by FORCE Technology on 9 and 10 September 2015 are also shown.
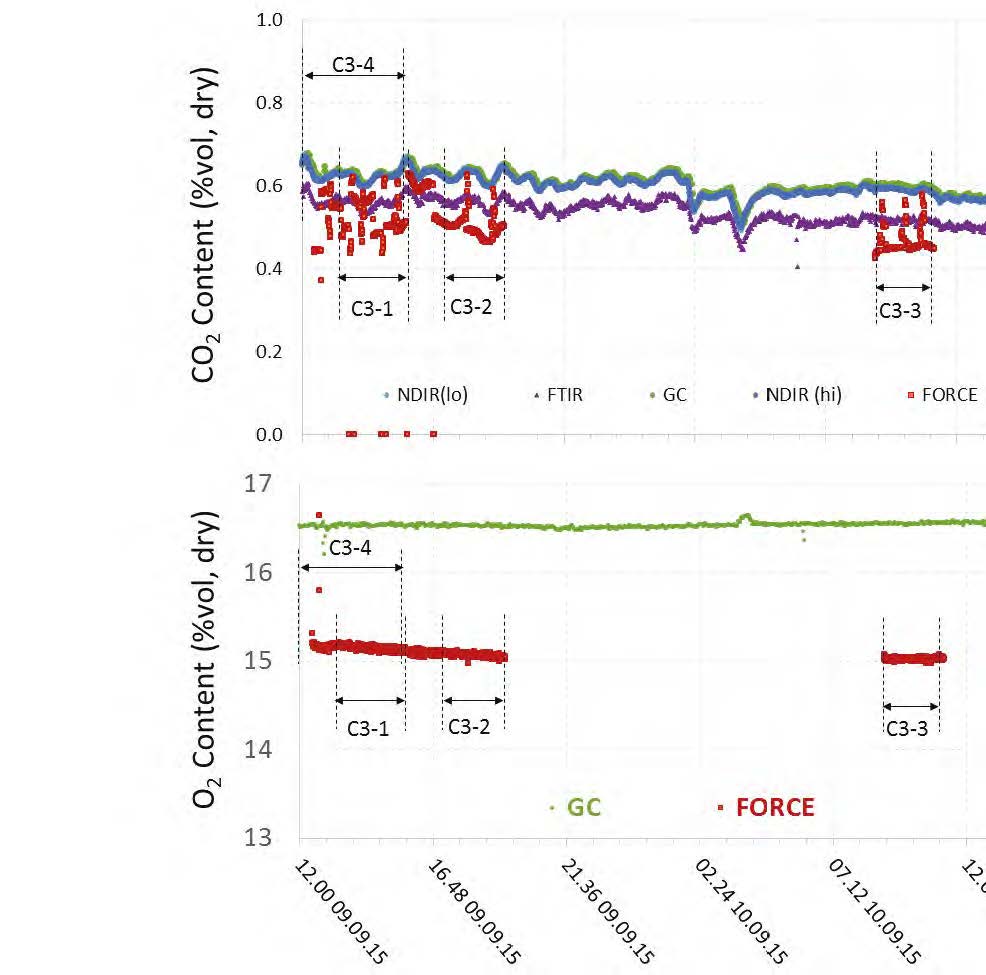
Figure 3. Depleted flue gas CO2 and O2 data. Data collected by FORCE Technology on 9 and 10 September 2015 are also shown.
5.2 Gas phase flow rates
Continuous measurement of the flow rates of the supply flue gas, depleted flue gas, and CO2 product stream were determined by TCM DA plant instrumentation. In particular, the TCM DA amine plant facility is well instrumented for determining the flue gas supply flow rate, with several different types of flow meters positioned in series.
During the base-case operations, pitot-tube traversing of the supply flue gas, depleted flue gas, and CO2 product stream was carried out by FORCE Technology to determine the flow rates, the results of which are compared to plant instrumentation measurements below:
- The CHP flue gas supply flow is measured by two independent instruments, an ultrasonic flow meter (FT-0150) and a multi-pitot-tube flow meter (FIC-0124), which are characterized in Table 2. The data from these flow meters are shown in Figure 4. All flow rates are at defined standard conditions of 15 °C and 101.3 kPa. The CHP flue gas flow was very steady over the test period on 9 September 2015 when FORCE Technology made independent measurements of flow as indicated in Figure 4. The difference between the values measured by FORCE Technology and that measured by the plant instruments is between 2–6%, well within the reported uncertainty in the FORCE Technology measurement of 10% The test period flow averages used for all calculations are the data reported by the ultrasonic flow meter (FT-0150).
- The depleted flue gas flow is measured by a single multi-pitot tube flow meter (FT-2431), whose characteristics are listed in Table 2. The measured flow had a higher degree of variability than the inlet CHP measurement (spread of 5.9% versus 0.7% for FT-0150) and also has significant transients that are not correlated with any process parameter. The data are, however, fairly consistent over the period during which FORCE Technology made independent measurements on 9 September 2015 so a comparison is possible. The individual FORCE Technology measurements average to 55,900±10% Sm3/hr, dry (101.3 kPa, 15°C) at this location. The average flow over the same time period reported by the plant flow meter is 54,200 Sm3/hr, well within the 10% uncertainty in the FORCE Technology measurement. Nevertheless, the questions associated with this measurement are sufficient to choose to calculate the depleted flue gas flow rate assuming that all O2 and N2 entering with the flue gas supply leave in the depleted flue gas. The performance data reported here use such a calculation of depleted flue gas flow rate.
- The product CO2 flow measured by the vortex flow meter (FT-0010) is the primary flow meter used by TCM operators, whose characteristics are listed in Table 2. The data from this flow meter are shown in Figure 5. The product CO2 flow was relatively steady over the test period. FORCE Technology made independent measurements of flow on 9 September 2015 as indicated in Figure 5. The difference between the value measured by FORCE Technology and that measured by the plant instruments is approximately 7.5%, within the measurement uncertainty reported by FORCE Technology of 10%.
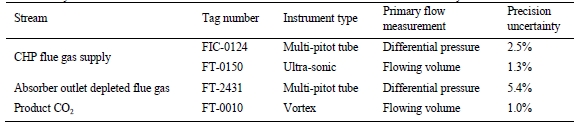
Table 2. Key flow instrumentations. Precision uncertainties are based on internal assessments by TCM DA.
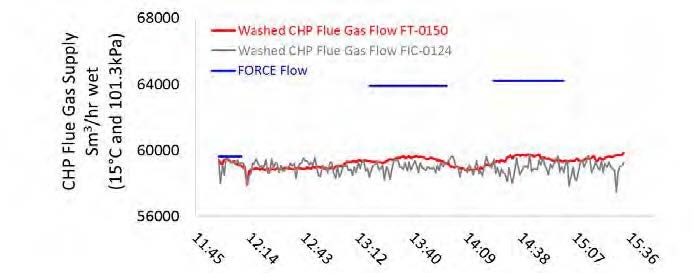
Figure 4. CHP flue gas supply flow measurements measured on 9th September 2016.
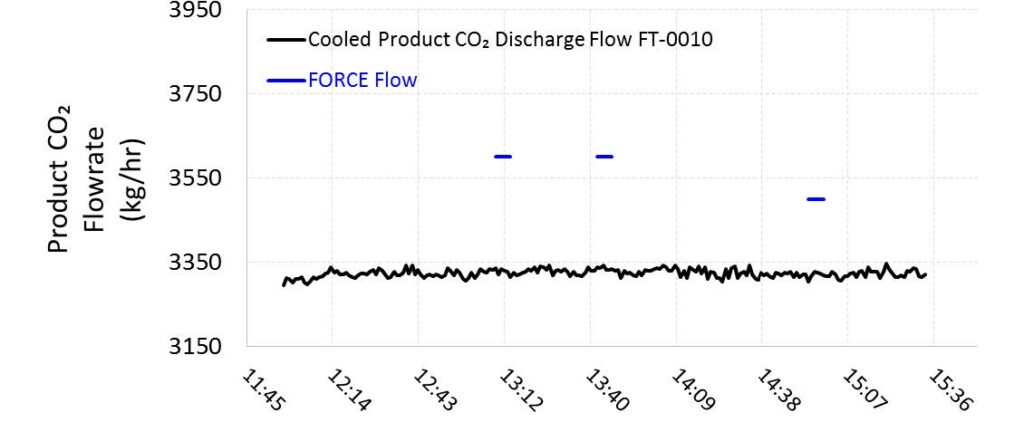
Figure 5. Product CO2 flow rate and test period averages measured on 9 September 2016.
5.3 Steam and condensate flow rates
The TCM DA amine plant receives high-pressure (HP) superheated steam from the neighbouring refinery at a pressure of approximately 30 bars and a temperature of between 240°C to 310°C. The HP steam is throttled near the stripper reboiler to a pressure of approximately 5 bar before being desuperheated with condensate. Following condensation in the stripper reboiler, the steam condensate collects in a receiving vessel before being returned to the refinery. Steam heat tracing is facilitated using a small amount of medium-pressure (MP) steam that is reduced to a lower pressure prior to use. The resultant low-pressure (LP) steam condensate is returned to the same receiver as the stripper reboiler condensate. A schematic of the system supplying steam to the stripper reboiler is shown in Figure 6. For thermal energy consumption assessment, the key parameter of interest is the steam flow to the reboiler. The HP condensate flow returned to the refinery can be assessed as a check on this parameter. The condensate return flow should be the sum of the reboiler steam flow and any condensate flow produced in steam heat tracing. Figure 7 shows these two parameters. As a result of higher ambient temperatures experienced in September 2015 the average condensate flow measurement (FT-2455) was either at or slightly lower than the steam flow measurement (FT- 2386). (During the first MEA baseline testing in January 2014, condensate measurements exceeded the steam flow measurement due to the contribution of trace heating).
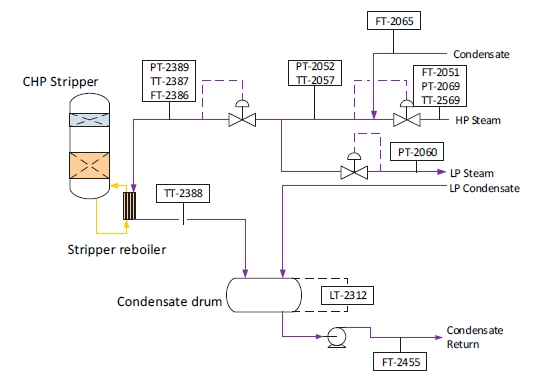
Figure 6. Stripper reboiler steam supply flow schematic.
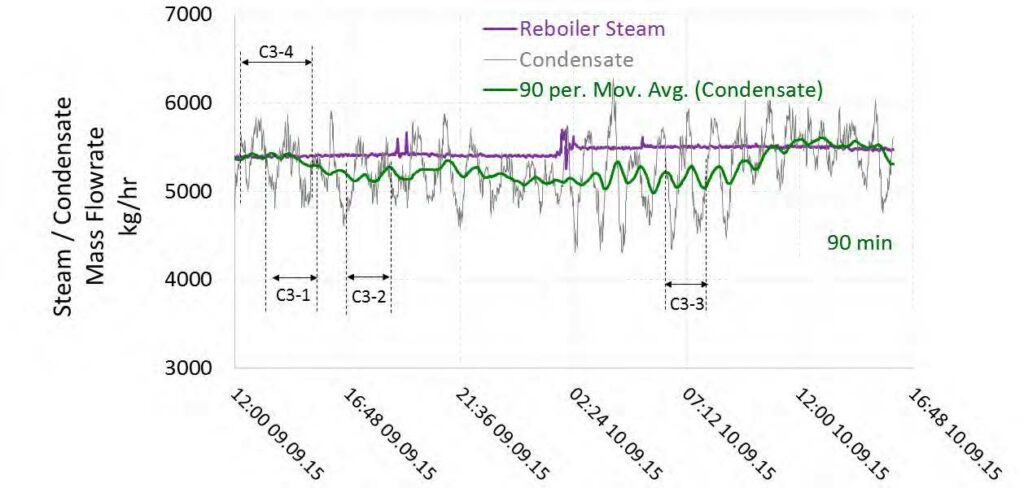
Figure 7. Reboiler steam flow and HP condensate return flow.
6. Results and discussions
6.1 CO2 capture efficiency and recovery
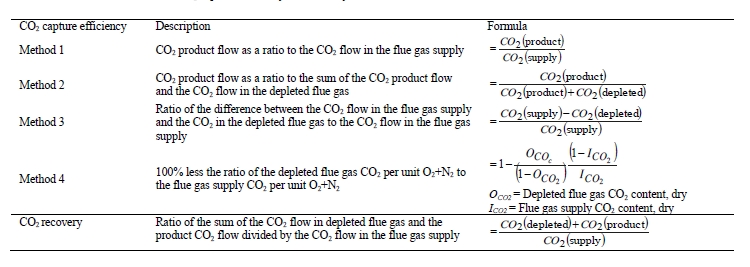
The CO2 capture efficiency was calculated using the four methods (Methods 1–4) shown in Table 8 in Appendix A. CO2 recovery is the fraction of CO2 mass flow in the flue gas supply that is accounted for by measured CO2 mass flows in the depleted flue gas and product CO2; it is a measure of the degree to which the CO2 mass balance is closed. The formula to calculate the amount of CO2 recovery from the flue gas supply is also given in Table 8 in Appendix A.
The depleted flue gas flow measurement was not reliable and therefore it was calculated. It was assumed that the oxygen and nitrogen entering the absorber with the flue gas leave in the depleted flue gas. The saturated water content of the depleted flue gas was calculated using its temperature and pressure. The CO2 flow out of the absorber was calculated using the concentration of CO2 in the depleted flue gas. These are essentially the same assumptions as those used for Method 4. Therefore, Method 3 and Method 4 calculations result in identical CO2 capture rates. The CO2 recovery was then estimated using the calculated flow of depleted flue gas. The calculated CO2 capture efficiency and recovery are presented in Table 3. For all test periods, the calculated CO2 capture was quite steady and the CO2 recovery was about 98–99%.
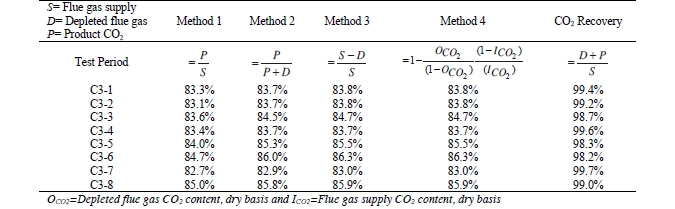
Table 3. CO2 capture results.
The uncertainty calculations and results from each calculation method are shown in Table 4. The following assumptions were used:
- Flow metering uncertainties were calculated by TCM DA for the indicated flow meters based on the specification of the instrument.
- Concentration uncertainties for the flue gas flows are those described in Section 5.2.
- Concentration uncertainty for the product CO2 is assumed to be 1% to allow for actual CO2 content as low as 99%.
- CO2 capture of 85% is representative of that measured during all test periods.
- The uncertainty in CO2 capture is almost entirely due to uncertainty in CO2 content of the CHP flue gas supply for the assigned total (low) flow uncertainties. The CO2 capture uncertainty is relatively insensitive to uncertainties both in the CO2 contents of both the product CO2 and the depleted flue gas.
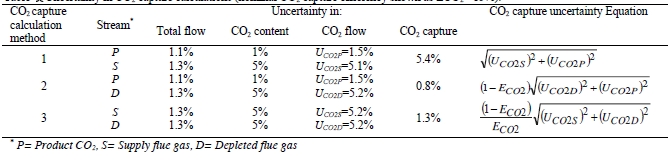
Table 4. Uncertainty in CO2 capture calculations (nominal CO2 capture efficiency shown as ECO2 =85%).
6.2 Thermal energy consumption
The reboiler thermal duty was calculated as the difference between steam enthalpy at the reboiler inlet temperature and pressure and the saturation enthalpy of water at the reboiler condensate temperature. The specific thermal duty (SRD) was obtained by dividing the reboiler duty by the product CO2 flow. The CO2 product flow was either based on the measured CO2 product flow (P) or on the difference between the NDIR-measured CO2 supply flow and the estimated CO2 depleted flow (S-D). The two corresponding values for SRD are shown in Table 5. The results for SRD were very consistent during all test periods.
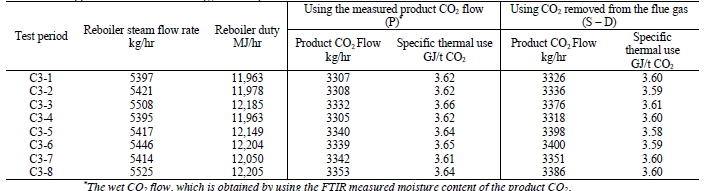
Table 5. Stripper reboiler thermal energy consumption.
6.3 Gas phase contaminants
FORCE Technology measured the gas phase concentration of the compounds listed below in the three gas streams. The data are shown in Table 9-11 in Appendix B.
- SO2 was simultaneously measured in the three gas streams during test period C3-1. A modest amount of SO2 was present in the flue gas supply. No SO2 entering the absorber in the flue gas supplied left the plant in either the depleted flue gas or product CO2 streams.
- NOX concentrations and mass flows were measured in the three gas streams during test period C3-1. NOx concentrations were below the detectable limit during all test periods.
- Acetone, formaldehyde, and acetaldehyde concentrations and mass flow rates were measured during test period C3-2. The aldehydes in the depleted flue gas and product CO2 do did exist in the supplied flue gas and were, presumably, produced in the absorption process. Acetone was not detected in any gas stream. FORCE Technology‘s measurements for the acetaldehyde concentrations were not successful and therefore the values measured by TCM DA is shown in Table 10 in Appendix B.
- Amines/Amides concentrations and mass rates were measured during test period C3-2. None of the compounds were detected in the CHP flue gas supply. The only compounds detected in the depleted flue gas and product CO2 were MEA and methylamine. Traces of ethylamine, dimethylamine, and diethylamine were detected in the depleted flue gas only. Amides were below the detection limits.
- H2SO4 concentration was measured in the three gas streams as aggregate sulfate (reported as H2SO4 equivalent) during test period C3-1. The concentration of H2SO4 was below the respective detection limits.
- Particulates were measured during test period C3-1. The total amount of particulates in the CHP flue gas supply is very low. The amount of particulates in the three gas streams was below the detection limit.
- Ammonia was simultaneously measured in the three gas streams during test period C3-3. Measurable amounts of ammonia were found in the depleted flue gas and in the product CO2. Ammonia was not detected in the CHP flue gas supply suggesting it resulted from MEA degradation during the process.
- TVOC was measured during test period C3-3. Measurable amounts of TVOC were detected in the product CO2. The CHP flue gas supply does not contain any TVOC and presumably, it resulted from MEA degradation during the CO2 capture process.
6.4 Laborelec particle measurements
Laborelec carried out particle size testing using an Electrical Low Pressure Impactor (ELPI+). Four locations of the absorber tower were monitored to investigate the potential formation of particles as the depleted flue gas passes through the washing stages and demisters. The results shown in Table 6 have measurements that were near to the detection limit of the ELPI+ when inserted in the process. The ambient air measurements undertaken during these tests were higher than the process measurements by almost one order of magnitude. The measurements were three to four orders of magnitude lower than similar measurements taken on flue gas from a coal thermal plant, proving the scarcity of particles in the CHP flue gases. The small amount of particles and their small sizes remain largely unchanged as they pass through the absorber.
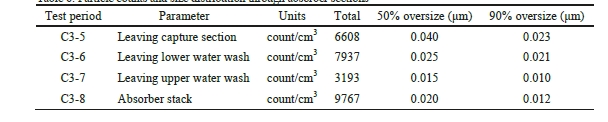
Table 6. Particle counts and size distribution through absorber sections.
6.5 New baseline for solvent performance testing
Table 7 presents a portion of the MEA test data obtained at the TCM DA amine plant. Based on these data which were obtained at about test period C3-4 when flow rates were measured, a new baseline is established. As the instrumentation of the amine plant and therefore the measurements are significantly improved since the previous MEA baseline in 2014 [4], the 2015 MEA results will set the baseline for performance benchmarking of other amines at TCM DA. The 2014 baseline is therefore considered obsolete.
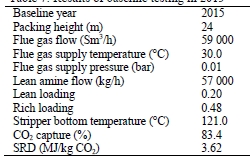
Table 7. Results of baseline testing in 2015.
Comprehensive process data for the TCM DA baseline testing in 2015 are given in Table 12, Appendix C.
7. Conclusions
The quality of the gas phase measurements at the TCM DA amine plant is significantly improved by installing new online instruments. Using the upgraded instrumentations, a new baseline for the TCM DA amine plant is established which has replaced the 2014 baseline. The new baseline is set up close to the plant nominal capacity and will serve as the performance benchmark for other amines tested at the TCM DA amine plant.
Acknowledgements
The authors gratefully acknowledge the staff of TCM DA, Gassnova, Statoil, Shell and Sasol for their contribution and work at the TCM DA facility. The authors also gratefully acknowledge Gassnova, Statoil, Shell, and Sasol as the owners of TCM DA for their financial support and contributions.
Appendix A.
Appendix B and C
References
- Thimsen D, Maxson A, Smith V, Cents T, Falk-Pedersen O, Gorset O, Hamborg ES. Results from MEA testing at the CO2 Technology Centre Mongstad. Part I: Post-Combustion CO2 capture testing methodology Energy Procedia 63 5938-5958; 2014.
- Gjernes E, Pedersen S, Cents T, Watson G, Fostås BF, Shah MI, Lombardo G, Desvignes C, Flø NE, Morken AK, de Cazenove T, Faramarzi L, Hamborg ES. Results from 30 wt% MEA performance testing at the CO2 Technology Centre Mongstad. Energy Procedia (GHGT-13), Forthcoming 2017.
- American Society of Mechanical Engineers, New York, NY. PTC-4, Fired Steam Generators, 2008.
- Hamborg ES, Smith V, Cents T, Brigman N, Falk-Pedersen O, de Cazanove T, Chhagnlal M, Feste JK, Ullestad Ø, Ulvatn H, Gorset O, Askestad I, Gram LK, Fostås BF, Shah MI, Maxson A, Thimsen D. Results from MEA testing at the CO2 Technology Centre Mongstad. Part II: Verification of baseline results. Energy Procedia 63, 5994-6011; 2014.