
3. Results from MEA testing at the CO2 Technology Centre Mongstad. Verification of Residual Fluid Catalytic Cracker (RFCC) baseline results (2021)
Scott A. Humeb*,Muhammad I. Shaha, Gerard Lombardoa, Thomas de Cazenovea, Jane K. Festea, Andrew Maxsonb, and Christophe Benqueta
aTechnology Centre Mongstad (TCM), 5954 Mongstad, Norway bElectric Power Research Institute, Inc, 3420 Hillview Avenue, Palo Alto, CA 94394, USA
Abstract

Technology Center Mongstad (TCM) houses a pilot-scale test facility for CO2 capture solvents termed the “amine plant”, where multiple test campaigns have been performed on monoethanolamine (MEA). The third MEA test campaign (MEA-3) was conducted in June 2017 and several subsequent tests on MEA (MEA-4 and MEA-5) were performed, through October 2018. MEA- 3, MEA-4, and MEA-5 have been the most significant collaborative test campaigns that the owners of TCM, TCM DA, have conducted since its inauguration in 2012. The large number of public, industrial, research, and academic participants involved in these campaigns have enriched the projects and ensured that the significant results will serve a broad audience. The main objective of these campaigns was to produce knowledge that can be used to reduce the cost as well as the technical, environmental, and financial risks for the commercial-scale deployment of post-combustion CO2 capture (PCC). This includes demonstration of a model-based control system, dynamic operation of the amine plant, investigating amine aerosol emissions, establishment of residual fluid catalytic cracker (RFCC)—a flue gas emanating from a nearby Equinor refinery that emulates coal in composition—baseline performance with MEA, and specific tests targeted at reducing CO2 avoided cost. Through the campaigns, both flue gas sources currently available to TCM were used, including the RFCC gas as well as flue gas from a nearby combined-cycle gas turbine (CCGT)-based combined-heat-and-power plant (CHP) that operates off of natural gas.
The Electric Power Research Institute, Inc. (EPRI) assessed the performance of the MEA-based process using an independent verification protocol (IVP) previously developed for the CHP flue gas [1]. The IVP provides a structured testing procedure for assessing the thermal and environmental performance of PCC processes under normal operating conditions. Based on this, methodology results were presented by Faramarzi et al [2]. The IVP was updated for use with the RFCC as this gas contains 13– 14 vol% CO2 content by volume whereas the CHP flue gas has 3.5 vol% CO2 content. Throughout the RFCC testing, TCM DA manually collected extractive samples from the depleted flue gas and product CO2 outlets sequentially. As part of the IVP, EPRI also assessed critical plant instrumentation at TCM for accuracy and precision error based on a comparative analysis done during testing operations and against calibration checks.
The MEA baseline process was evaluated during thirteen individual test periods over four days in May 2018. During the tests, extractive samples were taken to measure process contaminants such as aldehydes, ketones, amines, and ammonia. Sulfur oxides and nitrogen oxides were continuously monitored using Fourier-transform infrared (FTIR) analysers on the depleted flue gas and product CO2 streams. TCM DA has installed multiple measurements of the CO2 concentration (FTIR, non-dispersive infrared sensor, and gas chromatography) allowing comparative confirmation during the test periods. The capture rate was calculated via four methods. CO2 recovery (overall mass balance) was evaluated and the thermal performance (energy consumption) was assessed based on measured data taken during the tests. The CO2 capture rate achieved during the MEA RFCC testing was close to 90%, with steam reboiler duties of 3.43–3.51 GJ/tonne CO2, and the CO2 gas mass balance closures were close to 100%.
These data and the associated assessments, along with the results of TCM DA sampling during these tests, will be presented in this paper and will provide a new baseline case for 30 wt% MEA solvent in higher concentration flue gas capture cases. Based on this, TCM will now have two baselines covering flue gases with 3.5 vol% CO2 (Faramarzi et al.) and with 13–14 vol% CO2 (this project).
1. Introduction
The Technology Centre Mongstad (TCM) is located next to the Equinor refinery in Mongstad, Norway. TCM DA is a joint venture owned by Gassnova representing the Norwegian state, Equinor, Shell, and Total. The test facility, dubbed the “amine plant”, run by TCM DA entered the operational phase in August 2012 and is one of the largest post-combustion CO2 capture (PCC) test centres in the world. A unique aspect of the facility is that either a flue gas slipstream from a natural gas-fired combined-heat-and-power (CHP) plant or an equivalent volumetric flow from a residual fluid catalytic cracker (RFCC) unit can be used for CO2 capture. The CHP flue gas contains about 3.5 vol% CO2 and the RFCC flue gas contains about 13–14 vol% CO2, the latter of which is comparable to CO2 levels seen in coal-fired flue gas. The amine plant, designed and constructed by Aker Solutions and Kværner, is a highly flexible and well-instrumented unit that can accommodate a variety of technologies with capabilities of treating flue gas streams of up to 60,000 standard cubic meters per hour. The plant is offered to developers of solvent-based CO2 capture technologies to test the performance of their solvent technology and to verify technologies aimed to reduce the atmospheric emissions and environmental impact of amines and amine-based degradation products from solvent- based CO2 capture processes. The objective of TCM DA is to test, verify, and demonstrate CO2 capture technologies suitable for deployment at full-scale. A significant number of vendors, including Aker Solutions, Alstom (now GE Power), Cansolv Technologies Inc., Carbon Clean Solutions Ltd., Fluor and Ion Engineering have already successfully used the TCM DA facilities to verify their CO2 capture technologies.
Multiple tests using monoethanolamine (MEA) have been carried out at TCM to define the baseline performance of the solvent for defined operating conditions using flue gas from the CHP at 3.5 vol% CO2 content [2]. More recently, the MEA solvent has been tested with the higher CO2 concentrations from the RFCC flue gas to develop a new baseline for the amine plant, in accordance with an independent verification protocol (IVP), which provides a structured testing procedure, developed by the Electric Power Research Institute, Inc. (EPRI) [1].
2. Amine plant
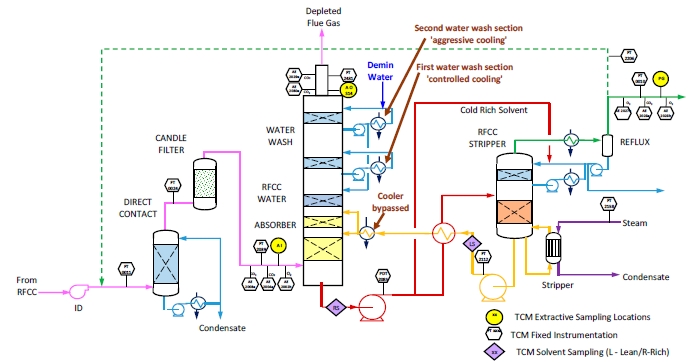
The schematic of the TCM DA amine plant when treating the CHP flue gas is shown in Figure 1.
3. IVP overview
The roles and responsibilities of the organizations that conducted the IVP are:
- TCM DA is the prime on the project and its personnel organized the field testing during the test period. They also operated the plant throughout all baseline testing
- EPRI were contracted by TCM DA to develop the IVP during previous MEA baseline testing. EPRI was on site during MEA baseline testing on RFCC flue gas to observe the conduct of the tests and the associated manual extractive sampling. EPRI received the data for the RFCC tests from TCM DA for analysis.
4. Test campaign
The testing of the MEA solvent at TCM was carried out using RFCC flue gas that has CO2 concentrations of typical coal flue gases. Prior testing with MEA using CHP flue gas was conducted in September 2015. The test periods identified for the RFCC flue gas operation, shown in Table 1, reflect the extractive sampling periods carried out on 28–31 May 2018.
During the testing, personnel from TCM DA manually collected extractive samples from the depleted gas outlet and product CO2 line downstream of the RFCC stripper. In previous tests, this was sometimes performed by an independent testing contractor. However, TCM DA’s competency related to performing this testing was deemed adequate by EPRI, especially since TCM DA is not commercially involved in the outcome and hence can be considered to be unbiased.
Data logs for all sampling periods containing pertinent flows, temperatures, pressures, and concentrations measured by permanent plant instruments were supplied by TCM DA for the entire test period.
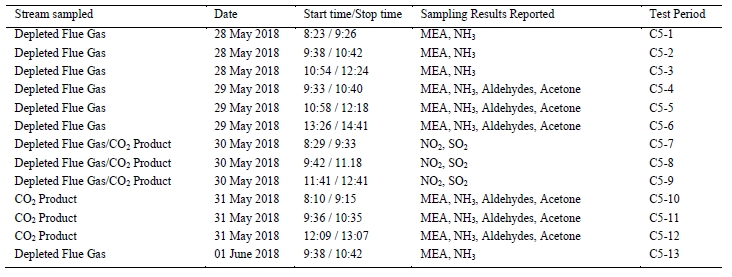
Table 1. Summary of the test periods.
5. Instrument assessment
To determine the process plant performance, a key component is the quality of the instrumentation installed for measuring the respective compositions and flow rates. Instrumentation quality is determined using two parameters:
- Accuracy/bias: This represents the difference between the instrument reading (or average of a set of readings under unchanging process conditions) being assessed and the true value of the parameter being measured. Appropriate determination of the “true value” must be achieved by simultaneous measurement of the parameter using a reference method or instrument with calibration that can be traced to primary standards.
- Precision: A determination of the variability of the instrument reading when stream conditions are known to be steady state. Precision is therefore a measure of the random error associated with the measurement.
These measurement errors can be combined to assess the aggregate uncertainty in each measurement. In the absence of a calibration against primary standards for the entire measurement range needed, the uncertainty published by the instrument supplier represents only the precision error.
When the process parameter being measured does not change, precision is a measure of repeatability. In real plant situations, when attempting to operate at steady-state conditions, often process parameters (flow, pressure, and temperature) do vary over the measurement period. Thus, measurements over long periods of time (greater than process time constants) will also include an error term related to process uncertainty.
5.1 Gas-phase compositions
TCM DA has 3 independent Fourier-transform infrared (FTIR) units (Finetech Anafin 2000 and a pair of Gasmet FCX units), facilitating dedicated and continuous FTIR measurements at the absorber inlet, outlet, and CO2 product gas streams. The CO2 concentration at the inlet and outlet of the absorber column is also determined by two non- dispersive infrared (NDIR) units at each location, one set to high range (% vol) and one to low range (ppmv) on a dry- gas basis. A dedicated trace O2 instrument (Teledyne Instruments 3001) is installed to quantify O2 content of the product CO2 as this is typically at ppm levels in this stream. A Siemens Maxum Edition II gas chromatograph (GC) unit is also installed, which is capable of measuring the CO2, O2, and nitrogen content at all three locations in a near- simultaneous fashion.
During the May to June 2018 operations, TCM DA utilized the installed FTIR systems, NDIR analysers, and GC unit to monitor the incoming flue gas and depleted flue gas, as shown in Figure 2 and Figure 3. It should be noted that the low-range NDIR units could not be used for RFCC testing as the inlet flue gas measurement range is 0–5 vol% (dry) and the outlet depleted flue gas range is 0–1 vol% (dry), both of which are below the gas concentrations measured during these tests.
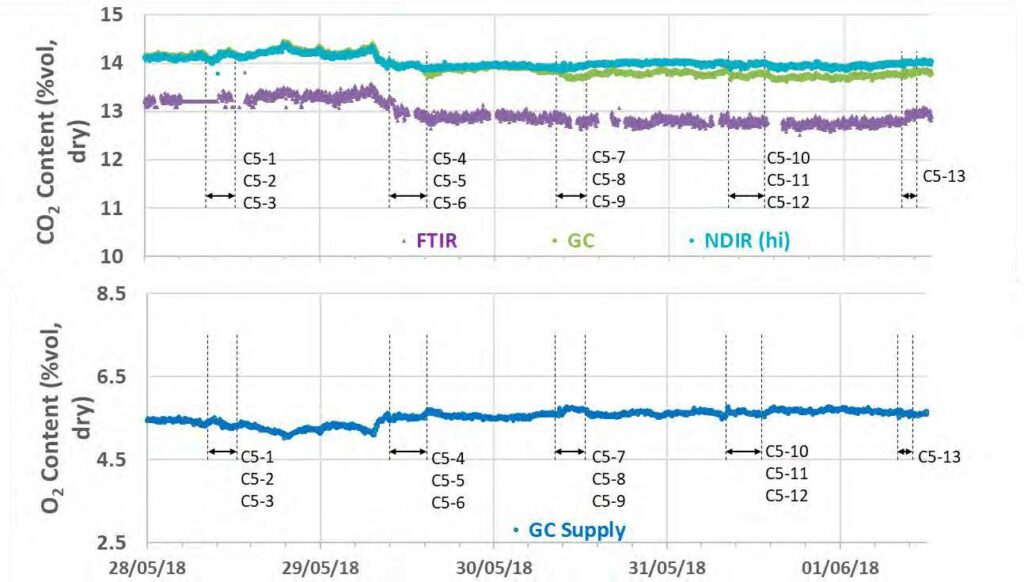
Figure 2. RFCC flue gas supply CO2 and O2 data for all analysers.
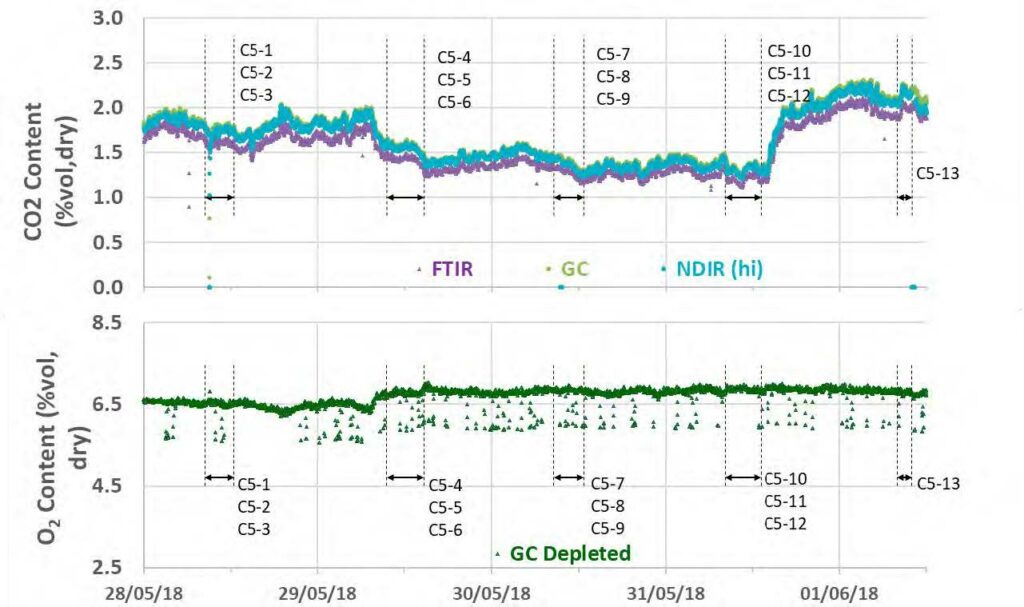
Figure 3. Depleted flue gas CO2 and O2 data.
- Figure 2 displays the RFCC flue gas supply CO2 and O2 concentration data over the test campaign. There is good agreement between CO2 NDIR and the GC CO2 measurements (<0.2% point difference). The TCM FTIR CO2 was biased 1% point lower than the other two instruments.
- Figure 3 displays the depleted flue gas CO2 and O2 concentration data over the test campaign. The data from all of the TCM instruments show close tracking together, suggesting that the process CO2 concentration had a degree of variability (±0.2% vol) during that operating period.
- The O2 content of the product CO2 was low in the range of 1–2 ppmv, as shown in Figure 4. For the purposes of calculating CO2 removal and recovery, it is assumed here that the product CO2 stream is saturated with water at the measured temperature and pressure and contains the small trace quantities of O2 and N2 measured. The balance is presumed to be CO2.

Figure 4. Product gas O2 data.
5.2 Gas-phase flow rates
Supply flue gas, depleted flue gas, and the CO2 product streams were determined by TCM DA plant instrumentation for continuous measurement of the flow rates. In particular, the TCM DA amine plant is well instrumented for determining the RFCC flue gas supply flow rate, with several of the flow meters positioned in series.
- The RFCC flue gas supply flow is measured by two independent multi-pitot-tube flow meter instruments, (FIC-0024 and FT-2039), which are characterized in Table 2. The data from these flow meters are shown in Figure 5. All flow rates are at the defined standard conditions of 15°C and 101.3 kPa. The RFCC flue gas flow was very steady over the entire test period. The test period flow averages used for all calculations are the data reported by the multi-pitot-tube (FIC-0024) as this had a lower precision error.
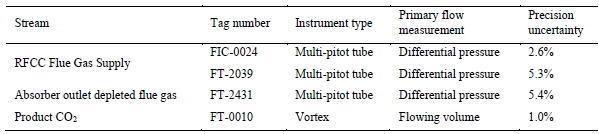
Table 2. Key flow instrumentations (precision uncertainties are based on internal assessments by TCM DA).
- The depleted flue gas flow is measured by a single multi-pitot tube flow meter (FT-2431), whose characteristics are listed in Table 2. As observed in prior campaigns, the measured flow has significant transients that are not correlated with any process parameter. Subsequently, the depleted flue gas flow rate was calculated assuming that all O2 and N2 entering with the flue gas supply leaves in the depleted flue gas. The performance data reported here use such a calculation for depleted flue gas flow rate.
- The product CO2 flow measured by the vortex flow meter (FT-0010) is the primary flow meter used by TCM DA operators, the characteristics for which are listed in Table 2. Additionally, a Coriolis flow meter is installed (FT-2215), however this instrument has not undergone an accuracy study and so is not used for primary assessment. The data from both flow meters are shown Figure 6. The product CO2 flow was relatively steady over all periods.
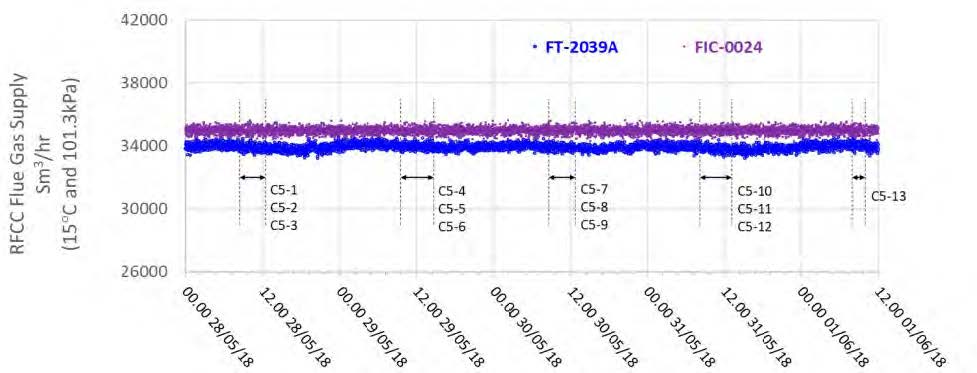
Figure 5. Flue gas supply flow measurements for RFCC testing May-June 2018.
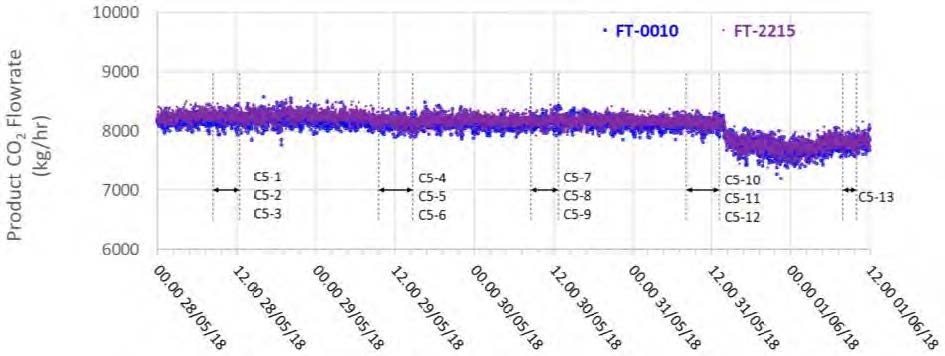
Figure 6. Product flue gas flow rate measurements for RFCC testing May-June 2018.
5.3 Steam and condensate flow rates
The TCM DA amine plant receives high-pressure (HP) superheated steam from the neighbouring refinery at a pressure of approximately 30 bar, and a temperature of between 240°C to 310°C. A schematic of the system supplying steam to the stripper reboiler is shown in Figure 7.
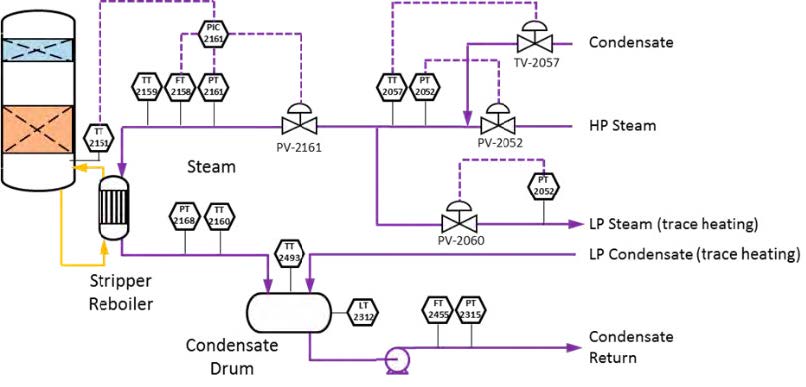
Figure 7. RFCC stripper reboiler steam supply flow schematic.
The HP steam is throttled near the stripper reboiler to a pressure of approximately 5 bar before being desuperheated with condensate. Following condensation in the stripper reboiler, the steam condensate collects in a receiving vessel before being returned to the refinery.
Steam heat tracing is facilitated using a small amount of medium-pressure steam that is reduced to a lower pressure prior to use. The resultant low-pressure (LP) steam condensate is returned to the same receiver as the stripper reboiler condensate. For thermal energy consumption assessment, the key parameter of interest is the steam flow to the reboiler, shown in Figure 8.
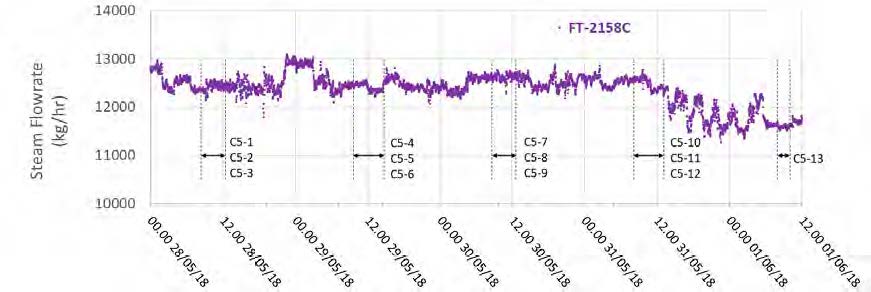
Figure 8. RFCC reboiler steam flow.
6. Results and discussion
6.1 CO2 capture efficiency and recovery
The CO2 capture efficiency was calculated using the four methods (Methods 1–4) via the formulas detailed in Table 4. In addition, CO2 recovery is the fraction of CO2 mass flow in the flue gas supply that is accounted for by measured CO2 mass flows in the depleted flue gas and product CO2—it is a measure of the degree to which the CO2 mass balance is closed.
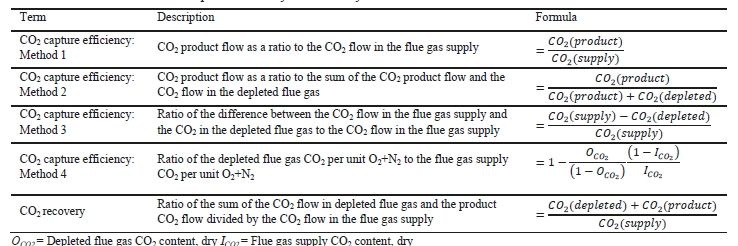
Table 3. CO2 capture efficiency and recovery calculation methods.
As the depleted flue gas flow measurement was not reliable, it was assumed that the oxygen and nitrogen entering the absorber with the flue gas leaves in the depleted flue gas. The saturated water content of the depleted flue gas was calculated using its temperature and pressure. The CO2 flow out of the absorber was calculated using the concentration of CO2 in the depleted flue gas and the calculated mass flowrate. These are essentially the same assumptions as those used for Method 4, which is independent of flowrate and uses a concentration-only approach. Subsequently, Method 3 and Method 4 calculations result in identical CO2 capture rates.
The CO2 recovery was then estimated using the calculated flow of depleted flue gas. The calculated CO2 capture efficiency and recovery are presented in Table 4. For all test periods, the calculated CO2 captures were quite steady near the 90% capture target and the CO2 recovery was consistently in the range of 101–104%. Test C5-13 was targeted at the lower 85% capture rate.
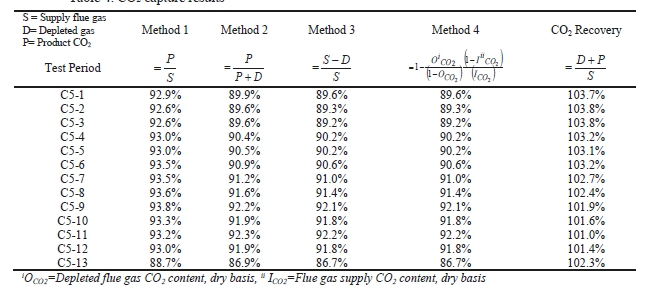
Table 4. CO2 capture results.
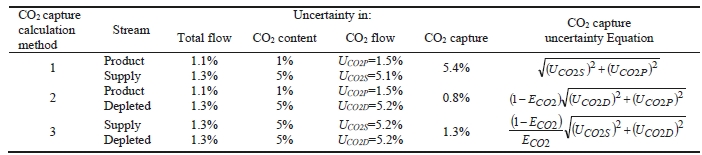
The uncertainty calculations and results from calculation Methods 1–3 are shown in Table 5. The following assumptions were used:
- Flow metering uncertainties were calculated by TCM DA for the indicated flow meters based on the specification of the instrument [3].
- Concentration uncertainties for the flue gas flows are those detailed in Table 2.
- Concentration uncertainty for the product CO2 is assumed to be 1% to allow for CO2 content as low as 99%.
- CO2 capture of 90% is representative of that measured during all test periods.
- The uncertainty in CO2 capture (ECO2) is almost entirely due to uncertainty in CO2 content of the RFCC flue gas supply for the assigned total (low) flow uncertainties. The CO2 capture uncertainty is relatively insensitive to uncertainties in the CO2 contents of both the product CO2 and depleted flue gases.
6.2 Thermal energy consumption
The reboiler thermal duty was calculated as the difference between steam enthalpy at the reboiler inlet temperature and pressure and the saturation enthalpy of water at the reboiler condensate temperature. The specific thermal use (STU) was obtained by dividing the reboiler duty by the product CO2 flow. The CO2 product flow was either based on the measured CO2 product flow (P) or on the difference between the NDIR-measured CO2 supply flow and the estimated CO2 depleted flow (S – D). The two corresponding values for STU are shown in Table 6. The results for STU were very consistent during all test periods. The product flow measurements (P) were consistently higher than the using the gas-side difference method (S – D) method, resulting in lower STU values.
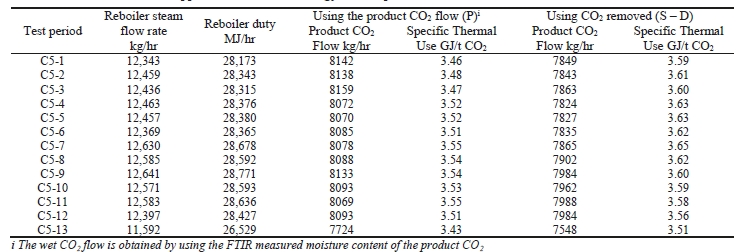
Table 6. Stripper reboiler thermal energy consumption.
Prior testing with CHP flue gas at approximately an 80 tonnes per day load yielded a regeneration energy range of 3.61–3.66 GJ/tonne CO2 using the product CO2 flow (P) and 3.58–3.60 GJ/tonne CO2 using the gas-side difference method (S – D) [2]. The RFCC tests achieved circa 190 tonnes per day load and delivered an average regeneration energy of 3.51 GJ/tonne CO2 using product flow (P) and 3.60 GJ/tonne CO2 using gas-side difference method (S – D). This represents a 2% reduction in regeneration energy, likely due to the higher inlet CO2 levels.
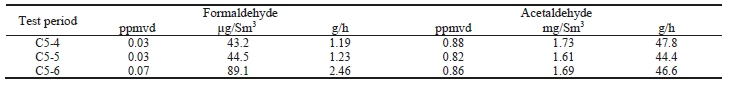
6.3 Gas-phase contaminants
Formaldehyde, acetaldehyde, and acetone concentrations were determined by extractive sampling of the depleted flue gas at the absorber outlet during the RFCC test periods as shown in Table 7. The formaldehyde levels are lower than the previous MEA baseline testing values of 720 μg/Sm3 and 40 g/hr, which were done by an independent, contractor (FORCE Technology) using brought-in instruments. The acetaldehyde levels are considerably lower than the 2015 MEA test samples of 16 mg/Sm3 and 840 g/h emission levels measured by FORCE Technology. However, acetone levels measured were sufficiently low to be at or below the detection limit of the analysis performed by SINTEF, a similar result to the previous MEA test [2].
For the CO2 product, shown in Table 8, the formaldehyde levels detected are lower than the manually sampled measurements during the 2015 CHP baseline campaign of 140 μg/Sm3 and the acetaldehyde levels are considerably lower than the previous level of 150 mg/Sm3. The 2015 MEA baseline measurements were closer to the levels measured in 2014, where formaldehyde was detected at 190 μg/Sm3. Although acetone was detected in the CO2 product, these measurements were at or below the detection limit, whereas in the previous MEA baseline all measurements taken were below the detection limit.
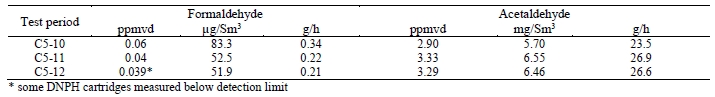
Table 8. Product gas aldehyde concentrations.
TCM DA measured concentrations of MEA and ammonia at the absorber outlet during the RFCC test periods C5-1 to C5-6 and for C5-13 following a modification to the process operating conditions to a lower capture rate target. The results of these manually extracted samples are shown in Table 9.
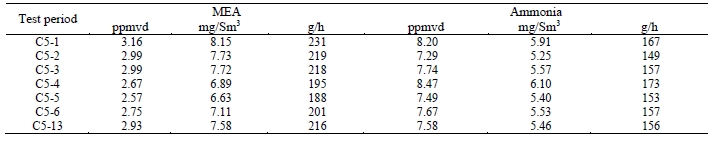
Table 9. Depleted flue gas stream ammonia and amine concentrations and mass rates as phase contaminants.
The levels detected here for MEA were consistent between samples and are far higher than observed by FORCE Technology during the 2015 CHP gas testing (0.006 mg/Sm3). Although the levels measured here are higher, previous EPRI experience with coal-derived flue gases has observed comparable single-digit ppm levels of amine at the depleted flue gas location when aerosol levels are low or zero, which TCM DA had achieved using the Brownian demister filter upstream of the absorber. Ammonia levels are lower than the previous CHP tests results, measured at 13 mg/Sm3. However, it is unknown how degraded the solvent was during these tests in comparison with the previous campaign. TCM DA measured concentrations of MEA and ammonia in the CO2 product gas during the RFCC test periods C5-10 to C5-12. MEA was not detected, and levels of ammonia were substantially lower at 0.05- 0.08mg/Sm3 than the prior CHP test results [2]. While extractive samples of SOx and NOx were not carried out during this test campaign, the FTIR was used to track the relative levels of each component. The RFCC flue gas was expected to have 20–60 ppm (vol, dry) of SO2 from previous tests, but this couldn’t be reliably verified during these tests as the FTIR instrument did not deliver a reliable measurement. The outlet measurements were more consistent, as shown in Table 10. The consistent <1 ppm vol measurement of SO2 suggests absorption by the MEA solvent.
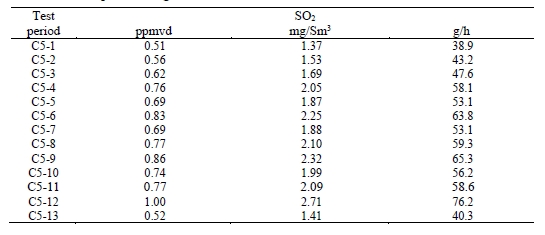
Table 10. Depleted flue gas SO2 concentrations and mass rates.
The NOx quantities passing through the absorber were effectively unchanged, showing only the concentrating effect of the CO2 removal from the flue gas, where more than 10% of the flue gas volume is removed. As the amine plant operated continuously capturing 90% throughout the test period, the FTIR-measured NOx data show a consistent increase in concentration at the outlet of the absorber as shown in Figure 9.
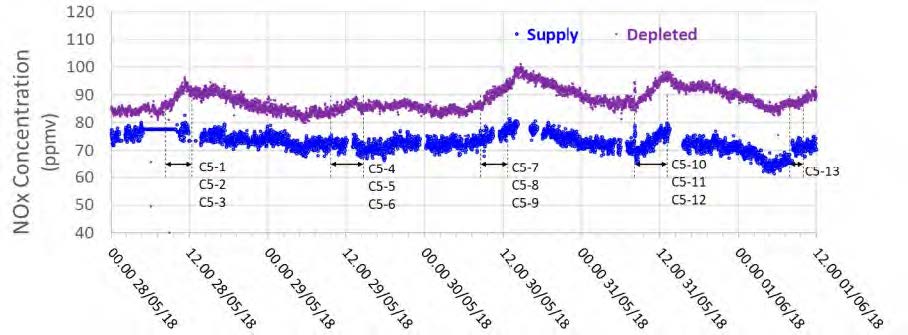
Figure 9. Absorber inlet and outlet NOx values.
6.4 New baseline for solvent performance testing
Table 11 presents a portion of the MEA test data obtained at the TCM DA amine plant. Based on these data, a new baseline was established for higher concentration flue gas CO2 capture.
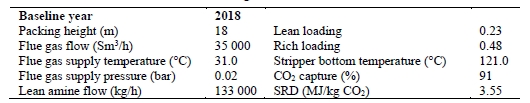
Table 11. Results of RFCC baseline testing in 2018.
This baseline represents the performance of the TCM amine plant close to the plant nominal capacity using 5M MEA solvent with higher CO2 concentration flue gas (13–14 vol%), typical of coal-based thermal plants. Alongside the prior baseline work carried out in 2015 for flue gas with CO2 concentrations from natural gas-fired CHP units (3–4 vol%) [2], this new baseline will serve as the performance benchmark for other amines tested at the TCM DA amine plant when using RFCC flue gas.
Acknowledgements
The authors gratefully acknowledge the staff of TCM DA, Gassnova, Equinor, Shell, and Total for their contribution and work at the TCM DA facility. The authors also gratefully acknowledge Gassnova, Equinor, Shell, and Total as the owners of TCM DA for their financial support and contributions.
References
- Thimsen et al. Results from MEA testing at the CO2 Technology Centre Mongstad. Part I: Post-Combustion CO2 capture testing methodology; Energy Procedia 63, 5938–5958; 2014.
- Faramarzi et al. Results from MEA testing at the CO2 Technology Centre Mongstad: Verification of baseline results in 2015; Energy Procedia 114, 1128–1145; 2017.
- Flue Gas Composition and Energy & Mass Balance Accuracy Studies at CO2 Technology Centre Mongstad (TCM DA): Results Related to the Amine Capture Unit.” K-E Frøysa and R. Sakariassen. CRM-12-F14016-RA-2: 7 June 2012