
5. Results from MEA testing at the CO2 Technology Centre Mongstad. Part I: Post-Combustion CO2 capture testing methodology (2014)
David Thimsena,*, Andrew Maxsona, Vian Smithb,c, Toine Centsb,c, Olav Falk-Pedersenb,d, Oddvar Gorsete, Espen S. Hamborgb,f
aElectric Power Research Institute, 3420 Hillview Avenue, Palo Alto, CA 94304, USA bCO2 Technology Centre Mongstad (TCM DA), 5954 Mongstad, Norway cSasol Technology, PO Box 5486, Johannesburg 2000, South Africa dGassnova SF, Dokkvegen 10 3920 Porsgrunn, Norway eAker Solutions, PO Box 222, 1326 Lysaker, Norway fStatoil ASA, P.O. Box 8500, 4035 Stavanger, Norway *Corresponding author

© 2014 The Authors. Published by Elsevier Ltd. This is an open access article under the CC BY-NC-ND license
(http://creativecommons.org/licenses/by-nc-nd/3.0/). Peer-review under responsibility of the Organizing Committee of GHGT-12
Abstract

This paper lays out a generic CO2 capture testing methodology that has been applied at multiple sites providing details on the procedure, its key performance indices and their associated specifications, as well as the required pre-test work. Specific application of the methodology for the CO2 Technology Centre Mongstad site, a CO2 capture testing facility located in Norway that performed CO2 capture tests using MEA, is shown as an illustrative example.
1. Introduction
At the beginning of the 21st century, increasing political and technological focus is being given to minimizing carbon dioxide (CO2) emissions to the atmosphere. As the combustion of fossil fuels at large industrial facilities is a significant source of CO2 entering the atmosphere, reducing CO2 emissions from existing and new fossil-fired plants will be critical. A principal method proposed for accomplishing this reduction is to capture the CO2 produced by separating it from the flue gas into a relatively pure stream and then injecting the purified CO2 into acceptable underground geological reservoirs for long-term storage.
Currently the only CO2 capture technologies sufficiently mature to apply at full scale are temperature swing absorption (TSA) processes that remove the relatively dilute CO2 from flue gas (common in processes that use air for combustion and produce significant nitrogen that dilutes the flue gas) by chemical absorption into an alkaline solvent at low temperature. The solvent is then heated to release the CO2 in a relatively pure stream for subsequent geological storage. Aqueous amine solutions at high concentration are leading near-term solvent candidates.
The use of amines to remove CO2 from various industrial and fuel gas streams is a relatively mature technology. There is less experience using amines to remove CO2 from flue gases, which contain significant levels of oxygen. In addition, the full-scale application of amine post-combustion capture (PCC) processes for removing CO2 from flue gas would be conducted at a scale approximately an order of magnitude larger than industrial amine-based TSA processes currently deployed.
Supply of the utilities required by a TSA process (thermal, electrical, and cooling) will have a significant impact on the operations of the host plant producing the flue gas being treated. Perhaps the greatest focus of PCC development is identifying processes that minimize the use of these utilities, particularly the thermal utility.
The Electric Power Research Institute (EPRI) has developed a generic independent verification protocol (IVP) to assess the performance of amine-based TSA processes. This IVP has already been tailored to and applied during EPRI-led CO2 capture testing at the following facilities:
- AEP’s Mountaineer Plant – 20-MWe demonstration of Alstom’s chilled ammonia process during 2011–2012
- Alabama Power’s Plant Barry – 500 tonnes/day demonstration of MHI’s KM-CDR advanced amine process; testing began in 2012 and is still ongoing
- EDF’s Le Havre – 2.0-MWe demonstration of Alstom/Dow’s Advanced Amine Process (AAP) during 2014
- We Energies’ Pleasant Prairie Power Plant – 1.7-MWe demonstration of Alstom’s chilled ammonia process during 2008.
CO2 Technology Centre Mongstad (TCM DA) has installed pilot-scale amine-based TSA process equipment next to the Statoil refinery in Mongstad, Norway. The purpose of this facility is to allow vendors of suitable amine formulations and other PCC processes to test their process and collect performance data to support full-scale design and anticipate the associated performance and costs.
This work is part of a continuous effort of gaining better understanding of the performance potential of the non- proprietary aqueous MEA solvent system, conducted by TCM DA and its affiliates and owners, in order to test, verify, and demonstrate CO2 capture technologies [1, 2, 3]. As part of an overall program of CO2 capture testing, EPRI worked with TCM DA, which operates the TCM DA facility and led the testing effort, and Aker Solutions to customize the IVP for TCM DA. Details on that customization are provided within this paper.
2. Independent verification protocol purpose and scope
2.1 Amine process description
Flue gas can be supplied to the TCM DA PCC amine plant from either the on-site natural gas-fired combined heat and power (CHP) plant or from the Statoil refinery residue fluid catalytic cracker (RFCC). As the testing work that this report discusses pertains to using the CHP flue gas, details on the RFCC will not be provided here. In the CHP plant, the natural gas is combusted in a gas turbine and the flue gas content and characteristics are similar to those of a combined cycle gas turbine (CCGT) power plant.
The flow schematic for the TCM DA pilot plant when treating CHP flue gas is shown in Fig. 1 and a photo of the amine plant is shown in Fig. 2.
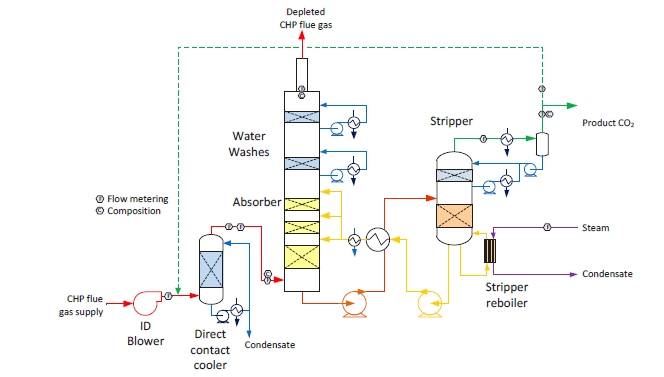
Fig. 1. Simplified flow schematic for TCM DA CO2 capture of CHP flue gas
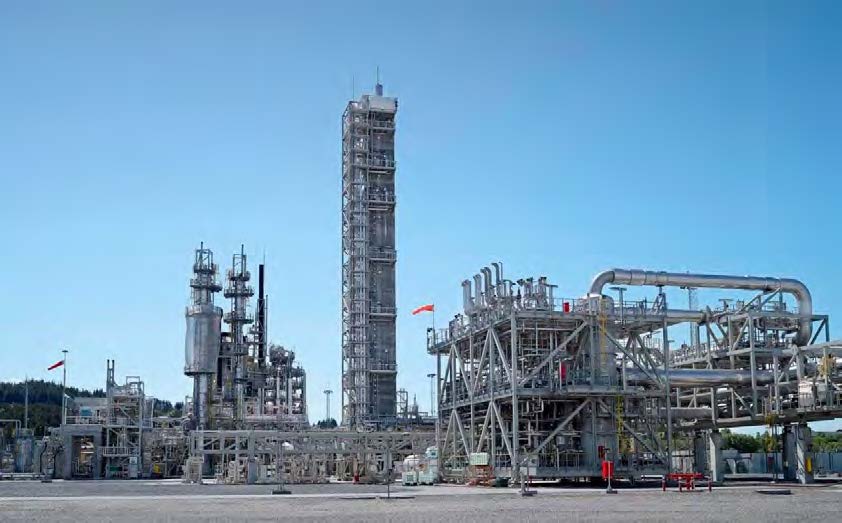
Fig. 2. TCM DA amine plant. The direct-contact cooler is situated to the right, the concrete absorber tower in the middle, the two stripper columns to the left, and the lean vapour compressor system to the far left.
The nominal characteristics of flue gas from the CHP source both before and after the direct-contact cooler (DCC) are shown in Table 1. The CHP flue gas is typical of high excess air combustion turbine exhaust.
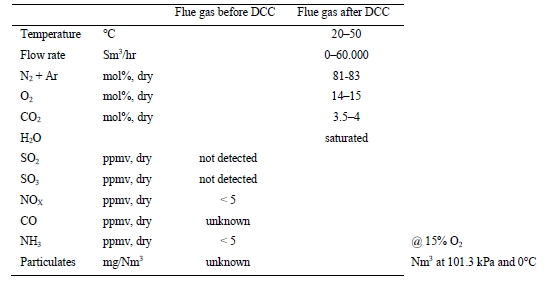
Table 1. Nominal characteristics of CHP flue gas supplied to TCM DA CO2 capture plant.
The raw flue gas may be cooled by direct contact with wash water. By these means, plant operators have the capability of controlling the temperature of the flue gas (saturated with water) delivered to the absorber.
The saturated flue gas rises in the rectangular cross-section absorber tower and comes into contact with falling lean solution in one of up to three beds of structured packing. The flue gas, depleted in CO2, then passes through up to 2 recirculating water wash stages to remove solvent vapors before being emitted to the atmosphere in a 1-meter diameter duct. The solution flow through the absorber tower is “once-through”; there is no recirculation of rich solution from the tower sump back to the top of the absorber section.
The solution rich in CO2 is pumped to the top of a stripper tower. Rich solution entering the stripper is pre-heated by exchange with hot lean solution being returned to the absorber. The falling rich solution comes into contact with rising steam/CO2. The lean solution at the bottom of the stripper is circulated through a steam-heated reboiler to provide the heat necessary to drive the endothermic CO2-releasing reactions.
The raw product CO2 leaving the stripper is cooled with recovery of condensate that is returned to the stripper as a reflux. The cooled product CO2 is vented. During CHP flue gas operations, a portion of the product CO2 can be recycled to the CHP flue gas upstream of the DCC to increase the CO2 content of the CHP flue gas for test purposes. The process is operated to be water neutral. The recirculating water washes at the top of the absorber are used to control the depleted flue gas temperature/water vapor content. If water accumulates in the absorber-stripper loop, the flue gas temperature leaving the absorber is allowed to increase, increasing the water vapor content of the depleted flue gas, and vice versa.
2.2 Testing to support process characterization
The key performance indices are those features of the PCC process that are of interest when designing and planning for a full-scale implementation of the technology. Some of these indices can be modeled using chemical/thermodynamic/physical design data. A primary function of pilot-plant operations is to provide measured data such that uncertainties in the model can be reduced by comparison of model results with measured results.
The key performance indices are dependent parameters that can be expected to vary with changes in the process independent parameters. Performance data collected when changing the independent parameters during pilot-plant operations can be used to calibrate the process model, which can then be used to identify a set of independent parameters that “optimize” the key performance indices.
Pilot-plant operations can also be used to quantify those key performance indices that are not readily amenable to modeling including the effects of trace constituents of the flue gas supply. There are also intermittent and long-term performance indices that cannot be effectively modeled and must be assessed from many hours of pilot-plant operations (typically 1000s of hours) including: heat exchanger fouling, mass transfer packing fouling, foaming, material corrosion, solvent quality control measures, solvent loss/replacement, etc.
2.3 Pertinent independent parameters
The independent parameters are those temperatures, pressures, flows, compositions, and physical design parameters readily subject to control by the plant operators. Changing these parameters can be expected to affect the key performance indices (dependent parameters). The most important independent parameters for the purposes of modeling the process installed at TCM DA are listed below.
- Inlet flue gas characteristics
- CO2 content
- Flow rate
- Temperature
- With/without flue gas pre-treatment for SOX and particulates (future).
- Solution characteristics
- Amine concentration
- Circulation rate
- Lean solution CO2 loading.
- Equipment design characteristics
- Absorber height
- Lean solution flash/compression use
- Number of water washes
- Rich/lean heat exchanger effectiveness.
- Operating options
- Stripper pressure.
2.4 Modeled key performance indices (dependent parameters)
The set of key performance indices that can be modeled and quantified by pilot-plant operations at TCM DA are listed below.
- CO2 capture performance
- % CO2 captured / produced / emitted.
- Utility use
- Cooling duty
- Electrical power
- Steam thermal.
- Depleted flue gas amine/degradation product content.
2.5 Key performance indices not modeled (dependent parameters)
While it is fairly straightforward to model the heat and mass transfer associated with the PCC process, there are key performance indices that are less straightforward to model. It is more expedient to quantify these indices, which are listed below, by measurements during pilot-plant operations.
- Depleted flue gas trace constituents
- Mercury and air toxics
- Particulates
- SO2–SO3–NOX
- Total hydrocarbons (HC) – Amine/degradation products not modeled.
- Product CO2 trace constituents
- O2
- SO2–SO3–NOX
- Total HC–Amine/degradation products not modeled.
- Continuous waste streams
- DCC blowdown.
2.6 Long-term process/plant monitoring
There are also key performance indices that can only be assessed over many hours of operation. These include chronic effects as well as intermittent operations as shown below.
- Material uses
- Amine make-up
- Water make-up/blowdown.
- Intermittent waste streams
- Amine reclaim waste
- Lean-solution filter cake
- Spent activated carbon.
- Heat exchanger fouling/corrosion
- Gas-liquid contactor fouling/corrosion/foaming
- Accumulation/emission of degradation/corrosion products.
2.7 Key outcome
Key outcomes of pilot-plant operations are:
- A stand-alone model that predicts key performance indices within the uncertainty in actual measurements made during pilot-plant operations (or other clearly stated uncertainty) when only the independent parameters listed above are the variable inputs to the model
- One or more sets of formal performance test results collected during “base-case” operations that include, in addition to the modeled key performance indices, empirical measurement of the key performance indices not modeled. These “base-case” operations can be expected to be conducted under a set of independent parameters that have been determined to “optimize” the key pre-defined performance indices.
3. Performance testing principles
3.1 General performance testing guidelines
There is no accepted procedure for assessing PCC plant performance. There are, however, reference-testing procedures that are similar in scope and provide guidance for specifying the protocols under which the performance of PCC plants can be verified. These include:
- Overall power plant performance – Steam-boiler operations are comparable in complexity to PCC plant operations. Flow, temperature, and pressure, and composition data must be collected over the test period and are used to calculate a number of key performance indices such as steam temperature, pressure, and flow, fuel quality, flue gas flow rate and composition, sensible and latent heat losses in the flue gas, auxiliary power use, gross generation, net generation, etc. The overall power plant performance test code will also make extensive reference to companion test codes for measuring temperature, pressure, flow, gas composition, electrical and other power flows, and sub-component performance (boilers, air heaters, turbines, etc.). The American Society of Mechanical Engineers (ASME) publishes and maintains performance test codes for a wide range of equipment that have a long history of successful use [4].
- Quantifying flue gas emissions – The U.S. Environmental Protection Agency (EPA) has published reference methods for quantifying emissions from stacks for the purpose of demonstration conformance with the site air emission permit. These reference methods have a long history of use in the U.S. and have achieved wide acceptance. Appendix A lists the pertinent U.S. EPA reference methods. The European Commission has published similar reference methods.
The performance testing protocols presented here draw heavily on these two sources.
3.2 Base-case performance testing/process verification
Results from the base-case testing will be used to assess the steady-state performance of the process for the purposes of designing the full-scale plant and estimating capital and operating costs. For this reason, base-case performance testing should be conducted with measurement uncertainty as low as can be reasonably achieved. Therefore, test protocols consistent with well-developed reference methods should be incorporated as much as possible.
3.3 Parametric performance testing
The primary objective of parametric performance testing is to observe the effects on the key performance indices of incremental changes in the various independent variables. While accuracy in measurement is always desired, some bias error in measurements can be tolerated in parametric testing as long as the measurements achieve adequate precision; i.e., the measurement instruments give repeatable values. This condition can usually be met without strict adherence to reference methods that can be very costly to use as frequently as is required for a parametric performance testing program.
4. Test conduct and data collection procedures
4.1 Instruments and methods of measurement
4.1.1 Temperature
Process temperatures are generally not key performance parameters for a PCC plant. Nonetheless, temperature measurements are process condition indicators and care should be taken in their measurement.
No review of process temperature instrumentation was conducted in support of this study. In general, thermocouple or resistance temperature detectors are commonly deployed for process monitoring. These are usually precise enough to give acceptable repeatability without re-calibration. However, care should be exercised in ensuring that electrical temperature measurement signals are correctly wired, correct calibration algorithms are employed, and the resulting temperature is correctly logged and displayed to the operators.
4.1.2 Pressure
Process pressures are generally not key performance parameters for a PCC plant without a pipeline gas compressor. (Pipeline compressor discharge pressure would be a key performance parameter.) Nonetheless, several pressure measurements are process condition indicators and care should be made in their measurement. These include absolute and differential pressures at flow metering installations, absorber flue gas pressure drop, liquid distribution spray pressures, and stripper operating pressure.
No review of process pressure instrumentation was conducted in support of this study. In general pressure transmitters are commonly deployed for process monitoring. The key pressure transmitters, at a minimum, should be recalibrated according to manufacturer’s specifications prior to the onset of parametric testing. Pressure transmitters supporting primary flow measurement calculations should be recalibrated during base-case testing.
4.1.3 Flow
The standard used for flow metering is ASME PTC 19.5 Flow Measurement. Note that high accuracy may not be required for parametric testing where the incremental effect on key performance indices with incremental changes in process conditions is measured. In this case high precision (repeatability) may be an adequate substitute for high accuracy.
The flow meters installed in the PCC plant at TCM DA supporting CHP flue gas are listed in Table 2, respectively. The flow metering locations were indicated in Fig. 1. TORBAR pitot tube-style flue gas flow meters are the predominant choice implemented with single installation of an ultrasonic flow meter (after the DCC). Vortex flow meters are used to measure steam flows to the reboiler. A vortex flow meter is used to meter final CO2 product flow, which is redundant to the TORBAR flow meter.
The flow metering installations have been internally analyzed in detail at TCM DA, identifying the sources of uncertainty in each flow metering location.
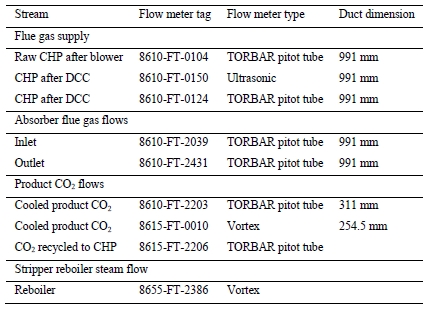
Table 2. Gas and steam flow metering for CHP flue gas applications at TCM DA.
4.1.3.1 TORBAR pitot tube flow meters
The uncertainty in the flow measurements using the TORBAR flow meters was estimated to be slightly greater than 2.5%. Of this, 2% was associated with installation of the TORBAR flow meters, by far the largest uncertainty component. This uncertainty component is a measure of the sensitivity of bias error introduced into the differential pressure indication by misalignment of the flow element in radial dimension and rotational orientation to the flow. The uncertainty associated with installation cannot be effectively estimated short of performing an in-situ flow calibration against a primary standard, and the assignment of 2% uncertainty to this component is somewhat arbitrary; misalignment could result in higher bias errors. Thus, while the flow reading calculated from the TORBAR measured pressure differential, absolute pressure, and temperature may have a precision of approximately 1.8% (precision excludes installation uncertainty), the uncertainty in accuracy may be significantly more than the estimate. The uncertainty associated with installing this class of flow meters generally disqualifies them for use in applications requiring predictable accuracy unless a relative accuracy test audit (RATA) has been performed for the field installation.
4.1.3.2 Vortex flow meter
A vortex meter is installed to meter product CO2. The vortex meter is redundant to a TORBAR meter located nearby. Vortex flow meters are shipped with a flow factor which, when multiplied by the vortex shedding frequency (an internal meter measurement) and fluid density, gives mass flow. The density must be derived from temperature, pressure, and composition measurements. These meters cannot be recalibrated short of performing an in-situ flow calibration against a primary standard.
A vortex flow meter is also used to meter steam flow to the reboiler. It is a linear device that indicates mass flow; thus the calibration range is based on mass flow. This meter is suitable for high accuracy mass flow measurements if it is calibrated under the following conditions:
- Steam flow over the full range expected during operations
- Calibration temperatures and pressures close to the operating temperature/pressure
- Calibration against standards traceable to the National Institute of Standards & Technology (NIST) or equivalent.
4.1.4 Composition
The standard recommended here for high-accuracy gas composition measurements is the use of reference standards commonly employed to monitor compliance with air emissions regulations. Where possible, the use of continuous emissions monitoring (CEM) methods is recommended.
It is recognized that the Fourier Transform Infrared (FTIR)-based systems installed at TCM DA will continue to be used. The relative locations for the sampling points are indicated in Fig. 1. The gas compositions reported by these instruments may be sufficiently accurate and precise to meet the requirements of the standards indicated, but this should be demonstrated against the instruments and procedures in the respective reference methods. The reference methods indicated below should be employed during all base-case testing unless there is clear evidence that the FTIR system gives results that duplicate the reference methods.
4.1.4.1 Flue gas supply and depleted flue gas
Table 3 lists the several flue gas components and the recommended reference methods for quantifying the components. CEMs are available for all non-condensable, non-soluble flue gas components. The condensable/soluble flue gas components and particulate matter require extractive sampling reference methods.
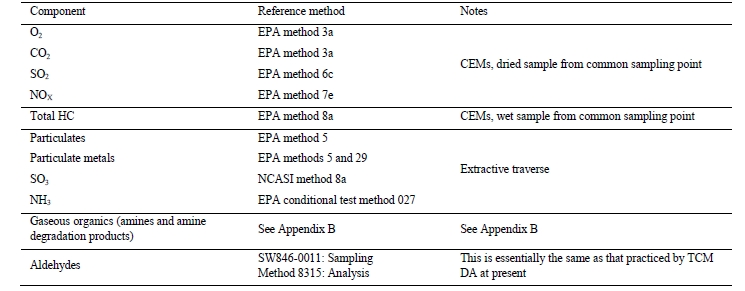
Table 3. Flue gas composition sampling and analysis reference methods.
4.1.4.2 Product CO2
Table 4 lists the several product CO2 components and recommended reference methods for quantifying the components. CEMs are available for all components except NH3.
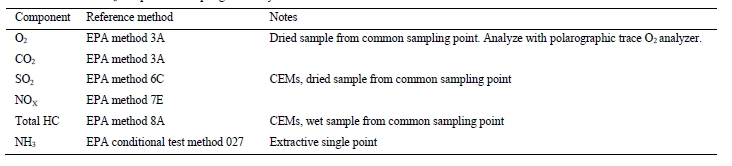
Table 4. Product CO2 composition sampling and analysis reference methods
The most critical parameters for delivery of the product CO2 to receiving pipelines are likely to be O2 content and moisture content. Measurement of trace O2 in any gas stream is challenging. In-situ O2 analyzers commonly used for measurement of flue-gas O2 at levels, which are typically above a few % (vol), are not sufficiently sensitive to accurately quantify trace levels of O2. Trace O2 levels may be quantified by polarographic (fuel cell) analyzers. Paramagnetic analyzers or gas chromatography may also be used but these are likely to add complexity and/or expense without significantly increasing accuracy. All of these techniques require extraction of a gas sample to the analyzer. Care must be exercised to exclude sampling system and instrument air in-leaks and to completely purge the sampling system of air on start-up and after calibrations; even small residues of air (containing 210,000 ppmv O2) will result in erroneously high analyses. Certified trace O2 calibration gases are also required. Moisture control will be part of a pipeline compression package that is not a part of the pilot plant at TCM DA.
Note that CO2 monitoring in the product CO2 stream is for reference only. Instrument readings near 100% cannot be relied on for accuracy at the 99.99% (vol) readings expected. Nitrogen is a likely diluent that can only be quantified by gas chromatography. An N2/O2 ratio cannot be assumed in the product CO2 equal to that in air. Dissolution of O2 in the aqueous amine solution or transfer of flue gas micro-bubbles with release in the stripper cannot be ruled out.
4.2 Instrumentation recommendations
4.2.1 Temperature measurements
- No pre-test calibrations required
- Loop checks should be made on temperature instruments supporting flue gas flow meters and product CO2 flow meters during parametric testing.
4.2.2 Pressure measurements
- Loop checks should be made on pressure instruments during parametric testing
- Pressure transmitters supporting flow meters and product CO2 flow meters should be recalibrated prior to or during all base-case test campaigns.
4.2.3 Flow measurements
- A RATA (see Appendix C) should be conducted, calibrating the three (3) flow metering installations for the CHP flue gas flow between the DCC and the absorber during each base-case test campaign. During this test, data may also be collected at the absorber outlet to calibrate the TORBAR flow metering installation at this location.
- Reboiler steam condensate orifice flow elements should be used to quantify reboiler steam use
- One of the following should be accomplished during base-case testing:
- A RATA (see Appendix C) to calibrate within 2% accuracy the TORBAR flow meter installed to meter the product CO2 flow
- A differential flow element consistent with ASME PTC 19.5 should be at an applicable location to achieve CO2 flow measurement within 2% uncertainty.
4.2.4 Composition measurements
- The FTIR analyzer system should be calibrated against primary calibration standards weekly or on a frequency that results in instrument drift of no more than 2% on calibration gases
- Gas stream sampling and analysis consistent with reference methods indicated in Table 3 and Table 4 should be employed during all base-case test campaigns
- Flue gas sampling ports should be used to sample from the duct near the existing flue gas flow meters
- The depleted flue gas sample should be taken from a probe extending at least 50 cm in from the absorber wall.
5. Calculation and reporting of key performance indices
Performance data collected during operations at TCM DA pilot plant fall generally into two broad classes: 1) data collected during parametric testing to support process model development and identify optimal operating conditions, and, 2) base-case data collected during operation under optimized conditions to verify the performance of the process, modeled parameters, and those key performance indices that are not modeled.
A complete test results report includes:
- List of independent parameters; those parameters under the more or less direct control of the operators that describe the process conditions imposed for the test
- Several key performance indices; dependent parameters that are uniquely determined by the process design and the independent parameters established by the operators.
5.1 Independent parameters
Table 5 lists the measured independent parameters that are likely to influence the key performance indices and should be included as test conditions in any report of process performance.
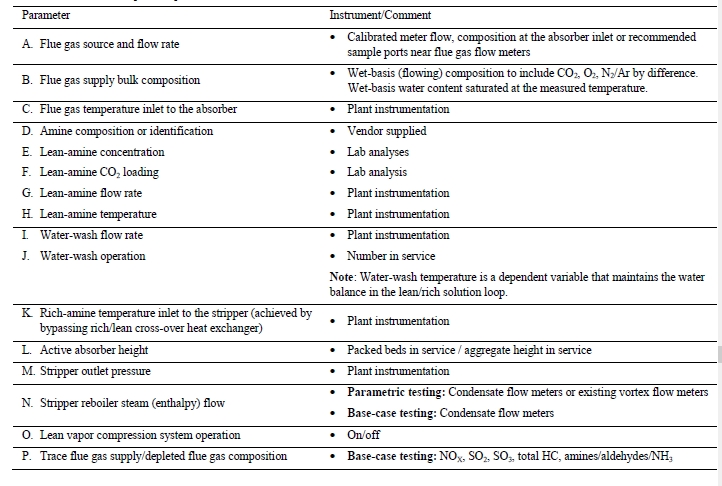
Table 5. Measured independent parameters.
Table 6 lists pertinent independent parameters derived from the measured independent parameters that are likely to be more instructive than the parameters from which they are calculated.
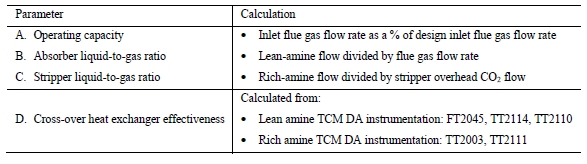
Table 6. Derived independent parameters.
5.2 Test period data results
Test period data include dependent variables that are directly measured parameters as well as key performance indices that are pertinent to calculations of measured values and independent parameters. Table 7 lists the important measured dependent parameters.
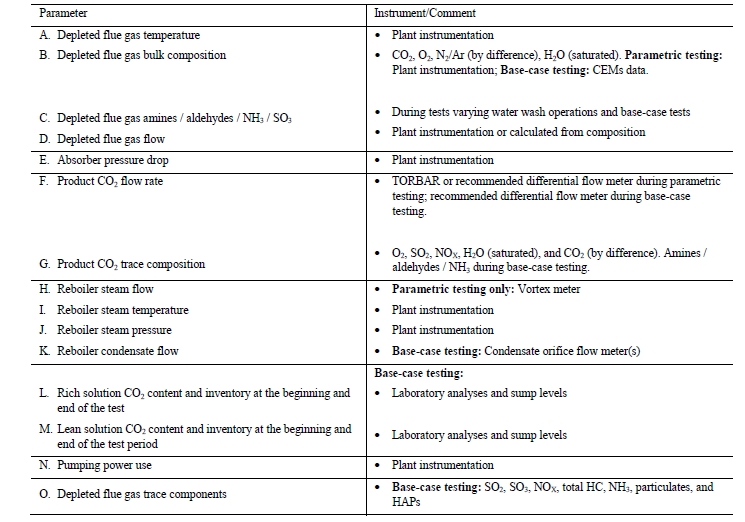
Table 7. Measured dependent parameters.
Table 8 lists the key performance indices. Each test period report should include these data.
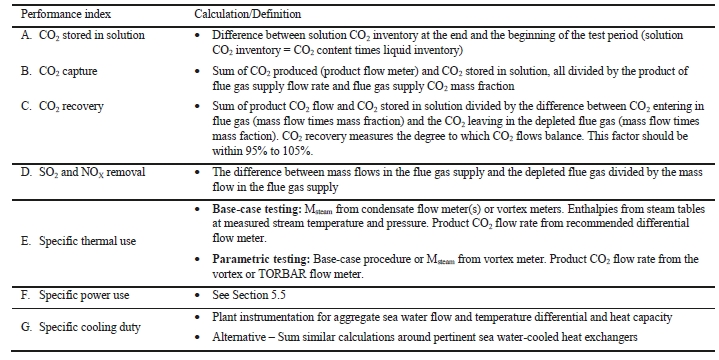
Table 8. Calculated key performance indices.
Fig. 3 lays out the general CO2 flows. Note that CO2 leakage to atmosphere is included as a flow. As leakage flows cannot be measured directly, it does not enter into the calculations. Its inclusion here is simply to acknowledge that leakage flow is a possibility. CO2 accumulation is the amount of CO2 stored within the amine pilot-plant boundaries over the course of a test; CO2 may accumulate in (or be released from) the rich/lean solution over the course of a test period.
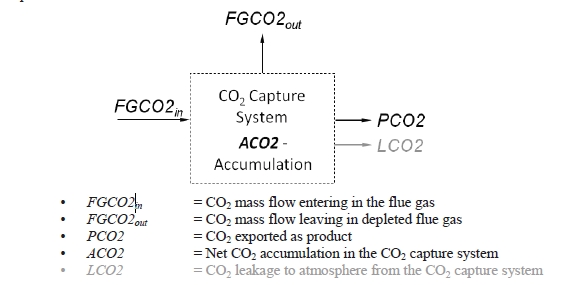
Fig. 3. CO2 capture flow diagram.
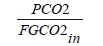
Three general methods of calculating CO2 capture efficiency are:
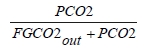
- The ratio of measured high-purity product CO2 flow to the CO2 entering the absorber in the flue gas is given by:
- The ratio of measured high-purity product CO2 flow to the sum of the high-purity product CO2 flow and the CO2 flow leaving the absorber in the depleted flue gas is given by:
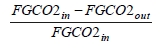
- The ratio of the difference between the CO2 entering the absorber in the flue gas and the CO2 leaving the absorber in the depleted flue gas to the CO2 entering the absorber in the flue gas is given by:
The relative uncertainties in CO2 capture by these three methods, using various combinations of flow meter data, were assessed. The conclusion is that uncertainty in CO2 capture is minimized in Method 2 above, assuming that the CO2 entering the capture plant is the sum of the two measured CO2 flows out of the plant: 1) PCO2 – High-Purity Product CO2 and 2) FGCO2out – CO2 Emitted in the Depleted Flue Gas Leaving the Absorber.
As the specific thermal use and specific cooling duty will be calculated using the measured product CO2 flow, the CO2 capture should also make use of the measured CO2 product flow. This recommends against Method 3, which uses only flue gas CO2 flows.
Key independent parameters that characterize CO2 capture plant performance include inlet flue gas flow rate as a % of design and absorber liquid/gas ratio, both of which use measured inlet flue gas flow rate. To the extent that absorber operation details are to be assessed and reported as key performance indices, corresponding reported CO2 capture should also be based on the measured inlet flue gas CO2 flow. This recommends against Method 2 despite its identification as the least uncertain method. In any event, sufficient data will be collected during operations to calculate and report CO2 capture by all methods.
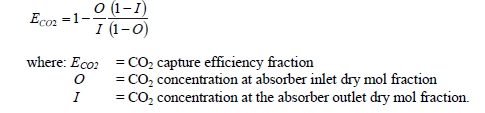
Note that a 4th method might be considered using only dry-basis CO2 concentrations for the absorber inlet and depleted flue gas streams and assuming all dry components other than CO2 pass through the absorber unchanged. This 4th method requires no flow measurements and is given by:
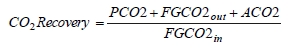
For all test periods, CO2 recovery should be reported. This parameter is an indicator for the overall uncertainty in test results:
CO2 emissions are not included in the key performance indices listed in Table 8. Measuring CO2 emissions for the purposes of meeting air emissions regulations will likely require traverse sampling for composition and velocity from the stack.
CO2 emissions may be estimated by subtracting the sum of the (direct-measured) product CO2 flow (PCO2) and the CO2 stored in solution (ACO2, calculated) from the flue gas supply CO2 flow (FGCO2in). Note that this method of calculating CO2 emissions is a comparatively small difference in two large numbers and carries considerable uncertainty.
5.4 Specific thermal use
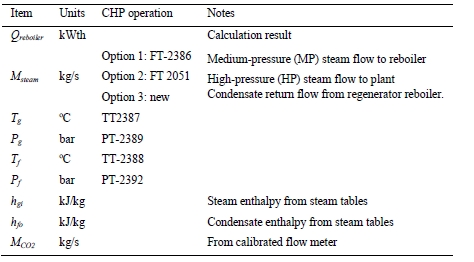
Specific thermal use is the heat supplied by imported steam, primarily to the stripper reboiler, divided by the product CO2 flow. The calculation for this parameter:
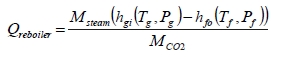
Details on each term in this equation are given in Table 9.
5.5 Electrical utility use
The primary auxiliary power uses for PCC are the induced draft (ID) fan (to overcome flue gas pressure drops in the plant), the aggregate of solution and water pumping inside the plant, and the CO2 compressor (to deliver at pipeline pressure; the TCM DA pilot plant does not have a CO2 pipeline compressor). The ID fan use will correlate most closely to flue gas flow rate. The internal pumping power loads will correlate loosely with CO2 production. Thus, it is unlikely that any single parameter will be useful in describing process auxiliary power use. In practice, pumping power differences from varying the independent parameters during parametric testing are likely to be insignificant. ID fan load will change with flue gas supply flow rate and, possibly, liquid flows in the absorber tower. Both of these factors are included in the ID fan pressure rise and flue gas flow rate. Auxiliary power use for a full-scale process can be estimated by:
- Summing the full-scale pumping loads
- Modeled ID fan power use from design flow rate and required pressure rise measured at pilot scale
- Modeled compressor power used to compress the product CO2 from stripper column overhead pressure and specified compressor discharge pressure to deliver to the receiving pipeline.
These can be developed from parameters included in Table 7 and a specified receiving pipeline pressure.
6. Conclusions
A generic CO2 capture testing methodology that has been applied at multiple sites providing details on the procedure, its key performance indices and their associated specifications, as well as the required pre-test work has been presented. Specific application of the methodology for the CO2 Technology Centre Mongstad site, a CO2 capture testing facility located in Norway that performed CO2 capture tests using MEA, is shown as an illustrative example.
Acknowledgements
The authors gratefully acknowledge the staff of TCM DA, Gassnova, Statoil, Shell, Sasol, and Aker Solutions for their contribution and work at the TCM DA facility.
The authors also gratefully acknowledge Gassnova, Statoil, Shell, and Sasol as the owners of TCM DA and Aker Solutions for their financial support and contributions.
Appendix
References
- Hamborg E S, Smith V, Cents T, Brigman N, Falk-Pedersen O, De Cazenove T, Chhaganlal M, Feste J K, Ullestad Ø, Ulvatn H, Gorset O, Askestad I, Gram L K, Fostås B F, Shah M I, Maxson A, Thimsen D. Results from MEA testing at the CO2 Technology Centre Mongstad. Part II: Verification of baseline results. Energy Procedia; 2014.
- Brigman N, Shah M I, Falk-Pedersen O, Cents T, Smith V, De Cazenove T, Morken A K, Hvidsten O A, Chhaganlal M, Feste J K, Lombardo G, Bade O M, Knudsen J, Subramoney S C, Fostås B F, De Koeijer G, Hamborg E S. Results of amine plant operations from 30 wt% and 40 wt% aqueous MEA testing at the CO2 Technology Centre Mongstad. Energy Procedia; 2014.
- Morken A K, Nenseter B, Pedersen S, Chhaganlal M, Feste J K, Tyborgnes R B, Ullestad Ø, Ulvatn H, Zhu L, Mikoviny T, Wisthaler A, Cents T, Bade O M, Knudsen J, De Koeijer G, Falk-Pedersen O, Hamborg E S. Emission results of amine plant operations from MEA testing at the CO2 Technology Centre Mongstad. Energy Procedia; 2014.
- Performance test code on overall plant performance. ASME PTC-46. ASME. New York, NY; 1996.
- Certification of calibration traceable to the NIST. Colorado Engineering Experiment Station, Inc. 10EHA-0001_1: 24; August 2010.
- Working group review of sampling and analytical methods for amines and amine degradation products in post-combustion carbon capture technologies. EPRI. Palo Alto, CA; 2012; 1026867.
- PTC 19.5 flow measurement. ASME. New York, NY; 2004.
- Guidelines for flue gas flow rate monitoring. EPRI. Palo Alto, CA: 1995; TR-104527.
- Fluid flow in closed conduits using tracers: Measurement of gas flow by transit time using radioactive tracers. BS 5857-2.4; 1980.