
1. Techno-Economic Assessment of Emissions Mitigation Technologies for Post-Combustion CO2 Capture Using AMP/PZ (2024)
Laura Herraiza, Eirini Skylogiannib, Diego Di Domenico Pintoc, Koteswara Rao Puttad, JoshuaC. Morgane, Michael Matuszewskie, Peter Moserf, Georg Wiechersf, Mijndert van der Speka, Peter van Osb, Susana Garcíaa,*
aResearch Centre for Carbon Solutions, School of Engineering and Physical Sciences, Heriot-Watt University, EH14 4AS Edinburgh, United Kingdom
*E-mail address: s.garcia@hw.ac.uk
bTNO, Leeghwaterstraat 44, 2628 CA Delft, The Netherlands
cHovyu B.V., 3118 JW – Schiedam, The Netherlands
dTechnology Centre Mongstad (TCM), Mongstad 71, 5954 Mongstad, Norway
eNational Energy Technology Laboratory (NETL), 626 Cochrans Mill Road, Pittsburgh PA, 15236
fRWE Power AG, Ernestinenstrasse 60, 45141 Essen, Germany
Abstract
Minimizing the environmental impacts of amine-based post-combustion carbon capture technologies is essential for meeting environmental permitting regulations and ensuring public acceptance. Experimental test campaigns at the CO2 capture pilot plant in Niederaussem using CESAR1 demonstrated that integrating available emission abatement technologies can significantly reduce the concentration of amines and degradation products in CO2-depleted flue gas to below the detection limit of an infrared spectrometer. The study confirmed that proprietary dry bed technology (OEASE Aerozone™) or a second water wash can lower AMP and PZ emissions to below 1 mg/Nm³. However, to achieve very low NH3 emissions below 2 mg/Nm³, an acid or other chemically active wash downstream of the water wash is required. A configuration with a dry bed or a double water wash results in a carbon capture cost (CCC) of 44 €/tCO2, and a CO2 avoided cost (CAC) of 86 €/tCO2. A configuration with an acid wash increases the CCC to 47 €/tCO2 and the CAC to 90 €/tCO2 due to the amine losses in the acid waste and its treatment.
Keywords: AMP; PZ; CESAR1; emissions mitigation technologies; aerosols; volatile emissions; techno-economic assessment; dry bed; water- wash; acid-wash.
1. Introduction
Among various CO2 capture technologies, CO2 absorption in aqueous amine solutions stands out as the most extensively utilized process for large-scale point-source emitters. CESAR1, an aqueous blend of 27wt% 2-amino-2- methyl propanol (AMP) and 13wt% piperazine (PZ), presents enhanced properties representative of advanced solvent systems, particularly higher CO2 working capacity and lower energy requirements for solvent regeneration. These characteristics can lead to improved process economics. Consequently, CESAR1 serves as a more credible benchmark in comparison to conventional monoethanolamine (MEA). Since its development in the framework of the European Union project CESAR [1], this non-proprietary solvent has undergone extensive testing. Testing programs for CESAR1 have been conducted at various facilities, including the Technology Centre Mongstad (Norway), the SINTEF pilot rig at Tiller, Trondheim (Norway), the RWE’s Innovation Centre at Niederaussem (Germany), and the PACT facilities at Sheffield (UK) [2–4] .
The technology, however, comes with challenges, particularly concerning solvent emissions and solvent degradation arising from undesired side reactions. These challenges accentuate the necessity for more frequent solvent replacement and the implementation of effective methods for treating solvent waste. Addressing these challenges, real- life testing of individual emissions mitigation technologies is being carried out in industrial environments representative of a diverse range of end-users. This initiative is part of the ACT-funded project SCOPE, which stands for Sustainable OPEration of post-combustion Capture plants [5].
Emissions mitigation technologies including single water wash, dry-bed, double water wash and acid wash downstream of the absorber column and pre-treatment of the flue gas upstream the absorber column (e.g., Brownian Demister Unit (BDU), turbulent pre-treatment) have been proven to reduce volatile and aerosol emissions even below the detection threshold for a range of flue gas characteristics [2]. Long-term pilot plant testing aims to evaluate the emissions reduction benefits of these technologies over an extended period. Beyond evaluating their performance, it is crucial to conduct a comprehensive assessment of the additional investment and operational costs to make well- informed strategic decisions regarding the adoption and implementation of these technologies.
This study provides a comprehensive techno-economic assessment of incorporating emissions mitigation technologies into an amine-based CO2 capture system, which is operated with CESAR1. The assessment encompasses a diverse range of emissions mitigation technologies, all of which have undergone experimental testing at the CO2 capture pilot-plants located at RWE’s Innovation Centre at Niederaussem.
2. Emission mitigation technologies for post-combustion CO2 capture
The emission mitigation strategies considered in the techno-economic analysis conducted in this study are based on the learnings and knowledge generated during a long-term experimental test campaigns with CESAR1 at RWE’s CO2 capture pilot plant at Niederaussem. These technologies are scaled-up to be integrated with an 850 MWe lignite- fired power plant with CO2 capture and CO2 compression up to 110 bar. For this study, we considered four case studies represented in Fig. 1:
- Single water wash – serving as the base case technology.
- Proprietary dry bed (OASE aerozoneTM) – positioned upstream of the water wash.
- Double water wash – consisting of two consecutive water wash systems.
- Water wash and acid wash – adding an acid wash to the water wash.
The techno-economic analysis in this work focuses on assessing the economic feasibility of the emission mitigation strategies described above by quantifying the capital and operational cost associated with their implementation in a large-scale lignite-fired power plant. The four investigated technologies were tested at RWE’s CO2 capture pilot plant under real flue gas conditions to experimentally determine their effectiveness in reducing amine emissions and solvent losses.
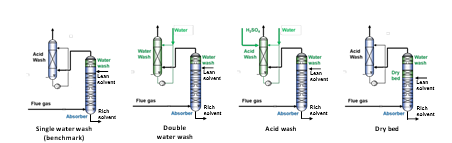
Fig. 1. Emission mitigation technologies considered in this study.
3. Results and discussion
The techno-economic analysis in this work assesses the capital and operational cost of implemented the emission mitigation strategies in an 850 MWe lignite-fired power plant with amine-based post-combustion capture using CESAR1 solvent. The emission mitigation technologies are compared based on their environmental benefits – such as reduction in AMP, PZ and NH3 emissions, as well as reduction in solvent losses – and their economic performance, evaluated through indicators including the carbon capture cost (CCC) and the CO2 avoided cost (CAC).
3.1 Emissions reduction
Test campaigns at RWE’s CO2 capture pilot plant at Niederaussem as part of the ACT-funded project SCOPE (SCOPE, 2024) focused on optimizing the performance of various emission mitigation technologies. The techno- economic analysis within this study considers emissions data from experimental tests at high capture rate, above 95%, conducted under operational conditions that predominantly result in volatile emissions, presented in Fig. 2. In the base case configuration with a single water wash, AMP concentrations ranged from 40 to 70 mg/Nm3, PZ concentrations from 3.5 to 9 mg/Nm3 and NH3 concentrations from 3 to 6 mg/Nm3 in the CO2-depleted flue gas leaving the water wash at 45 °C. Individual emission mitigation technologies, such as a dry bed, a double water wash or an acid wash, significantly reduce AMP and PZ emissions below the detection limit of FTIR analysis, regardless of the particle number concentration in the flue gas. However, acid wash is required to effectively reduce NH3 emissions below 2 mg/Nm3. Emission data in Fig. 2 and solvent degradation of approximately 0.22 kg amines per tonne of CO2 captured are considered to evaluate the operational cost associated with solvent replacement.
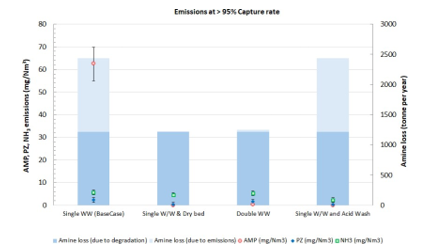
Fig. 2. Emission data and solvent loss measured at > 95% CO2 capture rate with each emission mitigation technology.
3.2 Carbon capture cost (CCC) and CO2 avoided cost (CAC)
The CCC and the CAC are presented in Fig. 3 and Fig. 4 respectively, including a breakdown of the CAPEX, fixed and variable OPEX contributions. The CAPEX contribution represents a significant share of the CCC for a solvent-based post-combustion capture specifically designed to capture CO2 from the exhaust flue gas of a lignite- fired power plant. The contribution of the variable OPEX to the CAC becomes higher, compared to the contribution to the CCC, since it includes the costs for CO2 transport and permanent storage. Implementing a dry bed or an additional water wash stage effectively reduces amine emissions and can decrease both CCC and CAC compared to a single water wash setup. Specifically, the CCC decreases from 45.2 €/tCO2 to 44.2 €/tCO2, and the CAC from 87.3 €/tCO2 to 86.1 €/tCO2. This reduction occurs because the higher initial CAPEX—attributed to additional packing and internal components in the absorber column—is balanced by lower operating costs from reduced solvent losses. Conversely, incorporating an acid wash to mitigate ammonia emissions raises variable OPEX due to losses of amines and ammonia in the acid waste, along with its associated disposal and treatment costs. This increases both CCC and CAC to 46.9 €/tCO2 and 90.2 €/tCO2, respectively, compared to the base case with a single water wash.
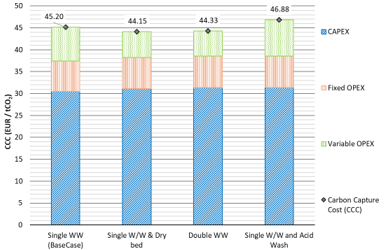
Fig. 3. Carbon Capture Cost for each mitigation technology.
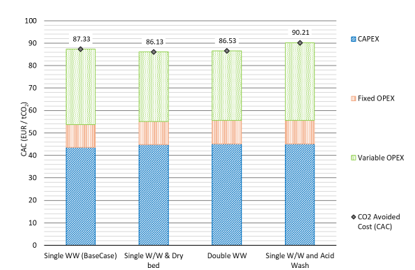
Fig. 4. CO2 Avoided Cost for each emission mitigation technology.
4. Conclusions
This study provides a techno-economic analysis of four emission mitigation technologies for an amine-based CO2 capture process using CESAR1, achieving a 95% capture rate in a lignite-fired power plant. The analysis incorporates performance parameters, solvent emission, and degradation data from an experimental test campaign conducted at RWE’s carbon capture pilot plant in Niederaussem.
Results from the test campaign indicate that a single water wash system is insufficient for effective emission control compared to combined approaches. Double water wash systems can further decrease volatile amine emissions, while a dry bed is also effective, reducing AMP and PZ emissions close to or below the FTIR detection limit of approximately 1 ppmv. To reduce NH3 emissions to low levels, typically below 2 mg/Nm³, an acid or chemically active scrubber is necessary downstream of the water wash.
Implementing individual emission mitigation technologies, such as a dry bed or a second water wash, slightly reduces the Capture Cost of Carbon (CCC) from 45.2 €/tCO2 to 44.2 €/tCO2 and the Cost of Avoided Carbon (CAC) from 87.3 €/tCO2 to 86.1 €/tCO2. These reductions occur as the higher capital expenditure (CAPEX) for added packing and column components is offset by lower operational expenditure (OPEX) through reduced solvent losses and the recovery of volatile amines. However, adding an acid wash leads to amine losses in the acid waste, raising variable OPEX and thus increasing both CCC and CAC to approximately 46.9 €/tCO2 and 90.2 €/tCO2, respectively.
The findings suggest that implementing emission mitigation technologies is necessary to meet regulatory standards, with potential marginal reductions in CAC and CCC. Differences in the costs of various emission mitigation technologies are relatively minor and fall within the typical uncertainty range of AACE Class 4 cost estimates.
Acknowledgements
The SCOPE project is funded through the ACT programme (Accelerating CCS Technologies, Horizon2020 ACT 3 Project No 327341). Financial contributions made by the Research Council of Norway (RCN), Rijksdienst voor Ondernemend Nederland (RVO), Department for Business, Energy & Industrial Strategy UK (BEIS), Forschungszentrum Jülich GmbH, Projektträger Jülich (FZJ/PtJ) Germany, Department of Energy (DoE) USA and Department of Science and Technology (DST) India are gratefully acknowledged. Cash contribution from the Norwegian industry partners to the Research partners in Norway and from MIPL to the other partners in India is also highly appreciated.
References
- CESAR, CO2 Enhanced Separation and Recovery (CESAR). Integrated Research Project Partially Funded by the European Commission under the 7th Frame Work Program, Grant Agreement Number 213569, (2011).
- P. Moser, G. Wiechers, S. Schmidt, J.G.M.S. Monteiro, E. Goetheer, C. Charalambous, A. Saleh, M. van der Spek, S. Garcia, ALIGN-CCUS: Results of the 18-month test with aqueous AMP/PZ solvent at the pilot plant at Niederaussem – solvent management, emissions and dynamic behavior, International Journal of Greenhouse Gas Control 109 (2021). https://doi.org/10.1016/j.ijggc.2021.103381.
- Y. Artanto, J. Jansen, P. Pearson, G. Puxty, A. Cottrell, E. Meuleman, P. Feron, Pilot-scale evaluation of AMP/PZ to capture CO2 from flue gas of an Australian brown coal-fired power station, International Journal of Greenhouse Gas Control 20 (2014) 189–195. https://doi.org/10.1016/j.ijggc.2013.11.002.
- M. Campbell, A. Sundus, A. Knarvik, Z. Muhammad, W. Ahmad, CESAR1 Solvent Degradation and Thermal Reclaiming Results from TCM Testing, Proceedings of the 16th Greenhouse Gas Control Technologies Conference (GHGT-16) (2022). https://papers.ssrn.com/sol3/papers.cfm?abstract_id=4286150 (accessed June 28, 2024).