
4. Development of process model of CESAR1 solvent system and validation with large pilot data (2022)
Joshua C. Morgana,b,*, Matthew Campbellc, Koteswara Rao Puttac, Muhammad Ismail Shahc, Michael Matuszewskia,b, Benjamin Omella
a National Energy Technology Laboratory (NETL), 626 Cochrans Mill Road, Pittsburgh PA, 15236
b NETL Support Contractor, 626 Cochrans Mill Road, Pittsburgh PA, 15236
c CO2 Technology Centre Mongstad, Mongstad 71, 5954 Mongstad, Norway
*Corresponding author. Tel.: +1-412-386-5357, E-mail address: Joshua.Morgan@netl.doe.gov

Abstract

The United States (U.S.) Department of Energy (DOE)-sponsored Carbon Capture Simulation for Industry Impact (CCSI2) is collaborating with Norway’s Technology Centre Mongstad (TCM) on the development and validation of a process model of the CESAR1 solvent system for post-combustion carbon capture applications. The CESAR1 solvent, developed through the CO2 Enhanced Separation and Recovery (CESAR) project, is an aqueous blend of 2-amino-2-methyl-1-propanol (AMP) and piperazine (PZ) with concentrations of approximately 3 M and 1.5 M, respectively. The process model, developed in the Aspen Plus® software platform, uses thermodynamic and kinetic models from the AMP-H2O-CO2 and PZ-H2O-CO2 system models distributed by Aspen Tech. Enhancements in this work include calibrating the interaction parameters for the AMP-PZ pair with thermodynamic data from the open literature for the AMP-PZ-H2O-CO2 system and updating the reaction kinetics parameters to ensure thermodynamic consistency with the chemical equilibria. The process model is validated with a set of seven steady-state test runs, collected over a wide range of operating conditions at the pilot plant at TCM (12 MWe scale) with natural gas-based combined cycle turbine flue gas (~ 3.5 vol% CO2). The integrated process model developed for the TCM pilot plant includes rate-based models for the CO2 absorption and solvent regeneration processes and predicts key output variables (e.g., CO2 capture percentage, specific reboiler duty) within ± 5% for the validation data set. This paper presents model development and validation work for an initial version of the CESAR1 process model along with discussion of future updates to be made to the model prior to its open-source release.
1. Introduction
The United States (U.S.) Department of Energy (DOE)-sponsored Carbon Capture Simulation for Industry Impact (CCSI2) is a collaboration among national laboratories, industry organizations, and academic institutions focused on application of the open-source toolset developed through its predecessor program, Carbon Capture Simulation Initiative (CCSI) [1]. The CCSI Toolset (https://github.com/CCSI-Toolset) includes a suite of computational tools and models for accelerating the development, deployment, and scale-up of CO2 capture technologies. This toolset includes a process model, implemented in Aspen Plus®, of a monoethanolamine (MEA)-based carbon capture process, which was validated with steady-state data from the National Carbon Capture Center (NCCC) [2–3] and Technology Centre Mongstad (TCM) [4], at scales of 0.5 and 12 MWe, respectively. TCM, owned jointly by Gassnova, Equinor, Shell, and TotalEnergies, is the world’s largest facility for evaluation of novel process technologies in the carbon capture and storage (CCS) field. The TCM staff also provides expertise in process modeling and analysis in addition to 10 years of experience in CCS process operation. In a recent work by Putta et al. [5], TCM has collaborated with Aspen Tech on a rigorous economic analysis of a natural gas combined cycle (NGCC) power plant integrated with an aqueous MEA CO2 capture system achieving 90% capture. This work uses a model of the MEA system that has been validated with process data from TCM for operation with various flue gas sources: natural gas-based (~ 4 vol% CO2), steam- methane reform-based (~ 8-10 vol% CO2), and coal-based (~ 12-14 vol% CO2). In contrast, the previous MEA model developed by the CCSI/CCSI2 team [2–4] has been validated with NCCC data for 7-12 vol% CO2 flue gas and TCM data for 8-10 vol% CO2 flue gas and has yet to be re-evaluated for operation with natural gas-based flue gas.
This paper is based on a collaboration between CCSI2 and TCM focused on the development and validation of a process model of a second-generation amine solvent (CESAR1) for point source carbon capture applications. The CESAR1 solvent, developed through the CO2 Enhanced Separation and Recovery (CESAR) project, is an aqueous blend of 2-amino-2-methyl-1-propanol (AMP) and piperazine (PZ) with concentrations of approximately 3 M (5 m) and 1.5 M (2.5 m), respectively. This corresponds to an aqueous solution of approximately 27 wt% AMP and 13 wt% PZ. This solvent blend has been identified as an improvement over MEA, long considered the nonproprietary standard for solvent-based carbon capture, due to the combination of high reactivity associated with PZ and the lower heat of absorption of AMP, which leads to a reduction in solvent regeneration energy requirement [6–7] as well as stability of the solvent (lower solvent degradation rates).
In this work, the CESAR1 process model was developed by combining existing thermodynamic models distributed with Aspen Tech software of the CO2-loaded aqueous PZ [8] and AMP [9] systems and regressing the interaction parameters for the PZ–AMP pair to fit CO2 partial pressure [6, 10] data for the temperature range of 40–120℃ and heat of absorption data for 40–80℃ [10–11]. A simulation of the pilot plant at TCM was developed in Aspen Plus, with absorber and stripper columns modeled as rate-based columns. In the absorber model, reactions are specified on activity basis with forward and reverse kinetic parameters fit to ensure consistency with the chemical equilibria calculated from the solution thermodynamic model. The process model is validated with seven steady-state data sets from the TCM pilot plant, and the overall model validation set includes variation in solvent (35000–65000 kg/hr) and flue gas flowrates (60000–70000 kg/hr), solvent CO2 loading (0.049–0.176 mol CO2/mol alkalinity), and absorber packing height (12–24 meter). The process model accurately predicts, generally within ± 5%, the key output variables of interest for the process, including percentage of CO2 capture from absorption and reboiler duty for solvent regeneration. Finally, future work on the CESAR1 model, which will be released to the open-source CCSI Toolset in the near future, is discussed. This includes sub-model level uncertainty quantification (UQ) and the extension of the thermodynamic model to operating conditions for the water wash column to allow for accurate characterization of solvent emissions.
2. Model Development
2.1 Thermodynamic Model
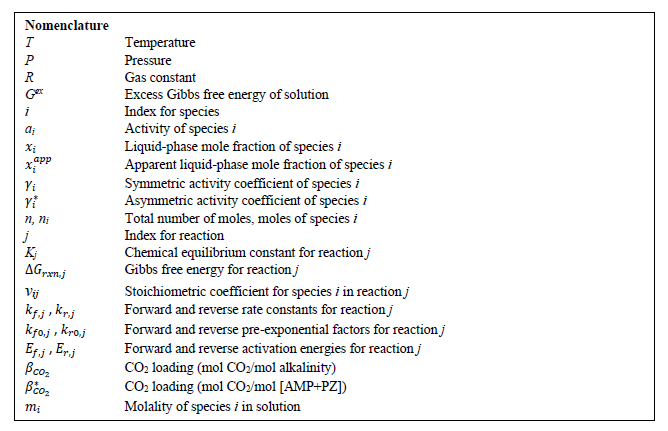
The thermodynamic models for the CO2-loaded aqueous PZ and AMP systems were adapted from the documentation distributed with Aspen Tech software [8–9]. In these models, the liquid and vapor phase fugacity values are calculated from the electrolyte non-random two liquid (e-NRTL) model [12] and the Redlich-Kwong equation of state, respectively. Thermodynamic data of relevance to the combined AMP-PZ-H2O-CO2 system were identified from the literature. Hartono et al. [10] includes CO2 partial pressure data and heat of absorption for solutions at 40–80℃. Brúder et al. [6] includes a CO2 partial pressure data set that is generally consistent with that of Hartono et al. [10], but also includes data for 100–120℃, the temperature range of interest for stripping CO2 from solvent. A data set for heat of absorption for solutions at 40–80℃ from Xie et al. [11] was also identified. The parameters of interest for characterizing the AMP-PZ interaction in the activity coefficient model are embedded in the local interactions term in the e-NRTL model for excess Gibbs energy, which is related to the activity coefficient as follows:
A summary of the e-NRTL activity coefficient model and the details of the parameters used for fitting solvent- based CO2 capture systems is found in our previous work on thermodynamic modeling of the aqueous MEA system [13]. The regressed parameter values for the molecule-molecule interaction for the AMP/PZ pair are given in Table 1. These values were estimated through use of a maximum likelihood objective function implemented in the Aspen Plus data regression system.

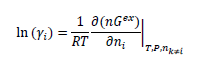
When developing this model, it was assumed that the binary pair parameters for the AMP-PZ interaction are symmetric, in that the values for NRTL/1 and NRTL/2 are equal for (AMP/PZ) and (PZ/AMP) pairs. It was found that simultaneous regression of the parameters for (PZ/AMP) in addition to those for (AMP/PZ) did not result in a statistically significant improvement in the model. Furthermore, the model fit did not significantly improve when regressing electrolyte pair parameters for the AMP-PZ interaction. The fit of the model to CO2 partial pressure and heat of absorption data is shown in Figures 1–2, respectively.
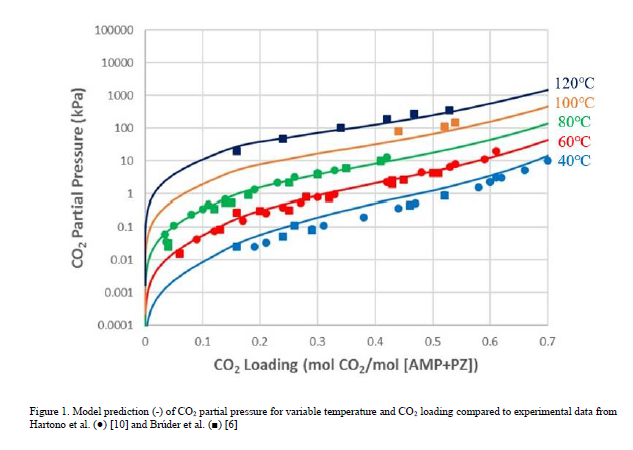
As shown in Figures 1-2, the model generally gives good prediction of the CO2 partial pressure isotherms and captures the trend of heat of absorption with respect to the lean loading. For the CO2 partial pressure, the R2 values for the model fits are 0.922 for data from Brúder et al. [6] and 0.876 for data from Hartono et al. [10]. There is some discrepancy among the two data sources used for heat of absorption [10–11] and the effect of temperature on heat of absorption is unclear. The model predicts that the magnitude of heat of absorption increases with temperature, consistent with the observation for the aqueous MEA system [13]. As a result of this discrepancy, the R2 values for the model fit are lower for the heat of absorption than for the CO2 partial pressure – 0.835 for the data from Hartono et al. [10] and 0.815 for the data from Xie et al. [11]. As the model fit to both heat of absorption and CO2 partial pressure data is generally good at 40°C and 60°C, it is expected that the model will predict with reasonable accuracy absorber operation, in terms of both CO2 capture and temperature bulge due to the exothermic reaction between CO2 and amine. Since no heat of absorption data are available for temperatures above 80°C, the heat of absorption is extrapolated in the modeling of the stripper column, and further analysis would be required to determine the effect this has on model accuracy. Further improvements to the thermodynamic model would likely require uncertainty quantification, for which discussion is forthcoming, or reevaluation of the accuracy of the thermodynamic models of the AMP-H2O-CO2 and PZ-H2O-CO2 subsystems.
2.2 Chemical Equilibrium and Kinetic Models
In this work, the solution chemistry for the AMP-PZ-H2O-CO2 system is represented by the equilibrium reactions shown in Table 2 [8-9].
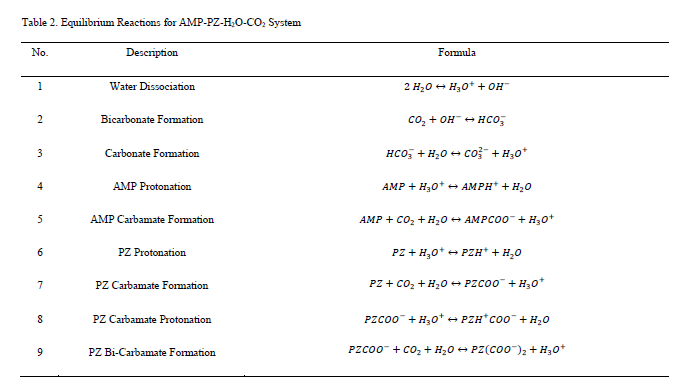
The aggregate reaction set includes amine-independent reactions (No. 1–3) that describe the interactions of CO2 and H2O in addition to reactions specific to each amine sub-system. The amine-specific reactions are represented schematically in Figure 3.
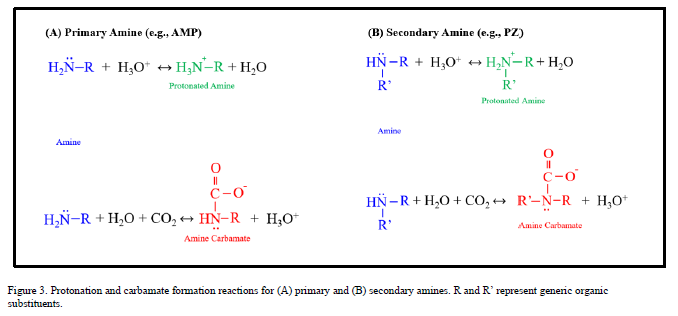
The chemistry of AMP (No. 4–5), a sterically hindered primary amine, is typical for a CO2-loaded aqueous amine system. The amine molecule is in equilibrium with its protonated form through a proton exchange reaction. The amine also forms a carbamate through displacement of a proton by CO2. The chemistry of PZ (No. 6-9), a cyclic compound with two secondary amine groups is more complex in that the additional amine group on the PZ carbamate ion [PZCOO-] can react with hydronium to form a zwitterion [PZH+COO-] or with CO2 to form a bi-carbamate ion [PZ(COO-)2]. For each equilibrium reaction (j), the chemical equilibrium constant is defined as:
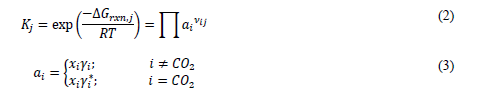
Note that CO2 is defined as a Henry component in the model. Thus, the activity is defined in terms of the asymmetric activity coefficient, whereas the symmetric activity coefficient is used for all other species. As in the process models distributed with Aspen Plus [8–9], only the reactions involving CO2 are represented as kinetic reactions in the absorber model. These are summarized in Table 3.
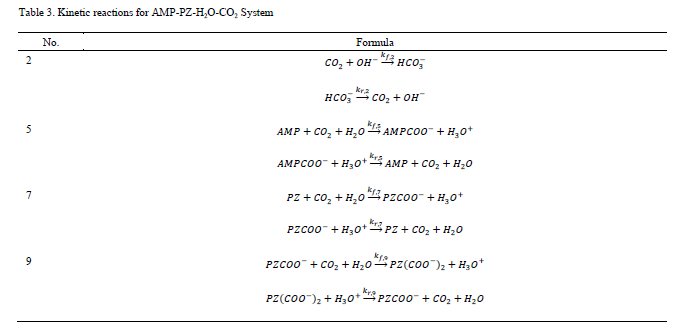
For each reaction (j) for which kinetics are defined, the rate expressions for both forward and reverse reactions are in elementary form and use activity as the concentration basis. The forward reaction rate constants are represented as:
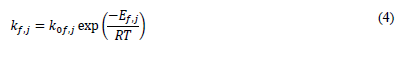
The reverse reaction rate constants are defined analogously. Kinetic parameters for all reactions are given in Table 4.
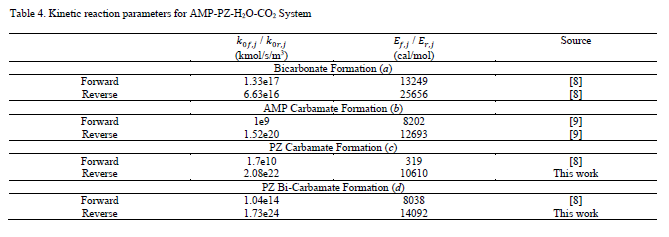
In determining the kinetic parameters for the individual reactions, the rate constants of the forward and reverse reactions should be related to the chemical equilibrium by:
As the kinetic parameter values provided for the bicarbonate formation and AMP carbamate formation reaction in the Aspen Tech models [8–9] are consistent with the chemical equilibria as shown in Eq. 5, these parameter values are also used in this work. This consistency was not observed for the PZ carbamate and bi-carbamate formation reactions, and the reverse rate parameters (𝑘0𝑟,𝑗 and 𝐸𝑟,𝑗) were adjusted to ensure that Eq. 5 is also satisfied for each reaction. This model update was found to be essential not only for ensuring consistency between thermodynamic and kinetic sub-models, but also for obtaining adequate prediction of absorber performance.
2.3 Pilot Plant Model
A schematic of the TCM pilot plant, on which the process model is based, is shown in Figure 4.
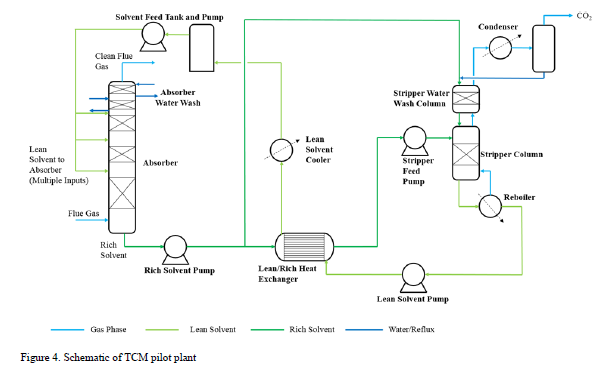
This process represents a typical post-combustion carbon capture system, with two notable process enhancements. The absorber tower consists of two 6-meter packed beds and one 12-meter bed for gas/solvent contacting. There are three inlets to the absorber for the CO2-lean solvent so that testing may be performed with either 12, 18, or 24 meters of packing. Moreover, a bypass system is included so that a fraction (~ 20%) of the CO2-rich solvent exiting the absorber is bypassed from the lean/rich heat exchanger and heated in the stripper water wash column by the vapor exiting the top of the stripper. This process configuration was implemented at TCM to reduce the required energy input to the reboiler. The flowsheet shown in Figure 4 is implemented in Aspen Plus V11, using the thermodynamic and kinetic models described in the previous sections. The absorber and stripper are modeled as rate-based columns with mass transfer and interfacial area models based on the work of Bravo et al. [14]; the liquid hold-up in the absorber column uses the model of Billet and Schultes [15]. The model of the absorber water wash was not included in this work because it was not needed for validation of the absorber/stripper loop but it will be developed in future work focused on prediction of amine emissions, for which discussion is forthcoming.
3. Model Validation
Seven steady-state data sets, collected at TCM during a test campaign in September–October 2019 sponsored by the Accelerating Low Carbon Industrial Growth through Carbon Capture, Utilisation, and Storage (ALIGN-CCUS) program [16], are used to validate the process model. Shown in Table 5, the overall data set includes substantial variation in process operating conditions, including absorber packing height and the flowrates of circulated solvent, flue gas, and reboiler steam. For all cases, natural gas-based combined cycle turbine flue gas, containing 3.5% by volume CO2, was used. It is also notable that the level of CO2 capture varies from 90–98.5%, while the approximate level of CO2 capture required for net-zero emissions for this flue gas source is approximately 99%.
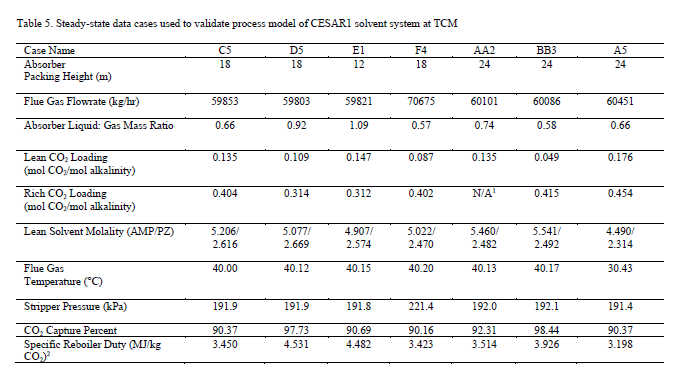
2 Specific reboiler duty (SRD) is the ratio of the reboiler duty to the mass of CO2 captured – which is determined through a mass balance around the absorber
In Table 5, the CO2 loading is defined in terms of total alkalinity:
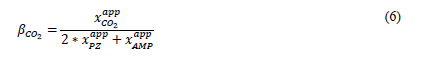
This is done for consistency with the liquid phase composition measurements at TCM. However, the convention used for CO2 loading in the context of thermodynamic model validation (Figures 1 – 2) is:
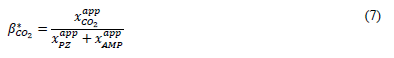
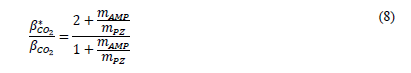
This convention follows that used in the sources for which thermodynamic data were obtained [6; 10 –11]. It can be shown that the two definitions of CO2 loading are related as follows:
The process model of the TCM pilot plant with CESAR1 solvent system developed in this work is evaluated for all data cases. The absorber model performance is evaluated by comparing experimental values and model predictions of CO2 capture percentage and CO2 loading in the rich solvent exiting the absorber. A perturbation factor in the liquid holdup sub-model is included to minimize the error in the absorber model, although this assumption will be analyzed further through uncertainty quantification of the mass transfer, kinetic, and holdup sub-models in future work. Parity plots for the model predictions of the absorber output variables are shown in Figure 5.
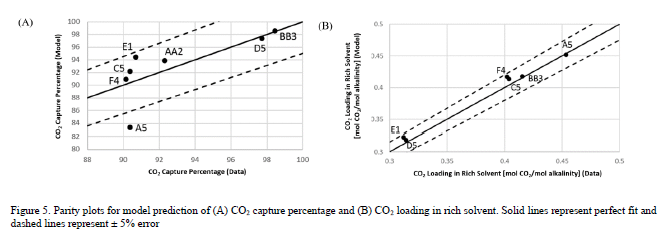
As shown in Figure 5, the model predicts the CO2 capture percentage and CO2 loading in the rich solvent within ±5 for most data cases, although the model seems to underpredict the percentage of CO2 capture for case A5. However, the model accurately predicts the CO2 loading in the rich solvent for this case, which suggests an inaccuracy in the mass balance closure for this case. The stripper model performance is evaluated through the specific reboiler duty, which is the ratio of the reboiler duty and the mass of CO2 captured, and the temperature of the lean solvent exiting the bottom of the column. Parity plots for the model predictions of the stripper output variables are shown in Figure 6. Moreover, Table 6 includes a summary of the percentage error in the model prediction of key process variables for the CESAR1 model.
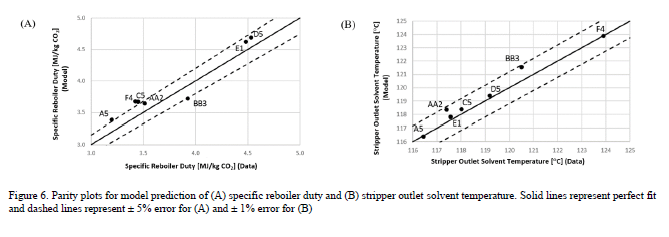
Figure 6. Parity plots for model prediction of (A) specific reboiler duty and (B) stripper outlet solvent temperature. Solid lines represent perfect fit and dashed lines represent ± 5% error for (A) and ± 1% error for (B).

The specific reboiler duty is generally predicted with percentage error of ± 5% for all cases, and the percentage error in the prediction of the stripper outlet temperature is less than 1% for all cases.
4. Conclusions
In summary, a model was developed for the CESAR1 post-combustion carbon capture process at the TCM pilot plant for a flue gas source consistent with natural gas conditions. The model was validated with seven steady-state data sets, representing a variety of operating conditions and CO2 capture levels near the point of net-zero emissions (~ 99% capture for flue gas from natural gas combustion), and found to be predictive of key output variables for both the CO2 absorption and solvent regeneration processes. Ongoing and future work on the CESAR1 model will focus on analysis of the solution thermodynamics and reaction kinetics of the underlying sub-systems of the AMP-PZ-H2O-CO2 system (i.e., CO2-loaded aqueous PZ and AMP systems). While the thermodynamic models were deemed accurate for characterization of the absorber and stripper performance for the concentration of interest for the CESAR1 solvent system (5 m AMP, 2.5 m PZ), further analysis of the sub-systems would be required to ensure accuracy of the model for AMP–PZ blends of varying concentrations. Parametric UQ will be implemented on the key process sub-models, including thermodynamics, reaction kinetics, liquid holdup, and mass transfer/interfacial area to enable stochastic estimation of model performance at pilot scale. This will be essential for quantifying technical process risk associated with scale-up as well as estimating the economic performance prior to the deployment of CESAR1 as a plant-scale CCS system. In a separate effort under the Sustainable OPEration of post-combustion Capture plants (SCOPE) program the CESAR1 modeling framework will be expanded to include the absorber water wash section for quantifying the level of solvent emissions associated with the process. The SCOPE project [17], funded through the Accelerating CCS Technologies (ACT) program, is focused on supporting the development of technology for greenhouse gas emissions control through large scale deployment of effective emissions management tools and demonstration at CO2 capture pilot plants. Accurate prediction of amine emissions requires thermodynamic models that are valid for solutions with much lower amine concentrations than those encountered in the absorber/stripper loop. One of the goals of SCOPE is to fill the current gap in the literature for vapor-liquid equilibria data for solutions of low amine concentration, thus enabling the development of more accurate amine emissions models. Finally, the CESAR1 process model will be released as part of the open-source CCSI Toolset in the near future to accompany the existing baseline aqueous MEA model for use by researchers for such analyses including, but not limited to, multi- scale modeling and validation, techno-economic analysis, and rigorous comparison of solvent-based CO2 capture systems.
References
[1] Miller DC, Syamlal M, Mebane DS, Storlie C, Bhattacharyya D, Sahinidis NV, Agarwal D, Tong C, Zitney SE, Sarkar A, Sun X, Sundaresan S, Ryan E, Engel D, Dale C, 2014. Carbon capture simulation initiative: a case study in multiscale modeling and new challenges. Annu. Rev. Chem. Biomol. Eng. 5: 301-323.
[2] Morgan JC, Chinen AS, Omell B, Bhattacharyya D, Tong C, Miller DC, Buschle B, Lucquiaud M, 2018. Development of a rigorous modeling framework for solvent-based CO2 capture: Part 2: steady-state validation and uncertainty quantification with pilot plant data. Ind. Eng. Chem. Res. 57: 10464-10481.
[3] Morgan JC, Chinen AS, Anderson-Cook C, Tong C, Carroll J, Saha C, Omell B, Bhattacharyya D, Matuszewski M, Bhat KS, Miller DC, 2020. Development of a framework for sequential Bayesian design of experiments: application to a pilot-scale solvent-based CO2 capture process. Appl. Energy. 262: 114533.
[4] Morgan JC, Omell B, Matuszewski M, Miller DC, Shah MI, Benquet C, Knarvik ABN, de Cazenove T, Anderson-Cook CM, Ahmed T, Tong C, Ng B, Bhattacharyya D, 2021. Application of sequential design of experiments (SDoE) to large pilot-scale solvent-based CO2 capture process at Technology Centre Mongstad (TCM). Proceedings of the 15th International Conference on Greenhouse Gas Control Technologies. 15-18 March 2021, Available at SSRN: https://ssrn.com/abstract=3811695
[5] Putta KR, Saldana D, Campbell M, Shah MI, 2022. Development of CO2 capture process cost baseline for 555 MWe NGCC power plant using standard EA solution. Proceedings of the 16th International Conference on Greenhouse Gas Control Technologies. 23 – 27 October 2022, Lyon, France.
[6] Brúder P, Grimsvedt A, Mejdell T, Svendsen HF, 2011. CO2 capture into aqueous solutions of piperazine activated 2-amino-2-methyl-1- propanol. Chem. Eng. Sci. 66: 6193-6198.
[7] Cousins A, Feron P, Hayward J, Jiang K, Zhai R, 2019. Further Assessment of Emerging CO2 Capture Technologies for the Power Sector and their Potential to Reduce Costs: IEAGHG Technical Report. Available at http://documents.ieaghg.org/index.php/s/YKm6B7zikUpPgGA?path=%2F2019%2FTechnical%20Reports
[8] Aspen Plus documentation, 2014. Rate-based model of the CO2 capture process by PZ using Aspen Plus. Aspen Technology Inc, Cambridge MA.
[9] Aspen Plus documentation, 2014. Rate-based model of the CO2 capture process by AMP using Aspen Plus. Aspen Technology Inc, Cambridge MA.
[10] Hartono A, Ahmad R, Svendsen HF, Knuutila HK, 2021. New solubility and heat of absorption data for CO2 in blends of 2-amino-2-methyl- 1-propanol (AMP) and piperazine (PZ) and a new eNRTL model representation. Fluid Phase Equilib. 550: 113235.
[11] Xie Q, Aroonwilas A, Veawab A, 2013. Measurement of heat of CO2 absorption into 2-amino-2-methyl-1-propanol (AMP)/piperazine (PZ) blends using differential reaction calorimeter. Energy Procedia. 37: 826-833.
[12] Chen CC, Evans LB, 1986. A local composition model for the excess Gibbs energy of aqueous electrolyte systems. AIChe J. 32(3): 444-454.
[13] Morgan JC, Chinen AS, Omell B, Bhattacharyya D, Tong C, Miller DC, 2017. Thermodynamic modeling and uncertainty quantification of CO2-loaded aqueous MEA solutions. Chem Eng Sci. 168: 309-324.
[14] Bravo JL, Rocha JA, Fair JR, 1985. Mass transfer in gauze packings. Hydrocarbon Proc. 64(1):91.
[15] Billet R, Schultes M, 1993. Predicting mass transfer in packed columns. Chem Eng Technol. 16, 1-9.
[16] Benquet C, Knarvik A, Gjernes E, Hvidsten OA, Kleppe ER, Akhter S, 2021. First process results and operational experience with CESAR1 solvent at TCM with high capture rates (ALIGN-CCUS project). Proceedings of the 15th International Conference on Greenhouse Gas Control Technologies. 15-18 March 2021, Abu Dhabi, UAE.
[17] Kvamsdal HM, van Os P, Moser P, Korre A, Martin A, Matuszewski MS, Gupta NC, Khakharia P, McNally C, 2022. SCOPE: an ERA-NET ACT project on sustainable operation of post-combustion capture plant. Proceedings of the 16th International Conference on Greenhouse Gas Control Technologies. 23 – 27 October 2022, Lyon, France.
Disclaimer
This project was funded by the Department of Energy, National Energy Technology Laboratory an agency of the United States Government, through a support contract. Neither the United States Government nor any agency thereof, nor any of its employees, makes any warranty, express or implied, or assumes any legal liability or responsibility for the accuracy, completeness, or usefulness of any information, apparatus, product, or process disclosed, or represents that its use would not infringe privately owned rights. Reference herein to any specific commercial product, process, or service by trade name, trademark, manufacturer, or otherwise does not necessarily constitute or imply its endorsement recommendation, or favoring by the United States Government or any agency thereof. The views and opinions of authors expressed herein do not necessarily state or reflect those of the United States Government or any agency thereof.
Acknowledgements
The authors graciously acknowledge funding from the U.S. Department of Energy, Office of Fossil Energy and Carbon Management, through the Carbon Capture Program.
The authors gratefully acknowledge the staff of TCM DA, Gassnova, Equinor, Shell, and TotalEnergies for their contribution and work at the TCM DA facility. The authors also gratefully acknowledge Gassnova, Equinor, Shell, and TotalEnergies as the owners of TCM DA for their financial support and contributions.