
9. Monitoring real time, in- line variations of noble gas concentrations during CO2 capture operations by means of a portable mass spectrometer (2018)
Anja Sundal1*, Ulrich W. Weber1, 2, Matthias S. Brennwald2, Philip Ringrose3, 4, Nina Enaasen Flø4, 5, Kim Johnsen4, 5, Leila Faramarzi4, 5, Per Aagaard1, Rolf Kipfer2
1Department of Geosciences, University of Oslo, Sem Saelands vei 1, 0371Oslo, Norway 2Swiss Federal Institute of Aquatic Science and Technology, Dübendorf, Switzerland 3Norwegian University of Science and Technology, Trondheim, Norway 5Technology Centre Mongstad, Norway *Corresponding author
Abstract

In the ICO2P-project the overall aim is to develop an innovative and cost-effective monitoring scheme for CO2 capture and storage operations, implementing new methods for in situ noble gas measurements. The first step is to establish a basis for fluid source identification by recording temporal variance of noble gas composition in CO2 product. Studies of noble gases related to CCS typically include few, single point samples. In ICO2P, a portable mass spectrometer (i.e. miniRUEDI) is utilized to directly measure real time variability of the noble gas content in CO2 gas streams at operating CCS facilities. The first study was performed at the Technology Centre Mongstad (TCM) in Norway, a large-scale test facility for post-combustion CO2 capture operations. During an open scientific test campaign for amine-based capture (TSA-MEA), noble gases (He, Ar, Kr) as well as CO2 , N2, O2 concentrations in the CO2 product stream were recorded every 10 to 15 minutes during a 5-day period. He concentrations (<0.001ppm)were depleted post-capture and too low for temporal variation measurements in the CO2 product line. Ar concentrations (0.15 – 0.65 ppm) were significantly higher and temporal variation was successfully recorded in the CO2 product line. Ar was found to be sensitive to capture operations, e.g. CO2 recycling ratio. This new approach will provide knowledge of the uniqueness and variability of inherent noble gas fingerprints and depletion/absorption during CCS operations and provide grounds for comparison between fluid origins needed in leakage detection schemes at CO2 storage sites.
1. Introduction
During a recent feasibility study [1], to assess the potential for real-time, semi-continuous noble gas monitoring, data were collected from CO2 capture operations at the Technology Centre Mongstad (TCM) in Norway (Fig. 1), using a novel method for quantitative gas composition measurement. The overall aim has been to contribute towards developing innovative and cost-effective monitoring schemes for CO2 capture and storage operations, work that is now part of an ongoing research project – the ICO2P-2 project [1] during 2018-2021.
By recording temporal variance of noble gas composition in CO2 capture products, the inherent geochemical fingerprint can be evaluated with respect to the potential for source identification at prospective storage sites (i.e. differentiation of sources at CO2 seepage sites or natural variations in marine and terrestrial environments). Studies so far typically include only a few, single point samples, and there is a clear need for more background data on gas compositions and better sampling strategies to ensure safe storage and reliable leakage detection. The miniRuedi [2] portable mass spectrometer has the capacity to measure low concentrations (i.e. partial pressures) of He, Ar and Kr, as well as CO2 , CH4, O2 and other relevant chemical substances with high accuracy at sample intervals of < 15 minutes. This technology proved suitable for monitoring fluctuations in some components of the CO2 -product composition, as tested during an open scientific test campaign for post-combustion capture processes; amine-based temperature swing absorption (TSA), at TCM in summer 2017.
This data set, and further work, will provide important knowledge on absolute variability in CO2 product from complex and mixed sources. During capture operations and before storage of CO2 can commence, there is a need to document variability, and to evaluate the inherent compositional signature (and the potential need for adding tracers). This approach will allow for source-specific identification of fluids; differentiating injected (anthropogenic) CO2 from natural (methanogenic / biogenic) CO2 rich gases at potential leakage points.
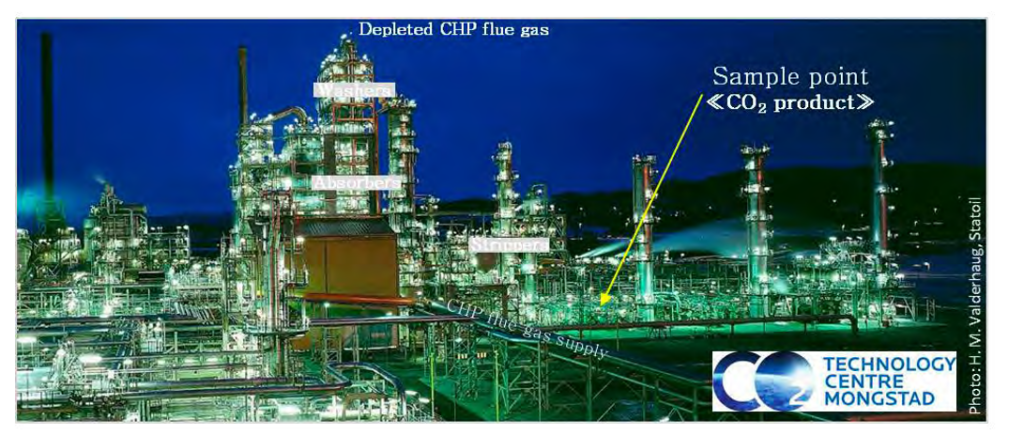
Fig. 1. Technology Centre Mongstad (TCM), Norway [Photo © Equinor] DA amine plant with CHP flue gas inlet from the front, and the high
absorber tower in the middle. “Captured” CO2 product outlet and sample point towards the right.
2. Noble gases as tracers in CCS (and EOR)
Reliable monitoring is a prerequisite for safe, long-term storage and public acceptance of CCS. Terrestrial noble gases (i.e. He, Ne, Ar, Kr, Xe) appear to be suitable natural tracers for monitoring and understanding CO2-rich gas systems [3]. They are chemically inert and non-degradable. And in contrast to several commonly applied chemical tracers (e.g. PerFluoroCarbons), inherent noble gases are not harmful to the environment and bring no additional cost. The concept of using noble gases for monitoring CO2 projects has been demonstrated at small-scale onshore facilities, and noble gas data proved to be crucial evidence to rule out an alleged leakage incident at the Weyburn project [4].
However, there are still knowledge gaps: studies so far typically include only a few, single-point samples, and there is a clear need for better data on gas compositions and variability.
To understand large-scale reservoir dynamics and fluid mixing at CO2 injection sites and along possible leakage paths, experience from research related to multi-phase hydrocarbon systems have to be used and adapted to the scientific case of CCS. Formation water in deep, saline aquifers will have a unique noble gas signature based on a blend of an atmospheric component (stable contents of 20Ne, 36Ar, 84Kr), a deep mantle component (mostly supplying 3He) and a crustal radiogenic component (production of 4He, 21Ne, 40Ar). The signature is a function of time and dependent on the in-situ lithology [5]. Crustal 4He is supplied from radiogenic decay of U and Th in minerals, and 40Ar is produced by radioactive decay of 40K. The mixing ratios of meteoric, mantle and crustal components may yield information about residence times and fluid mixing. E.g., it was found that seepage of methane causes depletion of 20Ne and 36Ar relative to 4He by partitioning, as the heavier noble gas species are more soluble in methane than in water [5]. Exchange between groundwater and oil phase may also be detected as increased 20Ne and 36Ar abundance in oil, as described for the Magnus Field in the British North Sea [6]. Injected CO2 -rich fluid will also interact with formation water and/or hydrocarbon phases present in a storage reservoir. A recent tracer test at the Cranfield enhanced oil recovery (EOR) field in the US, adding Kr and Xe, showed noble gases to be stripped from formation water and into the CO2 phase [7]. Mapping of the background noble gas abundance before injection is of utmost importance to characterize the natural gas composition and spatial distributions prior to CO2 injection. This will improve the understanding of CO2 trapping mechanisms and oil/water/gas partitioning in reservoirs, and form the grounds for comparison needed in leakage detection schemes.
2.1 Compositional variability in captured CO2
Norway is currently at the forefront in developing CCS, along with Canada, Australia, USA and China. With two active storage sites and a national plan to establish another, larger-scale offshore storage site at Smeaheia, there is an imminent need to prepare reliable, cost-effective and long-term monitoring programs. Noble gas finger-printing can provide an applicable solution, but there is a significant knowledge gap concerning the inherent signature of CO2 from various capture processes.
At the operative Sleipner and Snøhvit sites, inherent CO2 from fossil sources (natural gas reservoirs) is captured (as part of the gas processing) and re-injected into a storage formation (saline aquifer). Such single-source storage schemes are expected to display the least degree of temporal variation in the noble gas compositions of injected gas. The noble gas signature of a given natural gas accumulation is related to long-term, slow accumulation rates of e.g. 3He, 4He, 21Ne, 40Ar in a given geological setting. Lateral or vertical compositional gradients in reservoirs related to the lithology and contact time with fluids in traps and along migration paths, may be documented as compositional changes during production. However, these changes are expectedly subtle, compared to complex mixed-source and post-combustion schemes. At the Technology Centre Mongstad (TCM) the source is mixed, and natural gas from several reservoirs are combusted before CO2 -rich flue-gas enters the capture facility. CO2 is captured from a combination of flue gases; (1) from a combined cycle gas turbine (CCGT) based heat and power plant (CHP) or (2) the residual fluid catalytic cracker (RFCC) at the Equinor refinery at Mongstad. At the CHP plant large quantities of gases from different fossil sources are combined, but after initial mixing and combustion, the signature of the flue gases are expected to become relatively homogenous within a few days. Then, with addition of residual refinery gas, the compositional variability is expected to increase. Further, the combustion process will add an atmospheric component.
Depletion of the radiogenic/nucleogenic components of reservoir derived noble gases occurs during combustion and capture [8]. In the product line recirculation rates, addition of different solutes with given solubilities for the gases and their isotopes under varying pressure and temperature conditions will affect noble gas contents. In this study, we attempt to document temporal changes, and the next step is to interpret and decipher the relative effects of capture processes on noble gas fingerprinting. Additionally, documenting variation in the fossil gas feed is highly relevant in evaluating the traceability of mixed-source gas in future storage schemes, involving captured CO2 also from other industries (e.g. cement, ammonia, waste incineration, biogas). E.g. the presented storage scheme for Smeaheia involves storage of CO2 from mixed sources, after post-combustion capture.
3. Methodology
3.1 Capture processes at TCM
The Technology Centre Mongstad (TCM) is a large-scale test facility for CO2 capture operations. This study was conducted in July 2017 during an open scientific test campaign for post-combustion capture processes, using amine-based temperature swing absorption (TSA) [e.g. 9, 10, 11]. Monoethanolamine (MEA) is used as solvent for CO2 . The combined cycle gas turbine and power plant is run with reservoir gas from different fields in the North Sea mixed with a fraction (up to 50 %) of residual gases from the nearby refinery. Flue gas is fed into the TCM plant, cooled, run through the absorber, before CO2 is stripped off by heating the solvent and vented to a safe location in a dedicated vent stack (Fig. 2). During the test period, the capture plant was run with flue gas from the CHP plant, with a CO2 concentration of approximately 4 vol%. In addition, recycling (i.e. return of CO2 product back to feed gas upstream absorber) was performed, increasing the CO2 content to mimic concentrations similar to coal combustion capture (Fig. 2).
3.2 Portable mass spectrometer
The adapted mass spectrometric technology for analyzing extremely low concentrations and the isotopic fractionations of He, Ne, Kr, Xe, Ar in water and gas is available only in few laboratories worldwide, with the research laboratory at Eawag/ETH (Zürich) being one of the pioneers in this field.
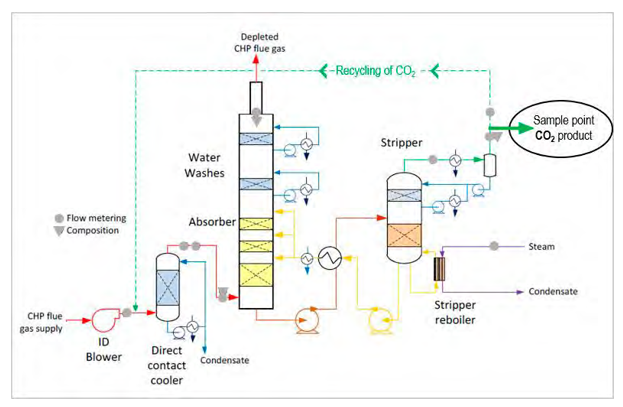
Fig. 2. Post-Combstion CO2 capture at the Technology Centre Mongstad during TSA-MEA test campaigns. A mobile mass spectrometer was connected to the CO2 product line. Modified from Thimsen et a. [9].
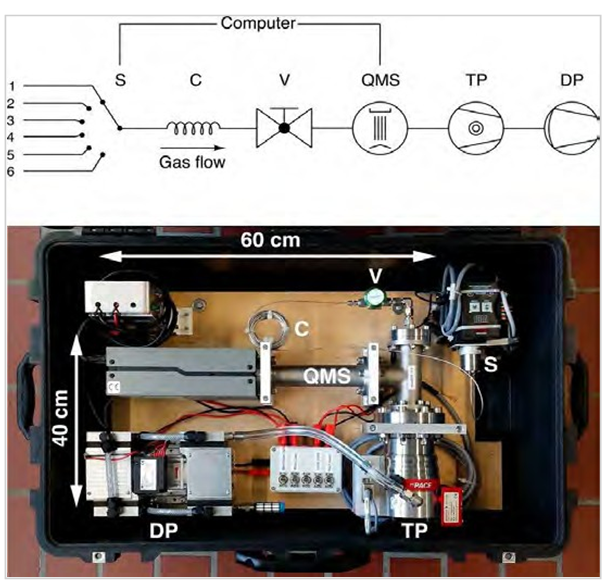
Fig. 3. The miniRuedi portable mass spectrometer (figure from Brennwald et al. [2]) set up with 6-port inlet selector valve (S), capillary (C), inlet valve (V), quadrupole masspectrometer (QMS), turbomolecular pump (TP), and diaphragm pump (DP).
3.3 Sample set-up
A miniRuedi [2] mass spectrometer was connected to the outgoing CO2 product line, downstream the overhead condenser of the CO2 stripper (Fig. 2). This stream is water-saturated, and the slip-stream to the instrument was passed through a dryer to avoid the risk of condensation in the instrument. A pressure regulator was mounted between the sample point and the membrane inlet to decrease the inlet pressure to atmospheric pressure. This inlet pressures were fairly constant and recorded with a pressure sensor. The instrument was mounted in less than 1 hour, and ran continuously during a 5-day test period. The analytical sequence was set to repeating cycles of one air-standard analysis block (calibration), followed by three CO2 output stream sample analysis blocks. An ambient air sample analysis block was added intermittently to remove residual CO2 from the ion source. The analysis blocks lasted between 10 and 15 minutes depending on the number of components measured. During the test He, H2O, Ne, N2, O2, Ar, CO2 and Kr were measured. In this way, a unique, semi-continuous data series of gas content was collected and suitable measurement routines were established. Single samples were gathered for lab analysis of noble gas isotopes.
4. Results
The instrument ran steadily throughout the sampling period. However, as this was a feasibility study, parameters such as air-calibration and sampling intervals as well as the selection of analyzed components were tweaked and tested underway. Absolute concentrations of CO2 , O2 and N2 were compared with measurements performed by TCM (in- line gas-chromatography). Low concentrations of noble gases throughout the measuring campaign confirm depletion during capture. Kr and Ne were excluded after initial sampling tests, as their partial pressures were below the detection limit. He was too low (< 0.001 ppm) throughout for proper quantification with the miniRuedi, as peak variation could not be deciphered from background. This was confirmed in new, preliminary data analysed after the GHGT poster presentation, and thus He plots are excluded from this final summary. Further studies of single samples and continuous measurement of pre-capture variation (source inlet) are ongoing. Ar (150 – 650 ppm) contents were significantly higher compared to He, Kr, Ne, and was measured throughout the 5-day sampling period (Fig. 4). Some significant changes were observed (i.e. sudden increase/decrease).
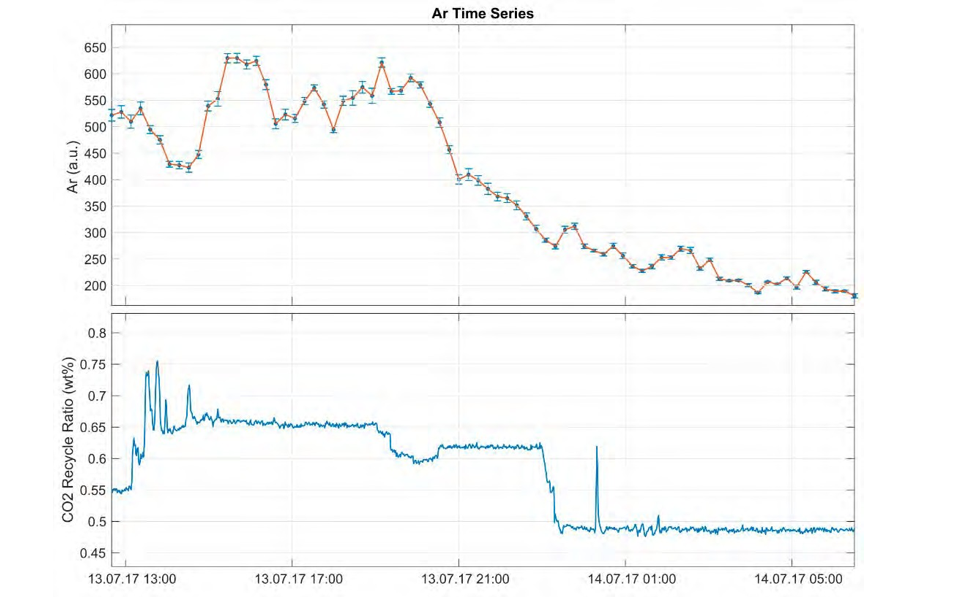
Fig. 4. Measured Ar concentrations (ppm) during the test period 10.07. – 15.07.2017 (upper) displaying co-variance with CO2 recycle ratio (wt %) at the TCM plant (lower).
The analytical error at sampling intervals of 10 – 15 minutes was acceptable, but the standard gas (air) used for calibration was found to be sub-optimal. Ar concentrations appear to be sensitive to changes in the recycle ratio and the capture process (Figs. 4, 5). Preliminary results from single samples confirm that He content is lower in the refinery gas compared to in the natural gas source, and concentrations are expected to vary according to relative contributions from natural gas versus refinery gas (Fig. 6). An observed decline in measured Ar concentrations coincided with reduction of CO2 recycling in the line, a scheduled process change (Fig. 4).
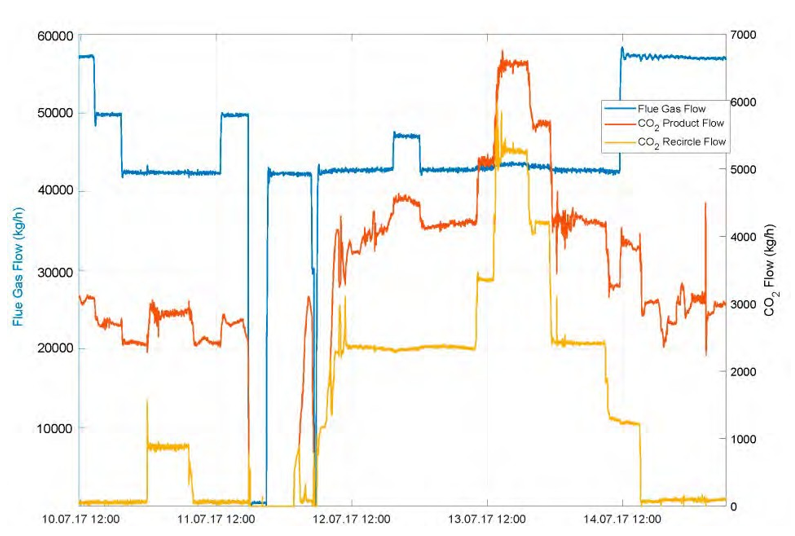
Fig 5. Gas flows (kg/h); flue gas, CO2 product and recycled CO2 .
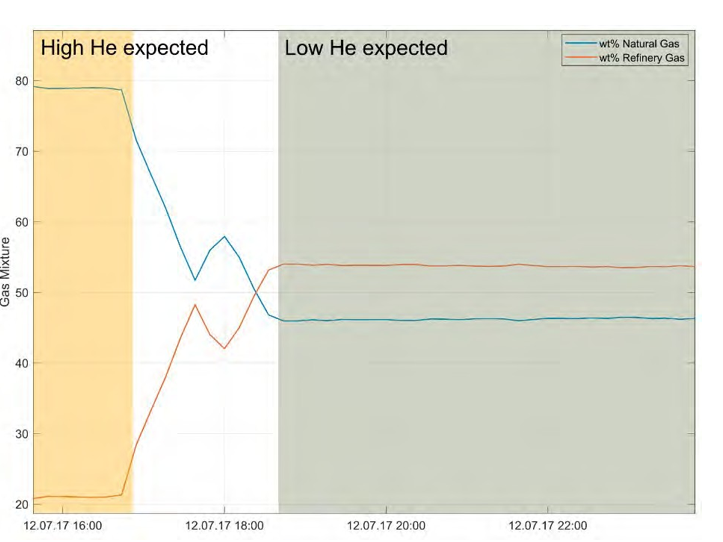
Fig. 6. Change in flue gas composition (wt % refinery gas vs. natural, detail from Fig. 5). Single samples indicate lower He concentrations in RFCC flue gas, such that concentration changes are expected for different mixing ratios.
5. Discussion
The test was successful in that the miniRuedi instrument ran continuously and variation in Ar concentrations were observed and documented. Up to 50 % change in relative concentrations of Ar was observed in the course of 5 days. This shows that there is noble gas variability, and that continuous monitoring is useful to ensure representative sampling in evaluation of inherent fingerprints and traceability. Preliminary single sample results show that concentrations are detectable with our technique before absorption (capture). During gas combustion and in the RFCC process, contamination with air occurs.
Assuming that tests during the capture processing (e.g. recycling) in a regularly working plant are not occurring, variations due to the capture process are expected to be minor. Thus noble gas variation related to source rather than process changes should be measured/detectable at the inlet. This is evaluated in ongoing studies.
The approach of in-line monitoring with a miniRuedi instrument is straightforward. However, optimization is necessary in order to reduce analytical uncertainty. Sample intervals of ~ 10 minutes were found suitable with respect to signal reading time and peak heights, and relative to sample resolution (gradual compositional changes). A customized calibration gas more similar to the CO2-product should be used in future tests for improved accuracy. Absolute variability in Ar concentrations was registered, and may be used to guide sampling for further chemical analysis and noble gas isotopic signature, ensuring a representative data set of single samples.
TCM is a test facility, and thus the CO2 product is not stored. There are, however, plans to establish a full value CCS chain in Norway, including storage of CO2 captured post-combustion [12]. Storage of CO2 from multiple sources (e.g. fossil fuels, cement, waste incineration) and different capture operations are challenging. Semi-continuous noble gas analysis may allow for pre-injection gas fingerprinting. With regards to detectability at potential leakage sites and separation of different anthropogenic type sources in reservoirs, however, some additional tracer gas may have to be added. At single-source sites (e.g. Snøhvit, Utsira), inherent fingerprints may suffice for source identification. For evaluation of source variability and the effect of the capture process on noble gas signatures, both the flue gas supply (inlet) and CO2 product (outlet) should be monitored simultaneously. Multiple capillary inlets to the miniRuedi instrument allows for semi-continous monitoring of several sample points. Total variation estimates are useful to guide sampling for isotopic analysis.
Ar concentrations displayed significant variation. During the Ar decrease shown in Fig. 4 the recycling rate was adjusted. Even though this is a change that may not occur in a running large-scale capture site, the dramatic decrease emphasizes that there is a response in the noble gas assembly related to capture process changes. During the test period measurements indicate that noble gases were heavily depleted after capture. He concentrations are significantly lower than atmospheric concentrations (~ 0.00524 hPa). Alternative sampling techniques, e.g. [13], may be tested in further research for gases currently below detection limit (i.e. He, Ne, Kr). Monitoring in-line variation and correlating with isotopic fractions from previous samples will reduce the need for costly and time-consuming lab analysis.
6. Conclusions
The utilization of noble gases as added and/or natural tracers in the context of CO2 storage monitoring is rather new. As CCS is being upscaled and put into practice, the need for combined and improved monitoring techniques is becoming evident. This feasibility study found that the miniRuedi [2] allows for frequent and accurate measurements of Ar abundance in captured CO2 from a post-combustion like facility (TCM). Preliminary single sample analyses indicate detectability also for continuous measurements of variation in He in the flue gas supply (source) before absorption and depletion during post-combustion capture. At pre-combustion sites, however, contamination with air is expected to be significantly lower, and considering He concentrations (enriched during radiogenic production) measured in North Sea gas fields [6], monitoring temporal variations for He in the CO2 product at pre-combustion capture sites is feasible. Documentation of variability in live gas streams and guided follow-up sampling for isotopic analysis in the lab will provide an important basis for consideration of noble gas fingerprints in monitoring schemes and leakage detection. This is a new approach that will provide knowledge of the uniqueness of noble gas fingerprints in the product stream from hydrocarbon production, CO2 capture operations and in the injection line for CO2 storage.
Acknowledgements
The ICO2P-project is funded by CLIMIT-Demo under grant #616220. The work was also partially funded by the SUCCES FME research center at the Department of Gesociences under grant 193825/S60 from the Research Council of Norway. The authors gratefully acknowledge the staff at TCM DA, Gassnova, Equinor, Shell and Total for their contribution and work at the TCM DA facility. The authors also gratefully acknowledge Gassnova, Equinor, Shell and Total as the owners of TCM DA for their financial support and contribution. We would also like to thank Eawag/ETH for making a miniRuedi instrument available. The project period is scheduled for 2016-2018. A continuation of this project is granted by RCN (#280551), and ICO2P-2 will continue until 2021, including a Ph.D. project. www.mn.uio.no/geo/english/research/projects/ico2p/
References
- CLIMIT-Demo feasibility study “ICO2P” under grant 193825/S60: www.mn.uio.no/geo/english/research/projects/ico2p/
- Brennwald, M. S., Schmidt, M., Oser, J., and Kipfer, R. (2016). A portable and autonomous mass spectrometric system for on-site environmental gas analysis. Env.Science & Technology, 50(24), 13455–13463.
- Gilfillan et al. (2008) The noble gas geochemistry of natural CO2 gas reservoirs from the Colorado Plateau and Rocky Mountain provinces, USA. Geochimica et Cosmologica Acta, 72(4), 1174-1198.
- Gilfillan et al. (2017) Using noble gas fingerprints at the Kerr Farm to assess CO2 leakage allegations linked to the Weyburn-Midale CO2 monitoring and storage project. Int. Jour. of Greenhouse Gas Control, 63, 215-225.
- Lollar, B. S., & Ballentine, C. J. (2009). Insights into deep carbon derived from noble gases. Nature Geosci. 2(8), 543.
- Ballentine, C. J., O’Nions, R. K., & Coleman, M. L. (1996). A Magnus opus: Helium, neon, and argon isotopes in a North Sea oilfield. Geochimica et Cosmochimica Acta, 60(5), 831-849.
- Györe et al. (2015). Tracing injected CO2 in the Cranfield enhanced oil recovery field (MS, USA) using He, Ne and Ar isotopes. Int. Jour. of Greenhouse Gas Control, 42, 554-561.
- Flude, S., Johnson, G., Gilfillan, S. M., & Haszeldine, R. S. (2016). Inherent tracers for CCS in sedimentary formations: composition and applications. Env. Science & Technology, 50(15), 7939-7955.
- de Koeijer, G., Enge, Y., Sanden, K., Graff, O. F., Falk-Pedersen, O., Amundsen, T., & Overå, S. (2011). CO2 Technology Centre Mongstad– Design, functionality and emissions of the amine plant. Energy Procedia, 4, 1207-1213.
- Thimsen et al. (2014). Results from MEA testing at the CO2 Post-Combstion CO2 capture testing. Part I: Post-Combstion CO2 capture testing methodology. Energy Procedia, 63, 5938-5958.
- Flø, N. E., Faramarzi, L., de Cazenove, T., Hvidsten, O. A., Morken, A. K., Hamborg, E. S., … & Fostås, B. F. (2017). Results from MEA degradation and reclaiming processes at the CO2 Technology Centre Mongstad. Energy Procedia, 114, 1307-1324.
- Gassnova (2018) Feasibility study for full scale CCS in Norway: www.gassnova.no/en/Documents/Feasibilitystudy…
- Manning, C. C., Stanley, R. H., & Lott III, D. E. (2016). Continuous measurements of dissolved Ne, Ar, Kr, and Xe ratios with a field- Deployable gas equilibration mass spectrometer. Analytical chemistry, 88(6), 3040-3048.