
5. Application of Sequential Design of Experiments (SDoE) to Large Pilot-Scale Solvent-Based CO2 Capture Process at Technology Centre Mongstad (TCM) (2021)
Joshua C. Morgana,b,*, Benjamin Omella, Michael Matuszewskia, David C. Millera, Muhammad Ismail Shahc, Christophe Benquetc, Anette Beate Nesse Knarvikc, Thomas de Cazenovec, Christine M. Anderson-Cookd, Towfiq Ahmedd, Charles Tonge, Brenda Nge, Debangsu Bhattacharyyaf
aNational Energy Technology Laboratory, 626 Cochrans Mill Road, P.O. Box 10940, Pittsburgh PA 15236-0940, USA b NETL Support Contractor, 626 Cochrans Mill Road, P.O. Box 10940, Pittsburgh PA 15236-0940, USA cCO2 Technology Centre Mongstad, Mongstad 71, 5954 Mongstad, Norway dLos Alamos National Laboratory, P.O. Box 1663, Los Alamos NM 87545, USA eLawrence Livermore National Laboratory, 7000 East Ave, Livermore CA 94550, USA fWest Virginia University, Department of Chemical and Biomedical Engineering, 1306 Evansdale Drive, P.O. Box 6102, Morgantown WV 26506-6102, USA *Corresponding author

Abstract
The United States Department of Energy’s Carbon Capture Simulation for Industry Impact (CCSI2) program has developed a framework for sequential design of experiments (SDoE) that aims to maximize knowledge gained from budget- and schedule- limited pilot scale testing. SDoE was applied to the planning and execution of campaigns for testing CO2 capture systems at pilot- scale in order to optimally allocate resources available for the testing. In this methodology, a stochastic process model is developed by quantifying the parametric uncertainty in submodels of interest; for a solvent-based CO2 capture system, these may include physical properties and equipment performance submodels (e.g., mass transfer, interfacial area). This uncertainty is propagated through the full process model, over variable operating conditions, for estimating the resulting uncertainty in key model outputs (e.g., percentage of CO2 capture, solvent regeneration energy requirement). In developing a data collection plan, the predicted output uncertainty is incorporated into an algorithm that seeks simultaneously to select process operating conditions for which the predicted uncertainty is relatively high and to ensure that the entire space of operation is well represented. This test plan is then used to guide operation of the pilot plant at varying steady-state conditions, with resulting process data incorporated into the existing model using Bayesian inference to refine parameter distributions. The updated stochastic model, with reduced parametric uncertainty from data collected, is then used to guide additional data collection, thus the sequential nature of the experimental design.
The SDoE process was implemented at the pilot test unit (12 MWe in scale) at Norway’s Technology Centre Mongstad (TCM) in a summer 2018 test campaign with aqueous monoethanolamine (MEA). During the test campaign, the varied operating conditions included the flowrates of circulated solvent, flue gas, and reboiler steam and the CO2 concentration in the flue gas. The process data were used to update probability distributions of mass transfer and interfacial area parameters of a stochastic process model developed by the CCSI2 team. Two iterations of the SDoE process were executed, resulting in the uncertainty in model predicted CO2 capture percentage decreasing by an average of 58.0 ± 4.7% over the full input space of interest. This work demonstrates the potential of the SDoE process for model refinement through reduction in process model parametric uncertainty, and ultimately risk in scale-up, in CO2 capture technology performance.
1. Introduction
The United States Department of Energy’s Carbon Capture Simulation for Industry Impact (CCSI2) program is a collaboration of national laboratories, universities, and industrial organizations that provides research and development support for novel CO2 capture technologies with the objective of reducing risk and accelerating their commercialization. These efforts involve continuing advancements in and applications of the open-source toolset1 developed as part of its predecessor project, the Carbon Capture Simulation Initiative (CCSI). The CCSI Toolset includes a suite of computational tools and models with the overarching goal of accelerating the development, deployment, and scale-up of CO2 capture technologies. The toolset includes a rigorous process model, implemented in Aspen Plus®, of the aqueous monoethanolamine (MEA) solvent system, which is the industrial standard for solvent- based CO2 capture. This model includes quantification of parametric uncertainty for solvent physical property models such as viscosity, density, and surface tension [1], the thermodynamic framework [2], and packing-specific models such as mass transfer, interfacial area, and hydraulics [3]. These submodels combine with a full process model that was validated with process data from the 0.5 MWe pilot test unit at the National Carbon Capture Center (NCCC) in 2014 [4]. In 2017, an additional test campaign for the aqueous MEA system was held at NCCC, incorporating the CCSI2 framework for SDoE. In this methodology, the existing process model is leveraged to inform collection of data that are subsequently used to refine the model and modify the test plan accordingly [5,6]. Over two iterations of the SDoE process, parametric distributions for process submodels were refined through experimental observations of absorber CO2 capture percentage, resulting in an average uncertainty reduction of approximately 50% for the model prediction of CO2 capture percentage throughout the input space of interest.
The CCSI aqueous MEA process model was scaled up to 12 MWe for consistency with the pilot test unit at Norway’s Technology Centre Mongstad (TCM) and was used in the planning and execution of a test campaign at TCM in summer 2018. TCM is one of the world’s largest facilities for testing carbon capture technologies, and previous test results with the MEA solvent system have been reported in the open literature [7-12], including variation in many process variables and both steady-state and dynamic operation. The pilot plant at TCM notably has two sources of flue gas: combined cycle gas turbine (CCGT) based heat and power plant (CHP), with ~3.5 vol% CO2, and residual fluidized catalytic cracker (RFCC) unit, with ~13-14 vol% CO2. The TCM plant also contains two stripper columns, each designed for process operation with one of the flue gas sources. This work focused on collecting additional data for the MEA process at TCM with variation in the flowrates of solvent, flue gas, and reboiler steam, the concentration of CO2 in the flue gas, the packing height of the absorber, and the stripper configuration. During the first three weeks of the test campaign, which are the primary focus of this paper, the SDoE framework was used to guide the collection of process data using the existing MEA process model and multiple test objectives. The data were used to update the model by refining the distributions of parameters in the mass transfer and interfacial area submodels, ultimately resulting in a reduction of predicted uncertainty in the CO2 capture percentage from 10.5 ± 1.5% to 4.4 ± 0.4%, or an average reduction of 58.0 ± 4.7%, over the full input space of interest. In the final two weeks of the campaign, data were collected for a modified process configuration in which the packing height of the absorber was reduced to 18 meters, and eventually 12 meters, and the stripper configuration was modified so that a fraction (~20%) of the rich solvent exiting the absorber bypasses the lean-rich heat exchanger and is heated in the water wash of the stripper. This work, along with the previous test campaign at NCCC, demonstrates the potential of the SDoE methodology for refining predictions of stochastic process models through strategic data collection. The reduction of model uncertainty effectively reduces expected risk in process design and operation, thus improving confidence when predicting process performance and conducting economic analyses.
2. Methodology
2.1 SDoE Methodology
The SDoE process developed by CCSI2 uses a stochastic model, with parametric uncertainty quantified in the submodels, to inform collection of process data in order to maximize the value of data obtained during a test campaign. Moreover, it provides a framework for directly reducing uncertainty in model prediction of capture rates based on new process knowledge gained from data collection. The SDoE process is represented schematically in Fig. 1.
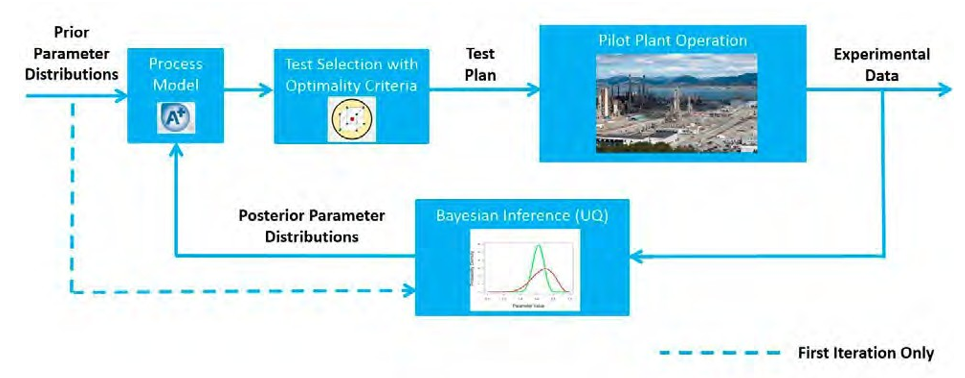
Fig. 1. Schematic representation of SDoE methodology.
As shown in Figure 1, a priori probability distributions of submodel parameters are propagated through a process model, denoted as 𝑦(𝒙, 𝜽, 𝜽∗), where 𝒙 is a set of input variables that can be manipulated in plant operation and 𝜽 and 𝜽∗ are sets of model parameters. These sets differ in that 𝜽 contains parameters for which uncertainty is reduced over the course of executing the SDoE methodology whereas 𝜽∗ has parameters with irreducible uncertainty based on the type of data collected. For the example of a solvent-based CO2 capture system, 𝜽 includes process specific parameters from submodels such as mass transfer or interfacial area that may be informed through collection of plant data (e.g. CO2 capture percentage in the absorber column). Conversely, 𝜽∗ includes parameters from physical property submodels, for which uncertainty is readily estimated through direct measurements of the corresponding properties and cannot reasonably be informed from plant level data. If the process model y is sufficiently complex, it may be necessary to replace it with a surrogate model, denoted as 𝑦̂(𝒙, 𝜽, 𝜽∗), developed and validated over the full input space. For a given point in the input space, a confidence interval for the model prediction are computed by propagating the uncertainty in the full set of parameters (𝜽𝑻 = [𝜽 𝜽∗]) through the surrogate model. The 95% confidence interval, estimated by taking a sample of size M over the full parameter space (𝜽𝑻,(𝒋), ∀ 𝑗 = 1, … 𝑀), is given as:

where {𝑦̂(𝒙(𝒊), 𝜽𝑻,(𝟏)), . . . , 𝑦̂(𝒙(𝒊), 𝜽𝑻,(𝑴))} is the set of values of an output variable calculated from propagating all of the individual 𝜽𝑻,𝒋) through the surrogate model and 𝐹𝑘 represents the kth percentile of this set.
The values of 𝐶I|𝒙(𝒊) for individual 𝒙(𝒊) are considered in the test selection method; the specific optimality criterion used in this work is G-optimality [13], which minimizes the maximum prediction variance. This aim targets experimental settings 𝒙(𝒊) for which the predicted uncertainty (i.e.,𝐶|𝒙(𝒊)) is relatively large, so that the collection of data at these settings represents high potential for uncertainty reduction. Moreover, the algorithm used in this work for test selection simultaneously seeks to ensure that the full input space is well-represented in the test plan, balancing good representation of design points throughout the region while making locations with large confidence interval widths more likely to be selected.
The test plan is then implemented by running the plant accordingly, resulting in collection of experimental data (denoted Z). The data are incorporated into a Bayesian inference framework, using the PSUADE2 software package. For model parameters of fixed uncertainty, a sample (𝜽∗,(𝒋); ∀ 𝑗 = 1, … , 𝑁) is drawn from their probability distribution 𝑃(𝜽∗). For each sample point 𝜽∗,(𝒋), a posterior distribution for the remaining parameters (𝜽) is calculated:
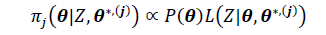
(2) and given in the form of a set of sample points. Here, 𝐿(𝑍|𝜽, 𝜽∗,(𝒋)) represents the likelihood (some metric used to express the distance between simulation predictions and experimental data) of observing a set of experimental data
(Z) conditioned on the values of the parameters, 𝑃(𝜽) the prior distribution of the parameters for which uncertainty is updated, and 𝜋𝑗(𝜽|𝑍,𝜽∗,(𝒋)) the posterior distribution of 𝜽 conditioned on the observed experimental data and the value of 𝜽∗ for sample j. The overall posterior distribution 𝜋(𝜽|𝑍, 𝜽∗,(𝒋)) is obtained through the process of marginalization, combining all individual 𝜋𝑗(𝜽|𝑍, 𝜽∗,(𝒋)). The updated stochastic model, with refined estimates of parameter uncertainties, is then used to re-calculate 𝐶𝐶𝐶𝐶|𝒙𝒙(𝒊𝒊) throughout the input space. For all subsequent iterations of SDoE, the prior distribution 𝑃𝑃(𝜽𝜽) is replaced by the posterior distribution 𝜋𝑗(𝜽|𝑍, 𝜽∗,(𝒋)) from the previous iteration.
2.2 Overview of TCM Test Campaign
The TCM test campaign ran for five weeks in summer 2018, in five distinct test phases as outlined in Table 1.
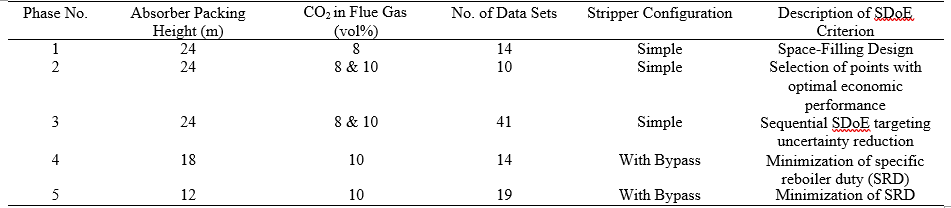
In the first three phases of the campaign, the absorber column was operated with all three packing beds (total height of 24 meters). A conventional stripper configuration was used in which the full amount of rich solvent exiting the absorber is heated in the lean-rich heat exchanger and sent to the top of the stripper column. Throughout the test campaign, flue gas from the CCGT plant (3.5 vol% CO2) was combined with recycle of the captured CO2, increasing the flue gas concentration to 8 or 10 vol% CO2 as required by the test plan. Due to the increased CO2 concentration in the flue gas, and the corresponding increase in the required solvent circulation rate for capturing CO2, the larger stripper intended for use with RFCC flue gas was used during this campaign in lieu of the smaller stripper intended for CCGT flue gas. In Phases 4-5, the packing height of the absorber was reduced by changing the number of beds and the stripper configuration was modified so that approximately 20% of the rich solvent exiting the absorber column bypassed the lean-rich heat exchanger and was instead heated with hot vapor leaving the top of the stripper. This portion of the test campaign, also guided with use of the process model, was focused on identifying the optimal solvent circulation for minimizing the specific reboiler duty for the process. Other process variables were fixed for this portion of the test campaign, including a flue gas flowrate of 50,000 sm3/hr with 10 vol% CO2 and 85% CO2 capture. For the purpose of brevity, the details of Phases 4-5 are not included in this paper.
The first three phases differed in the choice of criteria used for developing the test plan. Phase 1 used a space-filling design to ensure that the process model predicts key outputs such as CO2 capture and specific reboiler duty with reasonable accuracy. Phase 2 focused on collecting data in regions where the model predicts optimal economic performance. Phase 3 focused on collecting data to target regions where the model predicts high uncertainty based on the SDoE procedure in Section 2.1. For all three phases, a desired region of process operation was established based on ranges of operation for flue gas flowrate (𝐺𝐺), CO2 capture percentage (𝐶𝐶𝐶𝐶𝐶𝐶), CO2 loading in the lean solvent entering the absorber column (𝛼𝛼𝑙𝑙𝑙𝑙𝑙𝑙𝑙𝑙), and the volume fraction of CO2 in the flue gas (𝑦𝑦𝐶𝐶𝐶𝐶2 ), with ranges:
𝐺𝐺 ∈ [36,000 − 75,000] 𝑘𝑘𝑘𝑘/ℎ𝑟𝑟 (3a)
𝐶𝐶𝐶𝐶𝐶𝐶 ∈ [80 − 95] % (3b)
𝛼𝛼𝑙𝑙𝑙𝑙𝑙𝑙𝑙𝑙 ∈ [0.10 − 0.25] 𝑚𝑚𝑚𝑚𝑚𝑚 𝐶𝐶𝐶𝐶2/𝑚𝑚𝑚𝑚𝑚𝑚 𝑀𝑀𝑀𝑀𝐶𝐶 (3c)
𝑦𝑦𝐶𝐶𝐶𝐶2 ∈ {0.08,0.10} (3d)
The first three variables are treated as continuous whereas the CO2 fraction in the flue gas is treated as a categorical variable with two process operation levels. For each value of CO2 fraction, a test set consisting of candidate experiments with a unique combination of variables {𝐺𝐺, 𝐶𝐶𝐶𝐶𝐶𝐶, 𝛼𝛼𝑙𝑙𝑙𝑙𝑙𝑙𝑙𝑙} is generated by sampling independently from uniform distributions for each variable with upper and lower limits based on the ranges given in Eq. 3. An Aspen Plus simulation is run for each point in the candidate set to estimate the corresponding values of lean (𝐿𝐿𝑙𝑙𝑙𝑙𝑙𝑙𝑙𝑙) and rich (𝐿𝐿𝑟𝑟𝑟𝑟𝑟𝑟ℎ) solvent flowrate, steam flowrate (𝑆𝑆) and mass of CO2 captured (𝑚𝑚̇ 𝐶𝐶𝐶𝐶𝐶𝐶). To be included in the final candidate set, a point must satisfy the following conditions based on operational limits for the TCM plant:
𝑚𝑚̇ 𝐶𝐶𝐶𝐶𝐶𝐶 < 8,000 𝑘𝑘𝑘𝑘/ℎ𝑟𝑟 (4a)
𝑆𝑆 < 14,000 𝑘𝑘𝑘𝑘/ℎ𝑟𝑟 (4b)
Separate candidate sets (for 𝑦𝑦𝐶𝐶𝐶𝐶2 = 0.08 and 𝑦𝑦𝐶𝐶𝐶𝐶2 = 0.10) were developed using a space-filling approach based on the input vector 𝒙𝒙 = [𝐺𝐺 𝑆𝑆 𝛼𝛼𝑙𝑙𝑙𝑙𝑙𝑙𝑙𝑙]. These candidate sets were used in Phases 1 and 3, although Phase 1 used a space- filling design on the model input space while Phase 3 incorporated the predicted uncertainty in the model output, using the methodology described in Section 2.1. Moreover, only the candidate set for 8 vol% CO2 in flue gas was implemented during Phase 1 of the test campaign due to time considerations.
Phase 2, however, was designed based on an optimization problem of the form:
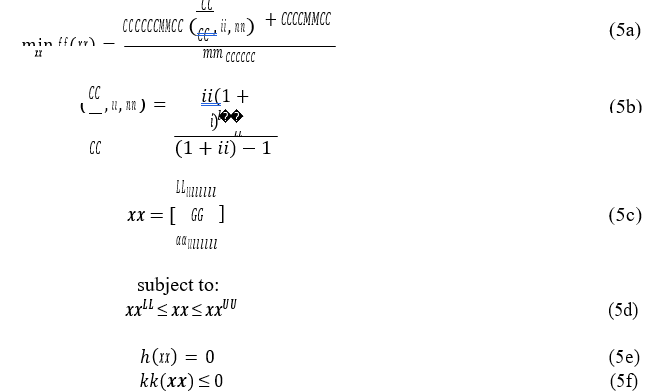
The objective function is the ratio of the equivalent annual operating cost (EAOC) associated with the CO2 capture to the mass of CO2 captured. The EAOC is the sum of the capital cost (CAPEX) multiplied by an annuity factor (𝐶𝐶 , 𝑖𝑖, 𝑛𝑛) and the operating cost (OPEX). Within the annuity factor, 𝐶𝐶 is the ratio of annuity to present value, i is the interest rate, and n is the number of years. The vector of decision variables is denoted as 𝒙𝒙 with lower and upper bounds 𝒙𝒙𝑳𝑳 and 𝒙𝒙𝑼𝑼. The equality constraints denoted by ℎ(𝒙𝒙) includes heat and material balances, and the inequality constraints denoted by 𝑔𝑔(𝒙𝒙) includes the constraints for process operation listed in Eq. 4. The optimization was performed separately for the cases with 8 and 10 vol% CO2 in flue gas. In addition the optimal points in the test plan, additional test points near the optimal points were included. The space surrounding the optimal point can be represented by a cube created by perturbing the input variable values by a chosen amount (10% for this study) from their estimated optimal values. A design that permutes each factor away from this estimated optimum one at a time would require seven test points, or six for the center of each face of the cube (if each factor is manipulated one at a time) and one for the center (optimal) point. As shown in Fig. 2., the design size was reduced to five by considering a fractional factorial structure, which also allows exploration of potential interactions between input factors around the optimum [14].
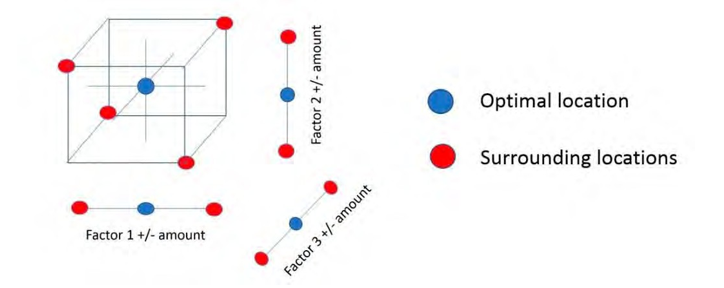
Since two levels of 𝑦𝑦𝐶𝐶𝐶𝐶2 were included in the analysis, the reduction of the overall number of points required for the Phase 2 test plan from 14 to 10 was highly beneficial due to the limited amount of time available for the test campaign.
3. Results
3.1 Phase 1
In Phase 1, the test plan was developed using a minimax space-filling methodology [15] to provide an initial data set that was well-representative of the process. For all testing in this phase, the CO2 concentration in the flue gas was fixed at 8 vol%. The set of input variables included in the test matrix differs from that used for space-filling design in that the input variables for the space-filling design were chosen for modeling convenience whereas the input variables in the test matrix were those directly manipulated in the plant operation. In developing the test matrix, the Aspen simulation was used to estimate the rich solvent flowrate and the flue gas flowrate was converted from mass to volumetric units. The test matrix, which was organized in terms of increasing flue gas flowrate for ease of process operation, for Phase 1 is given in Table 2.
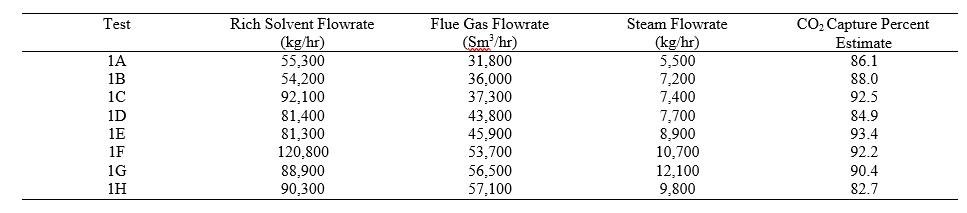
Table 2. Test matrix for Phase 1 design of MEA test campaign at TCM.
When obtaining data for test cases 1A-1B, it was noted that the CO2 capture percentage was substantially lower than the model predictions. This discrepancy was attributed to solvent maldistribution, or uneven flow through the packing, in the RFCC stripper column, resulting in inefficient performance of the column. This stripper was designed to operate at a solvent flowrate of approximately 200,000 kg/hr, or almost four times higher than the solvent flowrate in cases 1A-1B. Therefore, the lean solvent loading for these test runs was substantially higher than that predicted by the model, and the CO2 capture percentage lower. This issue was addressed by dividing each subsequent test run into two intervals with distinct operating goals, so that two data sets were collected for test runs 1C-1H. First, the test was executed with the value of steam flowrate specified in the original test matrix. Upon achieving the steady-state, the steam flowrate was manipulated to match the estimated value of CO2 capture. Parity plots for the model prediction of CO2 capture percentage in the absorber and steam requirement in the stripper are given in Figure 3.
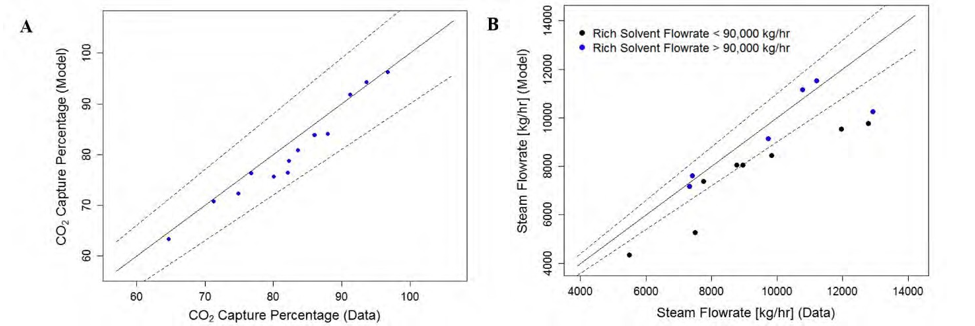
Figure 3. Parity plots for (A) CO2 capture percentage and (B) steam flowrate required for test runs performed in Phase 1. Dashed lines represent
±10% error.
The original deterministic model, or the model in which all parameters are fixed as point values, predicts the CO2 capture with a range of ±10% error for all test runs. The average error for CO2 capture percentage is -2.51 ± 2.29%, with the negative error indicating that the model generally underpredicts the data. The model predicts stripper steam requirement with an average error of -10.83 ± 10.82%, although the error is notably higher for cases in which the solvent flowrate is below 90,000 kg/hr (average error of -16.43 ± 8.49%) than when it is higher than 90,000 kg/hr (average error of -3.67 ± 9.29%). This discrepancy is likely due to liquid maldistribution in the stripper column, as discussed previously. The results obtained in the first phase of the test campaign demonstrated that the initial process model was sufficiently accurate to proceed with the sequential experimental design in subsequent stages.
3.3 Phases 2-3
During the test campaign, data for Phases 2-3 were collected simultaneously and used to update the model parameter distributions through Bayesian inference. The majority of the data for Phase 2 were actually collected after those for Phase 3 due to scheduling convenience. The optimization problem described in Eq. 5 was implemented separately for the 8 and 10 vol% CO2 cases, and used to develop the test matrix given in Table 3.
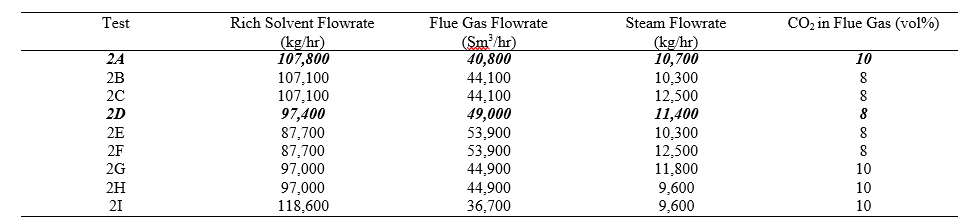
Table 3. Test matrix for Phase 2 design of MEA test campaign at TCM.
In Table 3, the optimal points determined from solving separate optimization problems (Eq. 5) for the 𝑦𝑦𝐶𝐶𝐶𝐶2 = 0.08
(2A) and 𝑦𝑦𝐶𝐶𝐶𝐶2 = 0.10 (2D) cases are highlighted, and additional test points were selected by perturbing the variables by ± 10% from the optimal values. Parity plots for the model prediction of CO2 capture percentage in the absorber and steam requirement in the stripper are given in Fig. 4.
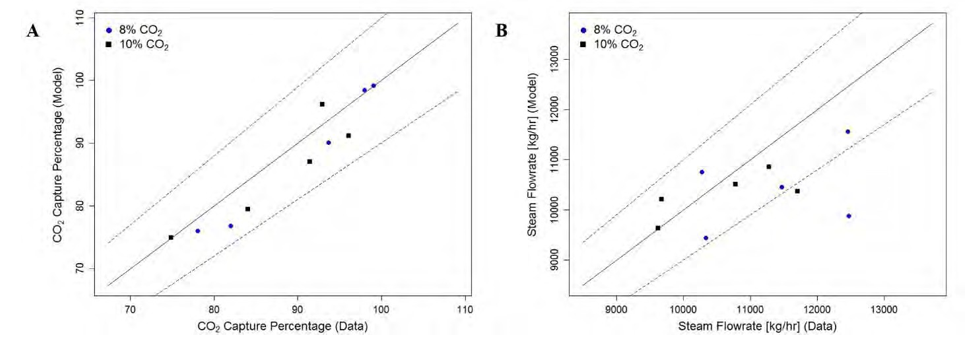
Fig. 4. Parity plots for (A) CO2 capture percentage and (B) steam flowrate required for test runs performed in Phase 2. Dashed lines represent
±10% error.
As shown in Figure 4, the accuracy of the model for the data collected in Phase 2 is comparable to that in Phase 1. The average percent error for the CO2 capture prediction and steam requirement prediction is -2.40 ± 3.27% and -5.28
± 8.00%, respectively. The percentage error for the steam requirement prediction is substantially lower for the data collected in Phase 2 than in Phase 1 due to the absence of test runs with very low (< 85,000 kg/hr) solvent flowrate. Therefore, the model was shown to be sufficiently accurate for the region of the input space likely to be economically optimal.
Phase 3 of the test campaign was focused on data collection in regions where the stochastic model predicts relatively high uncertainty for the absorber CO2 capture percentage. These data, along with those collected in Phase 2, were used to update the mass transfer and interfacial area model parameter distributions. The test matrix for Phase 3 is shown in Table 4.
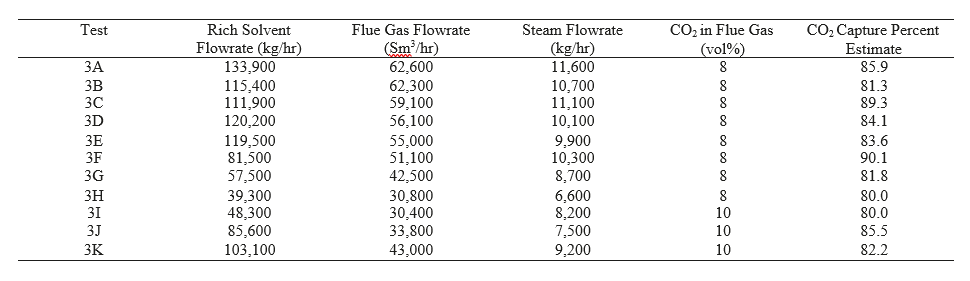
Table 4. Test matrix for Phase 3 design of MEA test campaign at TCM (First Iteration).
The data collected in Table 4, along with case 2A from Table 3 were used in the Bayesian inference procedure based on Eq. 2. In this work, the parameters contained in 𝜽𝜽 included the leading coefficients for the interfacial area and mass transfer submodels developed in previous work [3], and the parameters contained in 𝜽𝜽∗ included the thermodynamic model parameters for which distributions were estimated in previous work [2]. Upon obtaining the updated parameter distributions, the refined stochastic model was used to develop a new test matrix, shown in Table 5.
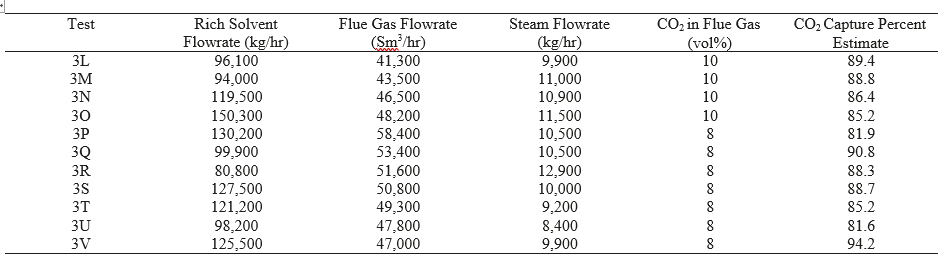
Table 5. Test matrix for Phase 3 design of MEA test campaign at TCM (Second Iteration)
The data collected from the test plan given in Table 5, along with cases 2B-2I in Table 3, were used in a second iteration of the SDoE procedure to update the parameter distributions again. Parity plots for the model prediction of CO2 capture percentage in the absorber and steam requirement in the stripper for all data collected in both iterations of Phase 3 are given in Figure 5.
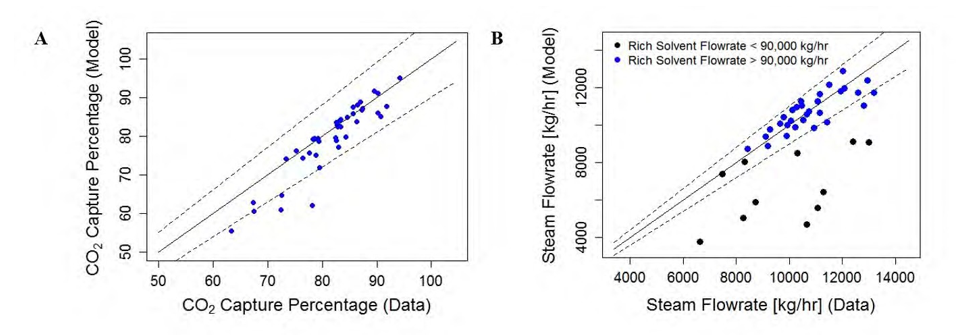
Figure 5. Parity plots for (A) CO2 capture percentage and (B) steam flowrate required for test runs performed in Phase 3. Dashed lines represent ±10% error.
The average percentage error values for the model predictions of the data collected in Phase 3 are -2.91 ± 5.27% for CO2 capture percentage and -8.53 ± 17.20% for the steam flowrate. As with the data collected in Phase 1, there is greater discrepancy in the stripper model for cases in which solvent flowrate is low; the average percentage error in the steam requirement is -31.05 ± 17.81% for cases in which the solvent flowrate is below 90,000 kg/hr and -0.27 ± 6.04% when it exceeds 90,000 kg/hr. As previously suggested, the underprediction in steam flowrate is likely due to operation inefficiency of the RFCC stripper caused by solvent maldistribution, as the process is operated at much lower solvent flowrate than the stripper design condition.
The probability density functions of the mass transfer and interfacial area parameters, including the prior and posterior distributions obtained after each SDoE iteration, are given in Fig. 6.
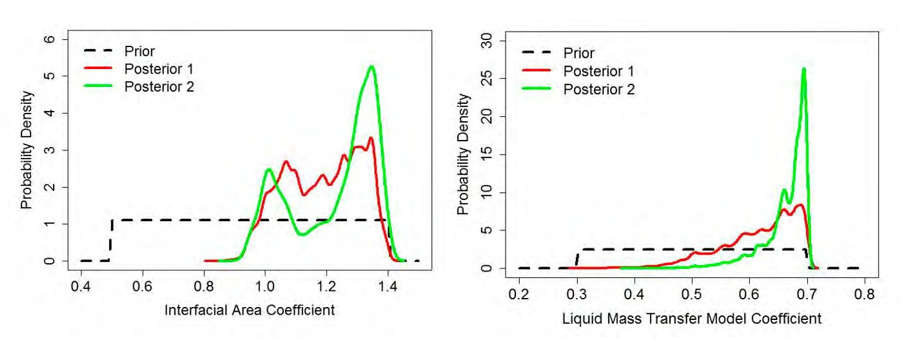
Uniform prior distributions were initially chosen for the two parameters. The parameter space of plausible values was significantly reduced after incorporating the experimental data from the first iteration of SDoE into the stochastic model through Bayesian inference, with less reduction in the second round of SDoE. The effect of SDoE on model uncertainty reduction is more apparent when considering the model output, namely the CO2 capture percent in the absorber. The effect of the first iteration of SDoE on reducing model prediction of uncertainty in CO2 capture percentage is shown in Fig. 7.
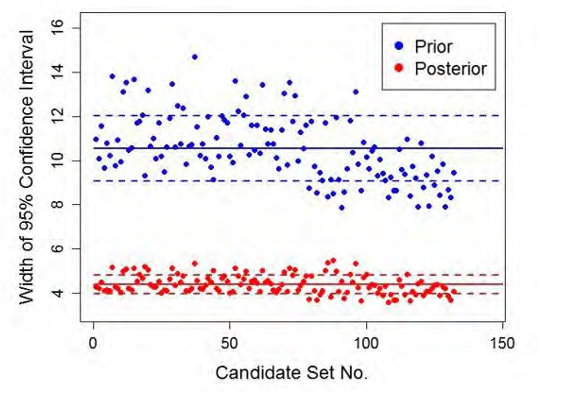
Figure 7. Effect of first round of Bayesian inference on CO2 capture prediction confidence interval for individual points in candidate set.
For the stochastic model prediction using the uniform prior distributions, the average confidence interval width for the CO2 capture percentage was approximately 10.5% (denoted in Figure 7 by solid line) with standard deviation 1.5% (denoted by dashed lines). For the stochastic model prediction with the posterior distribution obtained after the first iteration of SDoE, the average confidence interval width was approximately 4.4% with standard deviation 0.4%. No further significant reduction in the predicted uncertainty in CO2 capture percentage was demonstrated in the second round of SDoE. In Figure 7, the candidate set number refers to an index representing a unique combination of input variables (liquid and gas flowrates, CO2 loading, and CO2 fraction in flue gas). The percentage of reduction in uncertainty for a given point (𝒙𝒙(𝒊𝒊)) in the candidate set is calculated as:
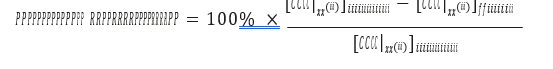
where [𝐶𝐶𝐶𝐶|𝒙𝒙(𝒊𝒊) ]𝑖𝑖𝑖𝑖𝑖𝑖𝑡𝑡𝑖𝑖𝑡𝑡𝑡𝑡 and [𝐶𝐶𝐶𝐶|𝒙𝒙(𝒊𝒊) ]𝑓𝑓𝑖𝑖𝑖𝑖𝑡𝑡𝑡𝑡 represent the 95% confidence intervals in the model prediction of CO2 capture percentage before and after updating the parameter distributions through Bayesian inference, respectively. For the entire candidate set, the average percent reduction in the uncertainty is 58.0 ± 4.7%, which is comparable to the reduction in the previous SDoE-based test campaign executed at NCCC [5,6]. As the ability of the SDoE methodology to reduce parametric uncertainty in a process model for an aqueous MEA system has been demonstrated in multiple campaigns, it may be considered a promising technique for designing future test campaigns to effectively increase fundamental understanding of novel CO2 capture systems.
4. Conclusions and Future Work
In summary, a sequential design of experiments methodology was implemented for executing a test campaign for aqueous MEA at TCM, guiding collection of process data to refine the parameter distributions in the stochastic process model. This resulted in an average reduction of around 58% in the uncertainty in the prediction of CO2 capture percentage. The deterministic model, or the model without parameter uncertainty, also predicted the plant performance accurately, with an average error in percentage of CO2 capture of -2.74 ± 4.47% for the first three phases and an average error of -8.52 ± 14.85% for the reboiler steam requirement. An exception to the accurate performance of the model is for data collected under impractical operating conditions (low solvent circulation rate, in which solvent maldistribution in the stripper column was noted). For data collected when the system was operated with rich solvent flowrate below 90,000 kg/hr, the percent error in the reboiler steam prediction was -23.92 ± 15.70%. However, the percentage error in the steam prediction is -1.17 ± 6.65% for data collected when the rich solvent flowrate was above 90,000 kg/hr. The insights gained during the execution of SDoE guided the development of a new SDoE module with capability for straightforward implementation of the aims used in this experiment [16] that has been implemented in the Framework for Optimization, Quantification of Uncertainty, and Surrogates (FOQUS). This is available as part of the aforementioned CCSI Toolset and will enable the SDoE process to be implemented in a more streamlined manner in future applications. In planned future work, the CCSI2 team will apply the SDoE methodology to novel CO2 capture technologies with the primary goal of refining initial process models by reducing their uncertainty, and thus the inherent risk associated with preliminary models of new processes, through guided data collection.
Disclaimer
This project was funded by the United States Department of Energy, National Energy Technology Laboratory, in part, through a site support contract. Neither the United States Government nor any agency thereof, nor any of their employees, nor the support contractor, nor any of their employees, makes any warranty, express or implied, or assumes any legal liability or responsibility for the accuracy, completeness, or usefulness of any information, apparatus, product, or process disclosed, or represents that its use would not infringe privately owned rights.
Reference herein to any specific commercial product, process, or service by trade name, trademark, manufacturer, or otherwise does not necessarily constitute or imply its endorsement, recommendation, or favoring by the United States Government or any agency thereof. The views and opinions of authors expressed herein do not necessarily state or reflect those of the United States Government or any agency thereof.
Acknowledgement
The authors gratefully acknowledge the staff of TCM DA, Gassnova, Equinor, Shell and Total for their contribution and work at the TCM DA facility. The authors also gratefully acknowledge Gassnova, Equinor, Shell, and Total as the owners of TCM DA for their financial support and contributions.
References
- Morgan JC, Bhattacharyya D, Tong C, Miller DC. Uncertainty quantification of property models: methodology and its application to CO2 loaded aqueous MEA solutions. AIChE J 2015;61(6):1822-39.
- Morgan JC, Chinen AS, Omell B, Bhattacharyya D, Tong C, Miller DC. Thermodynamic modeling and uncertainty quantification of CO2 loaded aqueous MEA solutions. Chem Eng Sci 2017;168:309-24.
- Chinen AS, Morgan JC, Omell B, Bhattacharyya D, Tong C, Miller DC. Development of a rigorous modeling framework for solvent-based CO2 capture. Part 1: hydraulic and mass transfer models and their uncertainty quantification. Ind Eng Chem Res 2018;57:10448-63.
- Morgan JC, Chinen AS, Omell B, Bhattacharyya D, Tong C, Miller DC. Development of a rigorous modeling framework for solvent-based CO2 capture. Part 2: steady-state validation and uncertainty quantification with pilot plant data. Ind Eng Chem Res 2018;57:10464-81.
- Soepyan B, Anderson-Cook CM, Morgan JC, Tong CH, Bhattacharyya D, Omell BP, Matuszewski MS, Bhat KS, Zamarripa MA, Eslick JC, Kress JD, Gattiker JR, Russell CS, Ng B, Ou JC, Miller DC. Sequential design of experiments to maximize learning from carbon capture pilot plant testing. Comput Aided Chem Eng 2018;44:283-8.
- Morgan JC, Chinen AS, Anderson-Cook C, Tong C, Carroll J, Saha C, Omell B, Bhattacharyya D, Matuszewski M, Bhat KS, Miller DC. Development of a framework for sequential Bayesian design of experiments: application to a pilot-scale solvent-based CO2 capture process. App Energy 2020;262:114533.
- Brigman N, Shah MI, Falk-Pedersen O, Cents T, Smith V, De Cazenove T, Morken AK, Hvidsten OA, Chhaganlal M, Feste JK, Lombardo G, Bade OM, Knudsen J, Subramoney SC, Fostås BF, de Koeijer G, Hamborg ES. Results of amine plant operations from 30 wt% to 40 wt% aqueous MEA testing at the CO2 Technology Centre Mongstad. Energy Procedia 2014;63:6012-22.
- Gjernes E, Pedersen S, Cents T, Watson G, Fostås BF, Shah MI, Lombardo G, Desvignes C, Flø NE, Morken AK, De Cazenove T, Faramarzi L, Hamborg ES. Results from 30 wt% MEA performance testing at the CO2 Technology Centre Mongstad. Energy Procedia 2017;114:1146- 57.
- Faramarzi L, Thimsen D, Hume S, Maxon A, Watson G, Pedersen S, Gjernes E, Fostås BF, Lombardo G, Cents T, Morken AK, Shah MI, De Cazenove T, Hamborg ES. Results from MEA testing at the CO2 Technology Centre Mongstad: verification of baseline results in 2015. Energy Procedia 2017;114:1128-45.
- Hamborg ES, Smith V, Cents T, Brigman N, Falk-Pedersen O, De Cazenove T, Chhaganlal M, Feste JK, Ullestad Ø, Ulvatn H, Gorset O, Askestad I, Gram LK, Fostås BF, Shah MI, Maxson A, Thimsen D. Results from MEA testing at CO2 Technology Centre Mongstad. Part II: Verification of baseline results. Energy Procedia 2014;63:5994-6011.
- Montañés RM, Flø NE, Nord LO. Dynamic process model validation and control of the amine plant at CO2 Technology Centre Mongstad. Energies 2017;10:1527.
- Bui M, Flø NE, De Cazenove T, Mac Dowell N. Demonstrating flexible operation of the Technology Centre Mongstad (TCM) CO2 capture plant. Int J Greenh Gas Con 2020;262:114533.
- Myers RH, Montgomery DC, Anderson-Cook CM. Practical design optimality. In: Response surface methodology: process and product optimization using design experiments. 4th ed. New York: Wiley Plus; 2016. p. 467-74.
- Myers RH, Montgomery DC, Anderson-Cook CM. The one-half fraction of the 2k design. In: Response surface methodology: process and product optimization using designed experiments. 4th ed. New York: Wiley Plus; 2016. p. 162-174.
- Johnson ME, Moore LM, Ylvisaker D. Minimax and maximin distance designs. J Stat Plan Infer 1990;26:131-48.
- Lu L, Anderson-Cook CM, Ahmed T. Non-uniform space-filling designs. J Qual Tech 2021; to appear.