
6. Cost Reduction Study for MEA based CCGT Post-Combustion CO2 Capture at Technology Center Mongstad (2021)
Muhammad Ismail Shaha, Eirik Falck da Silvab,*, Erik Gjernesc and Knut Ingvar Åsend
aTechnology Centre Mongstad, 5954 Mongstad, Norway bStavanger Research Center, TOTAL EP Norge AS, 4029 Stavanger, Norway cGassnova SF, Dokkvegen 10, 3920 Porsgrunn, Norway dEquinor ASA, PO Box 8500, 4035 Stavanger, Norway *Corresponding author

Abstract

A campaign was carried out by Technology Center Mongstad (TCM) and its owners in the amine capture plant to study various cost saving operating options relevant for combined cycle gas turbine plants. The owners chose MEA as solvent for this test because it is a well-studied solvent system with no commercial constraints regarding sharing of data. Learnings obtained from MEA studies are also expected to be of relevance for other solvent systems.
During this campaign the main focus was on thermal energy optimization at different flue gas flow rates through the absorber column and MEA emissions, with target for reduced CAPEX and OPEX. During the campaign, new options such as a rich solvent bypass to stripper overhead and higher concentration of MEA (up to 38wt%) were tested. Tests were carried out to identify plant configurations and process parameters with the potential for CAPEX and OPEX reduction in a post-combustion carbon capture plant. Significant cost of CO2 avoided reductions were achieved compared to the previous TCM campaigns for MEA.
1. Introduction
TCM is located next to the Equinor refinery in Mongstad (outside Bergen, Norway) which is the source of the two types of flue gases supplied to TCM. These sources are the combined cycle gas turbine (CCGT) based heat and power plant (CHP) and residual fluid catalytic cracker (RFCC). The owners of TCM started their third monoethanolamine (MEA) test campaign (MEA-3) in June 2017 and continued with MEA-4 and MEA-5 that lasted until October 2018. MEA-3, MEA-4 and MEA-5 have been the most significant collaboration campaigns that TCM has conducted since its inauguration in 2012. The large number of industrial, research and academic participants involved in these campaigns have enriched the projects and ensured that the results will serve a broad range of audiences.
A sub-campaign on cost reduction during MEA-5 was carried out by TCM owners in this capture plant to study various cost saving options. MEA was chosen as solvent for this test because it is a well-studied solvent system with no commercial constraints regarding sharing of data. This work follows previous work carried out on the same subject at TCM [1].
2. Test Campaign and Results
The TCM amine plant is shown in Figure 1. The plant has been in operation since 2012 carrying out tests on a number of proprietary and non-proprietary solvent systems. A recent modification to the plant is the addition of a rich solvent partial-bypass upstream of the lean-rich amine heat exchanger to the stripper top. This is intended to improve the energy performance of the plant. A noteworthy feature of the plant is that there are three different feed locations for the lean solvent to the absorber. This allows for testing at different packing height for CO2 absorption (12m, 18m, and 24m), as shown in yellow in the Figure. Another important feature is that the plant has two strippers with dedicated reboilers, the Combined Heat and Power (CHP) stripper suited for stripping of lower amounts of CO2 and the Residual Fluidized Catalytic Cracker (RFCC) stripper suited for larger volumes of CO2. Only CHP flue gas was utilized in the present campaign.
The purpose of the present campaign has been to explore different modes of operation with cost reduction potential. Such as higher flue gas throughput, lower packing height, more concentrated solvent and higher capture rate. Simple configurations such as operating with only one water wash section and higher flue gas inlet temperatures were also investigated. Table 1 summarizes the phases A to F of the test campaign.
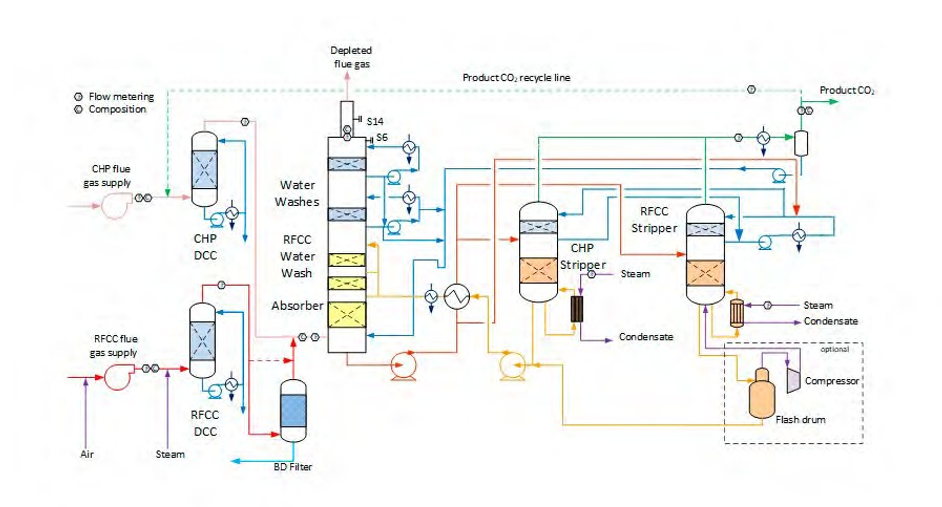
Fig. 1. A process flow diagram of the TCM Amine plant. The diagram illustrates the two different flue gas configurations (CHP and RFCC) as well as the available strippers. The CHP flue gas can be further enriched with CO2 from a CO2 recycle line, and the RFCC flue gas can be diluted with air to reach a target CO2 concentration.
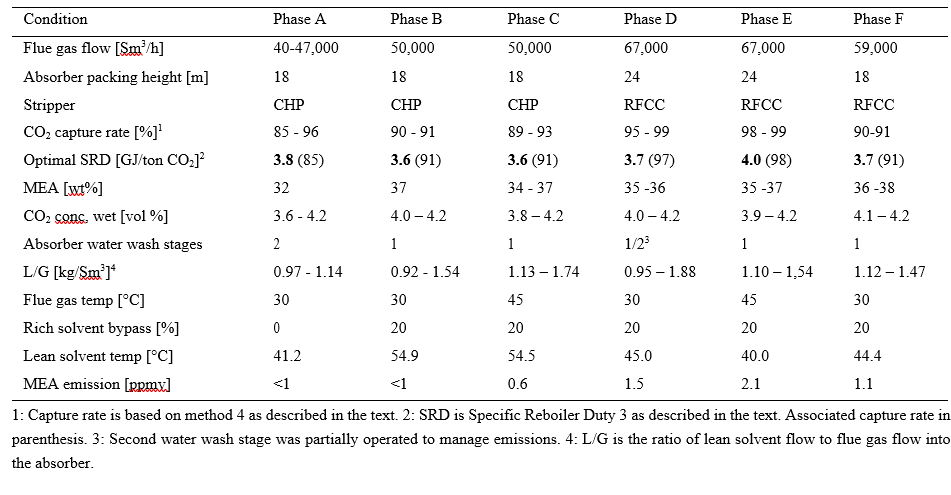
The rich solvent bypass was in operation during all phases of the campaign except phase A. Flue gas CO2 concentrations varied between 3.6 % and 4.2% during the campaign. The variations in CO2 concentration were achieved by use of a recycle. Phase A was operated at 32 wt% MEA and was investigating effect of CO2 concentration and flue gas flow.
Phase A was mainly intended to validate previous work and will not be discussed further. The rest of the cases were operated at MEA concentration up to 38 wt% and with the target of having only the lower absorber water wash section in operation.
Phase B and C were operated at 50,000 Sm3/h, 18-meter absorber packing, CHP stripper and with flue gas temperature out the absorber of 30 and 45°C, respectively. Operating with higher flue gas temperature could offer potential savings since this will enable the use of a smaller Direct Contact Cooler.
During Phase D and E this temperature variation was intended to be repeated at flue gas flow of 67,000 Sm3/h, 24- meter absorber packing and RFCC stripper in operation. The flue gas flow of 67,000 Sm3/h rate is the highest practically possible operating point at TCM and represents 113% of design capacity.
Finally, Phase F was operated at 18-meter absorber packing and 59,000 Sm3/h flue gas flow at 36-38wt% MEA.
The energy efficiency of the capture process is given by the Specific reboiler duty (SRD), this is defined as the heat delivered to the reboiler from the steam system divided by the amount of captured CO2:
where 𝑚𝑚steam is the steam flow to the reboiler heat exchanger. ∆𝐻𝐻 is the enthalpy difference between steam and condensate calculated from measured temperature and pressure, see also reboiler, steam and condensate in Figure 1. Steam pressure is typical around 2.5 barg and up to 160 °C for the tests reported in this paper. CO2 capture rate is the mass fraction of CO2 being captured out of the amount of CO2 flowing into the absorber. The amount of captured CO2 can be derived from the CO2 product flow out of the stripper or from difference in CO2 flow in and out of the absorber. SRD and capture rate are presented utilizing both methods below, while the economical assessment is based on difference in and out of the absorber such that the results can be compared to previous work [1]. This method is in the present paper referred to as “SRD 3”. SRD based on the product flow out of the stripper is referred to as “SRD 1”. The reported results are two-hour averages within a test slot that lasts more than 6 hours. Typically, one liquid solvent sample is taken for each test point.
In the present paper we report CO2 capture rates based on two methods, Capture Method 1 and Capture Method 4. Method 1 is based on the ratio between the stripper product flow and the absorber inlet flow, while Method 4 is based on the mass balance over the absorber [2].
TCM is equipped with multiple flue gas analyzers and flow meters for each of the main three gas streams. Table 2 shows the ones selected for the current analysis. Water is calculated assuming saturated conditions based on pressure and temperature. Flow out of the absorber is calculated from measured flow into the absorber assuming conservation of all components in and out of the absorber except water and CO2. Finally, it is assumed that product gas out of the stripper is only CO2 and water.
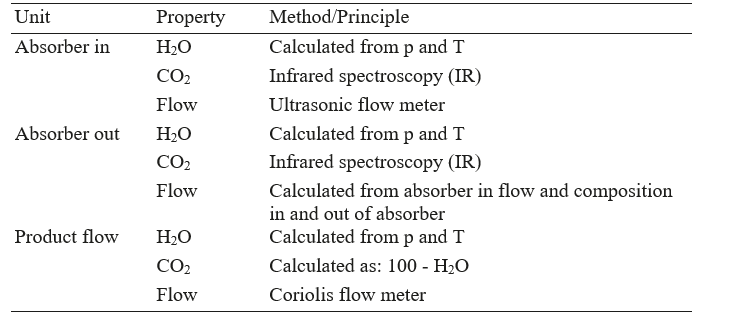
Table 2. Measurement of gas flows.
In Figure 2 SRD and capture rate vs. L/G for phase B is shown. At TCM optimum SRD is obtained by varying the lean flow rate (and thereby the L/G) and adjusting the reboiler duty at each solvent circulation point to maintain the required/targeted capture rate. The optimum SRD achieved here was 3.6 GJ/ton CO2 (based on SRD 3).
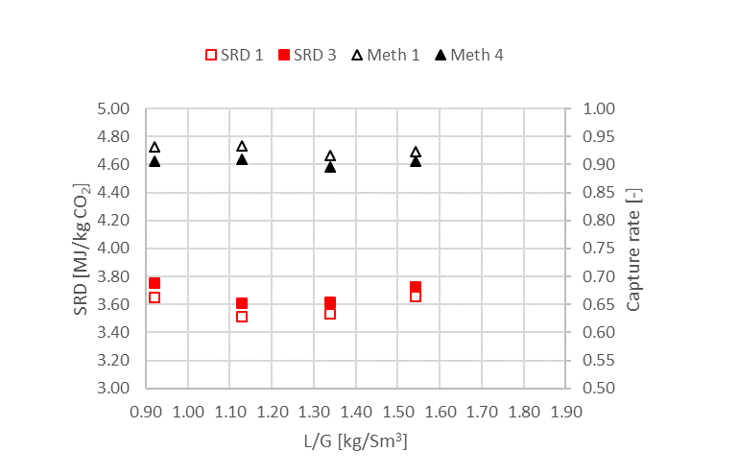
Fig. 2 SRD (left y-axis) and capture rate (right y-axis) for phase B as function of liquid to flue gas ratio (flue gas 50,000 Sm3/h).
One of the best cases demonstrated is “B3-rep” (at L/G of 1.13). The capture rate for this case is a bit above 90%, with SRD of 3.6 GJ/tCO2 with 18m packing height, 37 wt% MEA, one water wash and MEA emissions below 1 ppm. Flue gas flow is 50,000 Sm3/h and liquid to gas ratio (L/G) for “B3-rep” is about 1.13 kg solvent/Sm3 of flue gas. This can result in significant reduction of CAPEX and OPEX, compared to the MEA baseline.
In Figure 3 SRD and capture vs. L/G for phase D is shown. During Phase D 97% CO2 capture at an SRD of 3.7 GJ/ton CO2 were achieved. This SRD is perhaps lower than that would have been expected for a very high capture rate. The point at L/G of 1.38 has a high SRD, this is due to high levels of steam being utilized to achieve high capture rates. With Method 4 the capture rate was 99%, with Method 1 it was slightly over a 100% (due to accuracy limitations in calculation). Since the number is over 100% it is not visible in the plot.
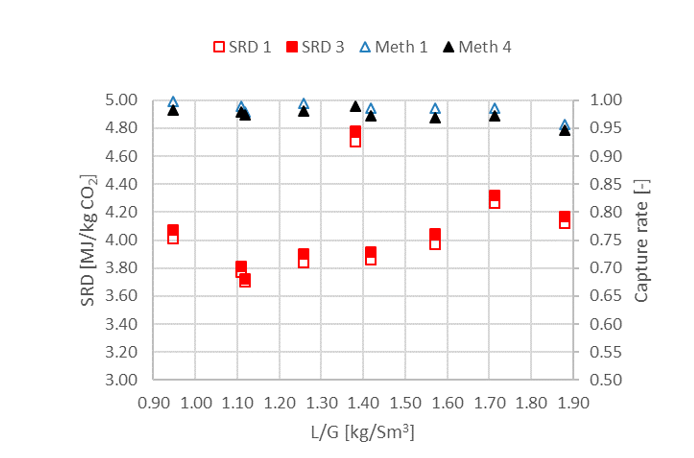
Fig. 3. SRD (left y-axis) and capture rate (right y-axis) for phase D as function of liquid to flue gas ratio (flue gas 67,000 Sm3/h).
Higher flue gas capacity tests at 67,000 Sm3/h resulted in high amine emission, which is partly due to mechanical entrainment and partly due to only one water wash section being in operation. However high solvent entrainment can be potentially reduced by improving the absorber design by installing a more efficient demister at appropriate location in the absorber. Very high CO2 capture rate of almost 99% was demonstrated with SRD of 3.8 GJ/tCO2 with 24 m absorption bed and 67,000 Sm3/h of flue gas capacity. The increase in SRD is about 6% when the capture rate increases from 90% to 99%, however the comparison is not fair as the plant capacity and configuration is not similar in the two cases.
During phase E higher flue gas capacity tests at 67,000 Sm3/h and flue gas temperature of 45°C resulted in a relatively high SRD and most importantly higher MEA emission as expected.
SRD and capture results from Phase F are shown in Figure 4. Case F2 with 3.8 GJ/ton CO2 and 90% capture rate was selected for further assessment in the next section.
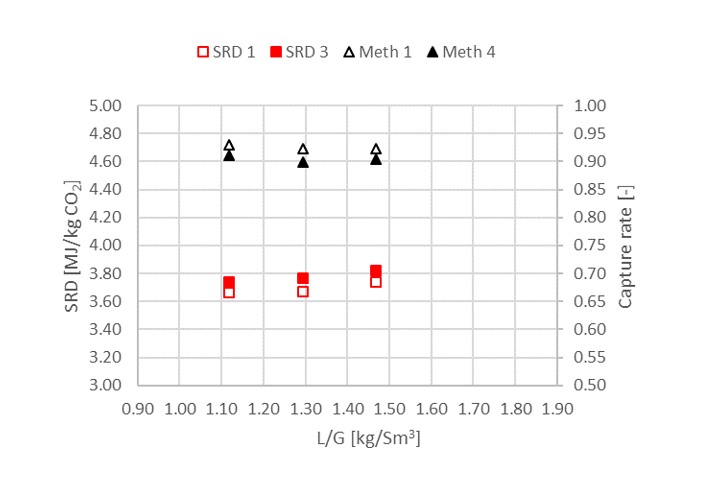
Fig. 4. SRD (left y-axis) and capture rate (right y-axis) for phase F as function of liquid to flue gas ratio (flue gas 59,000 Sm3/h).
In the present campaign the plant was mostly operated with 37 wt% MEA. There have been some relatively short campaigns at TCM in the past where the plant has operated with a concentration slightly higher than 40 wt% MEA [1]. From an energy performance perspective 40 wt% is expected to give better results. There is however a concern that solvent degradation will be more severe for 40 wt% MEA. Degradation can besides being a problem in itself also impact corrosion in the plant. 35 wt% MEA is what TCM is currently comfortable with operating, however long-term continuous test with 37-38 wt% MEA needs to be conducted to better understand degradation, emission and energy performance of the solvent.
Table 3 summarizes the selected cases for economical evaluation along with the reference case named MEA 3 (9-
4) [1]. Stripper pressures were maintained at 0.9 barg for all cases. The MEA-3 and B3-rep were operated with CHP stripper while F2 and D3-rep utilized the RFCC stripper. Liquid sample for case D3-rep is taken about 1 hour outside the 2 hours being averaged, but still within the test period.
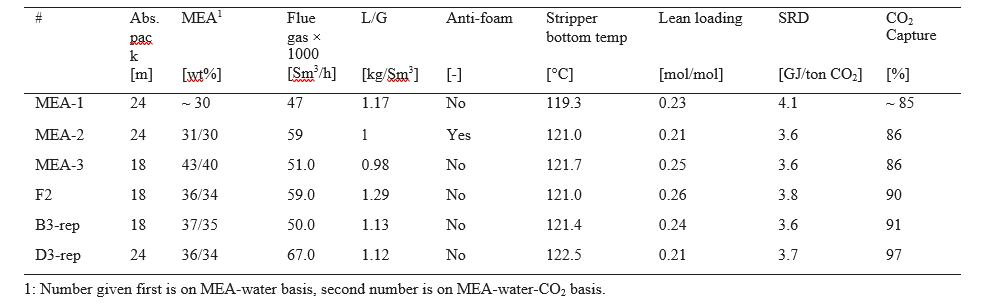
Table 3. Selected cases for economical evaluation [1-3]
3. Economic Evaluation
The economic evaluations of power and capture plants in this paper is based on standard “Cost of Electricity” (COE) and “Cost of CO2 avoided” metrics. These calculations are based on aligned and standardized estimates and assumptions on technology process performance such as energy efficiency, CO2 generation and capture rates, see e.g. [4]. Cost estimates include CAPEX, operations and maintenance (O&M) including fuel and a set of general price and rate of return assumptions. For each case below, a complete sized capture plant equipment list is established. Aspen In-Plant Cost Estimator (IPCE) V9 is used to estimate equipment cost. Equipment installation factors are then used to estimate total installed costs. Aligned with known projects, including contingency, 30% added to the Aspen Equipment cost and average installation factor of around 5.5. The OPEX can be split in annual cost (of CAPEX), power loss, maintenance, chemicals and fixed operating costs. The gas fired power plant specific cost and performance is based on GTPro simulation of a GE 9HA CCGT plant. 25% contingency is added to the estimated GTPro CCGT CAPEX number. All calculations are furthermore carried out at:
- normalized, per unit (kWh) output from the base industrial (power) plant
- pretax, pre-financing basis
- annual cost basis, applying a capital charge factor corresponding to a standard discount factor and project time horizon
Cost of CO2 avoided ($/ton CO2) is calculated according to Equation below and is based on cost of electricity (COE) and CO2 emission per kWh (CO2 emission) for a power plant with capture (cap) and without CO2 capture (no cap).
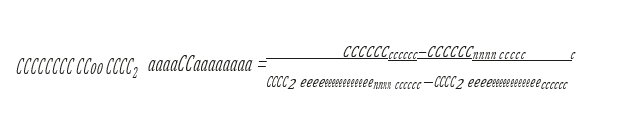
The calculated cost of CO2 avoided implicitly accounts for the capture systems’ own energy demand and its
inherent CO2 emissions. The following economic assumptions are applied:
- Fuel gas price: 0.1875 US $/Sm3
- On-stream hours: 7884 (90 %)
- Discount rate: 5 % real (pretax)
- Time horizon: 30 years
These were chosen to be consistent with a previous economical study [1].
This paper will only report percentage cost reduction and no absolute cost numbers. The main reasons are that the absolute numbers are not useful for the purpose of this work and are partially confidential. In this work one consistent method and one consistent set of assumptions are used for calculating the cost, which is important for a fair comparison.
The experiments targeted lowest possible absorber packing height, lowest possible L/G and SRD while maximizing the captured CO2 and capture rate. In Table 4 below the experimental data for the selected cases are scaled to a full- scale design at a fixed inlet CO2 flow of 150 tonnes CO2/h and measured capture rate case by case.
In order to compare on the same basis in the cost assessment, the CO2 inlet concentrations for all cases are adjusted to 4.2 % (wet) since the tests was done with close to 4.2 % (wet) CO2 in the flue gas. Typically, an H class gas-turbine will produce flue gas with at least 4.5% CO2 which will reduce the CO2 capture cost further. An increased CO2 content will impact all the cases in this paper equally (see discussion in previous paper [1]).
The adjusted/scaled absorber packing height and the most important cost parameter, the packing volume, are calculated from the experimental data for the cases selected in the test campaign. The scaled-up absorber volume is based on packing height utilized for each TCM test case and a scaled up cross sectional area. The latter is calculated based on TCM cross sectional area and the ratio of full-scale (150 tonnes CO2/h, corresponding to 700 MWlhv fuel input) to TCM (case by case) CO2 inlet flow.
For all scaled up cases the cross-sectional areas are adjusted to fit with a superficial velocity of 2 m/s (at 0 °C, 1 atm). This will secure less differences in pressure drop between the cases and less impact on the flue gas fan duty in a full-scale plant. This means that it is assumed that the CO2 capture rate depends mainly on the total packing volume and less on the differences in flue gas velocity through the absorber.
Thus, packing height, see Table 4, is adjusted in order to maintain the scaled-up absorber packing volume. The packing volume per captured CO2 will be equal for each TCM case and corresponding scaled up case. The data are shown in Table 4 including lean solvent flow rate, specific packing volume, amount of captured CO2 and CO2 capture rate.
Packing volume is a significant CAPEX element and the most cost-effective packing volume demonstrated in this campaign was 34 m3/tonne CO2 capture per hour for the current test conditions. In Case B3-rep and D3-rep a significantly larger stripper (RFCC) was used removing any limits in the stripper process. This had a positive effect in allowing operating with a lower inlet lean loading at an increased solvent flow rate to the absorber (i.e. keeping an optimal L/G) increasing the absorber CO2 capture capacity and significantly increasing the CO2 capture rate.
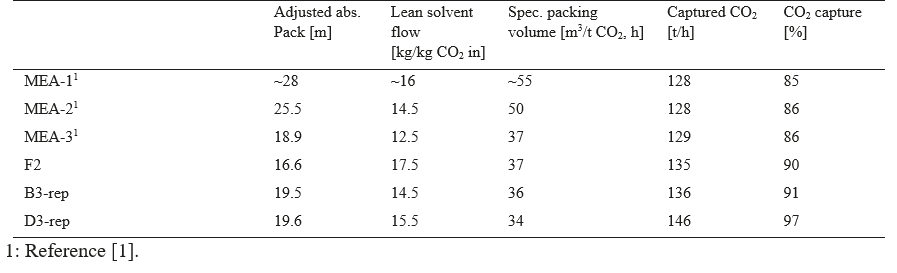
Table 4. Key cost parameters.
The section above introduced the economic evaluation and cost of CO2 avoided. In Figure 5 the demonstrated cost reduction for the selected three test cases are compared with the best result from the MEA-3, 2 and 1 campaign [1]. The previous assessment [1] has been revisited and the presented relative cost of CO2 avoided are updated based a newer gas turbine (H class).
Case D3-rep demonstrates the largest cost reduction contribution, i.e. 4.8 % down relative to MEA-3 and close to 20% relative to MEA 1 The trend is a reduction in CO2 capture cost with increasing CO2 capture rate. Since more CO2 is being captured for a given flue gas stream the total cost (CAPEX) of CO2 handling will increase somewhat also increasing cost of electricity. For case D3-rep this represents an increased cost of electricity with 3-4% compared to the MEA-3 case. Due to the significantly higher amount of CO2 captured, the avoided CO2 cost will still be reduced as shown in Figure 5 below. The cost estimation was done with two water wash stages for the case D3-rep. Results from the campaign did suggest that one stage could have been sufficient, resulting in some additional savings.
Since the cost reduction potential of these measures is experimentally verified in one of the world’s largest demonstration plants, the cost reduction should be highly accurate, and hence relevant for future post-combustion plants.
Fig. 5. Demonstrated reduction in cost of CO2 avoided for the selected cases compared with the earlier MEA campaigns.
4. Conclusions
The results show encouraging cost reduction potential such as lower energy numbers for a more concentrated (35 wt%) MEA solvent and more cost-efficient design of the capture plant. Cost improvements of 4.8% were achieved compared to the previous TCM benchmark (MEA 3) and close to 20% compared to the first campaigns. These results can be viewed as a form of debottlenecking of the amine plant, optimizing its throughput. However, the impact of working with a more concentrated solvent on corrosion, solvent degradation and emissions is something that must be explored further.
It is important to notice that these results are generated at one of the world’s largest capture demonstration units, and that it is one of the first times such a structured campaign is executed. Similar testing can be carried out with different amine-based solvents. Therefore, these results at TCM scale represent a very relevant basis for scale up and industrial design of amine solvent capture technologies.
Acknowledgements
The authors gratefully acknowledge the staff of TCM DA, Gassnova, Equinor, Shell and Total for their contribution and work at the TCM DA facility. The authors also gratefully acknowledge Gassnova, Equinor, Shell, and Total as the owners of TCM DA for their financial support and contributions.
References
- Gjernes E, Pedersen S, Jain D, Åsen KI, Hvidsten OA, de Koeijer G, Faramarzi L, de Cazenove T. Documenting modes of operation with cost saving potential at the Technology Centre Mongstad. GHGT-14, 21st-25th October 2018, Melbourne, Australia
- Faramarzi F, Thimsen D, Hume S, Maxon A, Watson G, Pedersen S, Gjernes E, Fostås BF, Lombardo G, Cents T, Morken AK, Shah MI, Cazenove Td, Hamborg ES. Results from MEA testing at the CO2 Technology Centre Mongstad: Verification of baseline results in 2015. Energy Procedia, 114, 2017, 1128-1145
- Hamborg ES, Smith V, Cents T, Brigman N, Falk-Pedersen O, de Cazanove T, Chhagnlal M, Feste JK, Ullestad Ø, Ulvatn H, Gorset O, Askestad I, Gram LK, Fostås BF, Shah MI, Maxson A, Thimsen D. Results from MEA testing at the CO2 Technology Centre Mongstad. Part II: Verification of baseline results. Energy Procedia 63, 2014, 5994-6011
- Cost and Performance Baseline for Fossil Energy Plants Volume 1a: Bituminous Coal (PC) and Natural Gas to Electricity Revision 3, July 6 2015, DOE/NETL-2015/1723