
8. First Process Results and Operational Experience with CESAR1 Solvent at TCM with High Capture Rates (ALIGN- CCUS Project) (2021)
Christophe Benqueta,b*, Anette Knarvikb, Erik Gjernesc, Odd Arne Hvidstenb, Eirik Romslo Kleppeb, Sundus Akhterb
aTotal E&P Norge, Finnestadveien 44, Dusavik, 4029 Stavanger, Norway bTechnology Centre Mongstad, 5954 Mongstad, Norway cGassnova SF, Dokkvegen 10, 3920 Porsgrunn, Norway

Abstract

In 2019, the Technology Centre Mongstad (TCM) operated, in the frame of ALIGN-CCUS project, a test campaign using CESAR1 solvent, a blend of AMP and PZ. The main objective was to demonstrate CESAR1 operability and performance at large scale and produce knowledge that can be used to enhance the deployment of post-combustion capture at commercial scale. Tests were carried out on CCGT flue gas and varying process conditions and plant configurations. The current paper presents an overview of the test campaign and reports on energy performance, solvent consumption and operational experience. The CESAR1 solvent was found to require less energy than 30 wt% MEA considered as the reference. Although PZ degrades easily in presence of NO2, the solvent consumption was kept low over the campaign. Solvent precipitation in the absorber was experienced in severe conditions. Successful mitigating actions were applied to reverse it and operating procedures were developed to avoid it.
1. Introduction
The Technology Centre Mongstad (TCM) is the world’s leading facility for verifying and improving CO2 capture technologies. TCM is located at Mongstad, one of Norway’s most complex industrial facilities, next to the Mongstad refinery operated by Equinor. TCM has been operating since autumn 2012, providing an arena for qualification of CO2 capture technologies on an industrial scale. TCM is owned by Gassnova (on behalf of the Norwegian state), Equinor (formerly Statoil), Shell and Total. In 2019, TCM executed a test campaign with a non-proprietary solvent called CESAR1 in the frame of the ALIGN-CCUS project.
ALIGN-CCUS (Accelerating Low CarboN Industrial Growth through Carbon Capture Utilisation and Storage) is a project from the first ERA-NET Co-fund ACT program. In this program nine European countries, together with the European Union Horizon 2020 program are joining forces for research and actions. The ALIGN consortium involves 31 partners from industry, research and academia and has considerable involvement of industrial companies and an enterprise organization. The ALIGN-CCUS (ALIGN) project aims to accelerate the transition of current industry and power sectors into a future of continued economic activity and low-carbon emissions, in which carbon capture, utilization and storage (CCUS) plays an essential role. For the optimization and cost reduction of post-combustion capture (PCC) technology, the consortium realizes testing programs at four different pilot plants and testing facilities: the Technology Centre Mongstad (NOR), the SINTEF pilot rig at Tiller, Trondheim (NOR), RWE’s Coal Innovation Centre at Niederaussem (DE) and the PACT facilities at Sheffield (UK). Collaboration of TCM with ALIGN-CCUS project is significant in bridging the knowledge gaps, and reducing HSE, technical and financial risks of technology deployment at large scale.
The test campaign has been carried out from September 2019 to January 2020 with a blend of aqueous 2-Amino- 2-methylpropan-1-ol (AMP) and Piperazine (PZ). The amine concentrations were respectively 27 wt% and 13 wt%. This blend is called CESAR1 and has been developed during a former EU project (CESAR). This non-proprietary solvent is known to perform better than generic aqueous 30 wt% MEA and has been proposed by IEAGHG as their new benchmark [1]. It has potentially lower thermal energy consumption and lower solvent degradation rates than generic MEA. On the downside, AMP is volatile and may lead to relatively high emissions. In addition, PZ is a toxic compound and can also lead to precipitation at both very high and low CO2 loading, in combination with other process parameters like temperature of the solvent and flus gas. The purpose of the test campaign was to develop knowledge related to emissions, degradation and safe operation in industrial environment with the CESAR1 solvent.
This paper describes in the first part the parametric testing performed in different configurations of the amine plant. Optimum performances were determined by varying the liquid to gas ratio at capture rates from 85% up to 98%. This high capture rate was selected as high capture rate, close to 100%, are expected in the near future. The absorber was operated with 12, 18 or 24m of packing. For this work, the TCM amine plant was operated with flue gas from the Equinor’s CCGT plant at Mongstad. The second part describes TCM operational experience with the CESAR1 solvent.
| Nomenclature | |||
| AMP | 2-Amino-2-methylpropan-1-ol | ppmv | Parts per million by volume |
| Capex | Capital expenditure | PZ | Piperazine |
| CCGT | Combined Cycle Gas Turbine | RFCC | Refinery Fluid Catalytic Cracking |
| CHP | Combined Heat and Power | SCR | Selective Catalytic Reduction of NOx |
| DCC | Direct Contact Cooler | Sm3/h | Standard conditions: 101.325 kPa and 15°C |
| HSE | Health, Safety and Environment | SRD | Specific Reboiler Duty |
| MEA | Monoethanolamine | TCM | Technology Centre Mongstad |
| Opex | Operational expenditure | wt% | weight percent |
2. Initial assessment of CESAR1 performance at TCM
2.1 TCM amine plant
The amine plant is a generic and highly flexible CO2 capture plant designed and constructed by Aker Solutions and Kværner. The amine plant captures CO2 either from CCGT flue gas with a design CO2 production capacity of 80 tonnes/day or from RFCC flue gas with a capacity of 200 tonnes/say. The ALIGN-CCUS campaign has been performed with CCGT flue gas. The plant was lined up with the CHP DCC and CHP stripper. Figure 1 given below shows a simplified process flow diagram of TCM amine plant. Flue gas from the blower is conditioned and saturated with water to the required temperature (normally 20-50°C) in the DCC. The lean amine solvent can be fed either at 12m, 18m or 24m to the absorber structured packed bed (highlighted in yellow in Figure 1). Rich amine from the absorber is pumped through the rich/lean cross plate heat exchanger to the top of CHP stripper. A slip stream of the cold rich amine is bypassed upstream the heat exchanger to the stripper overhead. A more detailed description of the amine plant is available elsewhere [2,3]
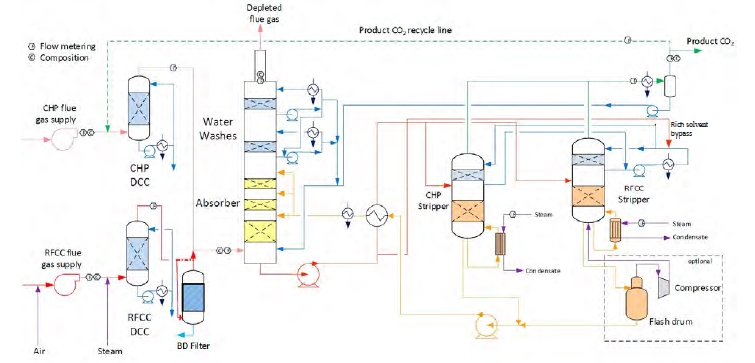
Figure 1. TCM Amine plant flowsheet.
2.2 Test plan description
The test campaign started on September 12th, 2019. The storage tank was filled with 26 tonnes of a concentrated aqueous mixture of AMP (48.0 wt%) and PZ (23.7 wt%) supplied by Brenntag. The solvent was diluted with demineralized water to reach the targeted concentration of 27 wt% of AMP and 13 wt% of PZ (AMP/PZ ratio of 2.1). The actual concentrations of AMP and PZ after dilution were respectively 25.37 and 12.41 wt%. The amine concentration has been adjusted continuously over the test campaign, depending on operating conditions, to maintain the amine concentration. The amine plant has been operated for more than 1500 hours until the 10th of January. The test plan has been adjusted throughout the campaign based on the results and may be found in Table 1. In every test, the flue gas flow rate and solvent flow rate were kept constant and the steam flowrate was adjusted to reach the targeted capture rate.
The test campaign started with the phase A at 90% capture rate. The tests were run with a flue gas temperature at the absorber inlet of 30°C, 24 meters of packing in the absorber. Phase B was a repeat of phase A with a higher capture rate, targeted at 98%. Precipitation was observed in the lower section of the absorber because of low flue gas temperature and high CO2 loading in the rich solvent (see section 3.2). As the flue gas temperature affects the capture plant thermal performance, tests from phases A and B were repeated later with a flue gas temperature at 40°C (respectively phases AA and BB).
Performance tests with 18 m of packing were carried out with a flue gas at 40°C in phases C and D, respectively at 90 and 98% capture rates. Tests with 12 m of packing were conducted in phase E with 90% of CO2 captured. A higher capture rate was not achievable here due to maximum capacity of the CHP reboiler and the CHP stripper.
| # | Abs. pack | Flue gas x 1000 | Flue gas temperature | CO2 wet abs inlet | L/G | CO2 Capture |
| [m] | [Sm3/h] | [°C] | % | [kg/Sm3] | % | |
| A | 24 | 50 – 59 | 30 | ~ 3.5 | 0.6 – 1.2 | 90 |
| AA | 24 | 50 – 60 | 40 | ~ 3.5 | 0.6 – 0.9 | 90 |
| B | 24 | 50 | 30 | ~ 3.5 | 0.7 – 1.2 | 98 |
| BB | 24 | 50-59 | 40 | ~ 3.5 | 0.7 – 0.9 | 95-98 |
| C | 18 | 50 – 59 | 40 | ~ 3.5 | 0.7 – 1.2 | 90 |
| D | 18 | 50 | 30-40 | ~ 3.5 | 0.7 – 1.2 | 98 |
| E | 12 | 50 | 40 | ~ 3.5 | 0.8 – 1.3 | 90 |
| K | 18-24 | 59 | 40 | ~ 3.5 | 0.6 – 0.8 | 85 |
| F | 18 | 59 | 40 | ~ 3.5 | 0.7 | 90 |
| MEA 2 | 24 | 47 | 30 | 3.6 | 0.9 | 87 |
| MEA Base | 24 | 59 | 30 | 3.6 | 1.0 | 84 |
Table 1. Operational parameters for the TCM ALIGN-CCUS test campaign and the MEA test cases MEA 2 and MEA Base [2, 4]. Stripper pressure was set at 0.9 barg except for the F series where it varied from 0.5 to 1.6 barg.
In phase F, the plant was operated with 18 m of packing and 90% capture rate, at the optimal liquid-to-gas ratio (L/G) from phase C tests. The purpose was here to assess the effect of the stripper pressure on the energy penalty of CESAR1 solvent. Working at higher pressure is beneficial for the CO2 compression step. The downside might be a higher degradation rate of the solvent provoked by the higher temperature in the reboiler.
The purpose of phase K was to compare the CESAR1 performance against MEA baseline conducted in TCM amine plant [4]. The operating conditions were kept as close as possible to MEA tests to make the comparison more relevant, except the flue gas temperature. Those tests were carried out with 18 and 24 meters of packing, while MEA baseline was at 24 meters. TCM amine plant has been designed to be flexible, based on generic MEA solvent. Compared to MEA, the optimum L/G ratio with CESAR1 is lower due to its higher working capacity. The optimized operating conditions with CESAR1 were found to be very close to the limit of the operating window of the stripper due to very low amine circulation rate and hence low wetting of the packing. The amine pumps and stripper are oversized for this type of solvent. The best performances are achieved at the minimum flowrate delivered by the amine pumps (35,000 kg/h) and below the turndown capacity of stripper. The CHP stripper is designed for a minimum liquid flow rate of 42,000 kg/h. Hence, the performance may be affected by the plant design.
TCM used the same calculation method to assess the performance of the CESAR1 solvent as in [2] that also presents a detailed description of the methodology and the instruments used. The capture rate is calculated over the absorber. The energy demand is based on the energy brought to the reboiler and is called the specific reboiler duty (SRD).
2.3 Results from tests at 90% capture rate
Figure 2 shows the energy consumption required to capture 90% of the CO2 from the CCGT flue gas. The best performance is achieved with 24 m of packed bed. The plot shows better results with flue gas temperature at 30°C compared to 40°C (A vs AA series). The minimum steam consumption is around 3.1 MJ/kg CO2 which is significantly lower compared to 30 wt% MEA solvent tested at TCM. The optimum is found at the lowest L/G ratio, i.e. 0.7 kg/Sm3.
The steam consumption increases by approximately 15% when the flue gas temperature goes up to 40°C. However, the plant cannot be operated at 30°C for a long period of time because of precipitation of CESAR1 solvent in the absorber. The energy consumption is partially dependent on flue gas temperature, this indicates a room for improvement either by adjusting the flue gas temperature and/or the amine concentration.
Reducing the packing height from 24 to 18 meters does not impact the steam demand (AA vs C series). The upper 6 meters of packing are not necessary to capture 90% of the CO2 . With a shorter absorption section (12 meters, E series), the energy demand increases significantly. The SRD at optimum conditions is 25% higher, corresponding to an L/G ratio between 1.0 and 1.1 kg/Sm3. A short absorption column is not suitable to achieve low energy consumption but may be beneficial for projects where cheaper thermal energy is available or lower CO2 capture rate is targeted. CESAR1 results are compared to TCM operation with 30% MEA at 47,000 Sm3/h flue gas flow [2], see also Table 1. The left part of Figure 2 shows that operation with CESAR1 resulted in lower SRD values at lower liquid to gas ratios compared to the MEA 2 case. The right part of Figure 2 shows CO2 concentration into the absorber and lean amine loading. The AA and MEA 2 cases are at a higher CO2 level than the other cases. Lean loading is, as expected, decreasing for decreasing L/G ratios.
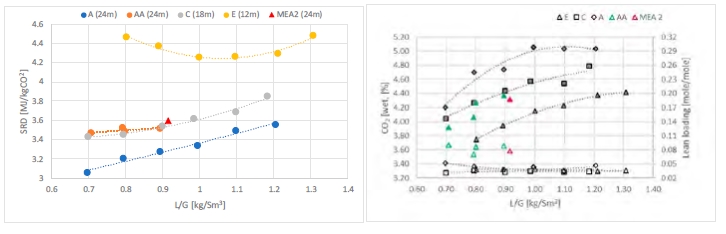
Figure 2. Left: Specific reboiler duty versus liquid to gas ratio for CESAR1 test series and MEA 2. The CO2 capture rate is around 90% and flue gas flow into the absorber 50,000 Sm3/h. Case A and MEA 2 are with 30°C flue gas temperature while rest of the cases are at 40°C – Right: CO2 concentration (wet) into the absorber and lean amine loading for CESAR1 test series and MEA 2 [2]. Open symbols are for CO2 concentration and left y-axis and filled symbols for lean loading and right y-axis.
2.4 Results from test at 98% capture rate
Figure 3 shows the energy demand to achieve 98% capture rate. The lowest energy consumption is achieved with
flue gas at 30°C and 24 meters of packing (B series). Operating conditions being very close to A series, precipitation
was also experienced. Flue gas temperature was adjusted to 40°C (BB series) leading to a 15% higher steam
consumption. The optimum case in BB series is not found at the lowest L/G ratio, but at 0.8 kg/Sm3. With an absorption section of 18 meters, contrary to the 90% capture rate cases, the energy demand is slightly higher. With an absorptionsection of 12 meters, the 98% capture rate was not achieved. The limitation is coming from the lean loading. The lean solvent is not lean enough to reach such a high capture rate despite the maximum steam flow rate in the reboiler.
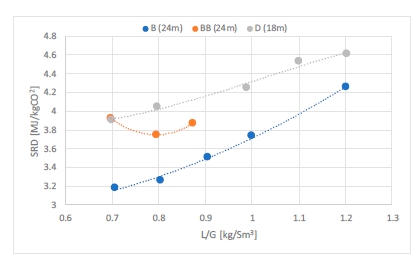
Figure 3. Specific reboiler duty versus liquid to gas ratio for CESAR1 test series B (blue), BB (orange) and D (grey). The CO2 capture rate is around 98% and flue gas flow into the absorber 50,000 Sm3/h. Case B is with 30°C flue gas temperature while the rest of the cases are at 40°C.
2.5 Variation of capture rate
The energy needed to capture either 85% or 90% of CO2 is very similar as shown in Figure 4. This observation is valid at both packing heights (18 or 24 meters). There is a gap in energy consumption to reach 98% capture rate regardless the packing heights. However, it might still be acceptable in some cases where high capture rates are targeted. The increase in SRD to reach 98% capture rate is in the range 5-15% compared to 90% capture rate cases. The gap is larger with a shorter absorption bed (18 meters). While the capture rate in many projects was set around 90%, there is a new tendency to increase it above 95% and minimize the CO2 emitted [5]. The CESAR1 solvent shows a good ability to reach this target with a limited extra steam consumption. In Figure 4, CESAR1 tests are also compared to MEA base [4] which was operated at 30% MEA. The K-series and MEA base were operated at 59,000 Sm3/h flue gas flow, 24-meter absorber packing and at around 85% capture rate. The K series resulted in lower SRD values than MEA base at lower L/G ratios. Figure 5 shows corresponding values for CO2 concentration into the absorber and lean CO2 loading. The CO2 concentration was constant in CESAR1 tests around 3.4% while it was higher in MEA base. Higher the CO2 concentration lower the energy demand.
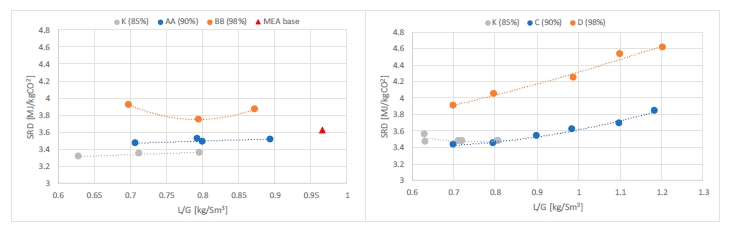
Figure 4. Specific reboiler duty versus liquid to gas ratio for CESAR1 tests and MEA base at 30% amine concentration [4]. The left figure shows results at 24 meters of packing while the right figure shows results at 18 meters of packing. Flue gas flows into the absorber in case K and MEA base are 59,000 Sm3/h while rest of the cases are at 50,000 Sm3/h. Capture rate varies from 85% to 98%.
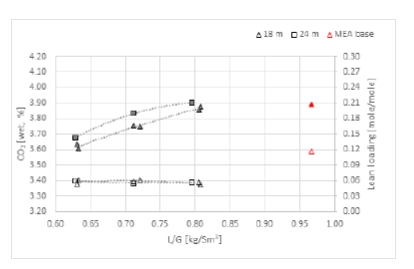
Figure 5. CO2 concentration (wet) into the absorber and lean amine loading for test series K (black) and MEA base (red) [4]. Open symbols are for CO2 concentration and left y-axis and filled symbols for lean loading and right y-axis.
2.6 Stripper pressure test
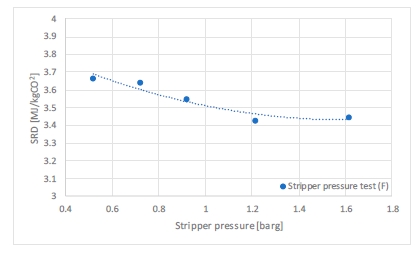
Based on results from phase C (18m of packing, 90% capture rate), the phase F was carried out to assess the effect of the stripper pressure on the performances. From a solvent management point of view, it is better to run the stripper at low pressure to reduce the stripper bottom temperature and hence, reduce the thermal degradation rate of the solvent. On the CO2 transport side, getting the CO2 at a higher pressure will be beneficial to reduce both Capex and Opex for CO2 compression. Based on optimal conditions from phase C, the stripper pressure was varied from 0.5 up to 1.6 barg. The flue gas flowrate was increased to 59,000 Sm3/h while keeping the L/G ratio at 0.7 kg/Sm3. This change in flue gas flow rates aims at increasing the liquid flow rate and improve the vapour-liquid traffic in the stripper, while remaining within the stripper overhead capacity. The specific reboiler duty presented in Figure 6 is plotted against the stripper pressure. The minimum energy consumption is found at 1.2 barg, where the stripper bottom temperature is 124°C, which might seem acceptable. However, long term tests are needed to quantify its effect on solvent degradation and consumption together with corrosion.
2.7 Solvent Management
In addition to the energy consumption, another important parameter to assess the performance of an amine-based capture technology is the solvent consumption. There are two main sources of solvent loss, one is from degradation, the other one is from emission to the atmosphere from the absorber stack. The solvent consumption depends mainly on the flue gas composition and impurities and on the operating conditions. An investigation of solvent degradation and emissions from TCM amine plant operated with MEA has previously been published [6]. The solvent loss during the CESAR1 campaign is based on parametric testing and might not represent the solvent loss for relatively stable operations applicable to commercial plants.
The thermal and oxidative degradation mechanisms for AMP and PZ have been explored separately [7-9]. According to the literature, the most common PZ degradation products are Piperazinol, Ethylene diamine (EDA), 2- oxopiperazine (OPZ), N-formyl piperazine (FPz), N-methylpiperazine (MPZ), Aminoethyl piperazine (AEP), Mononitrosopiprazine (MNPZ), Acetate, Oxalate, Ammonium, Ethylpiperazine (EPZ) and Ammonia. Other minor products include carboxylate ions, amides, glycolate, nitrite and nitrate. Most common AMP degradation products are 4, 4-dimethyl-2-oxazolidinone (DMOZD), 2, 4-Lutidine, Acetone and Formic acid.
The main areas of plant that facilitate degradation for any amine in post-combustion CO2 capture process are absorber sump, cross heat exchanger, reboiler, and reclaimer [7]. Thermal and oxidative degradation occur mainly due to the high temperature of the process, in the presence of dissolved oxygen, metals and free radicals [7].
With CESAR1 solvent, PZ was observed to be the most degraded amine. The main reaction was between NO2 coming from the flue gas and secondary amine functionality of the PZ to form Nitrosopiperazine. Nitrosamine concentration in the solvent has increased constantly through the campaign. Nitrosamines were not released in the stripper. Solvent reclaiming is the only way to wash them out. However, as long as the solvent performance are not affected, there is no specific risk associated to run the plant with non-volatile nitrosamines. Other degradation products include formic acid which was the major degradation product (see Figure 7) among the small chain organic acids. For the detailed analysis of solvent loss due to degradation and emission, the campaign was divided into Period 1 and 2. Duration for Period 1 with low NO2 (0.5 ppmv) was September 12, 2019 to October 12, 2019 and Period 2 with high NO2 (2.35 ppmv), was from October 12, 2019 to November 1, 2019). The NO2 concentration in Period 2 is considered high and was the result of no ammonia feed to the Selective Catalytic Reduction of NOx (SCR) in the CHP plant, upstream the amine plant.
A comprehensive lab schedule was set up, covering all analysis needed to follow up on the performance of the plant, emissions, corrosion and degradation. Samples were taken from lean amine and chemical analysis of the samples were performed to analyze the solvent condition. The calculations were based on wt% CO2, wt% AMP, wt% PZ, water content (Karl Fisher), degradation products and heat stable salts (HSS). The most common amine strength titration method (Total alkalinity) was developed for amine solutions with no contaminants. Non-volatile degradation products (DMOZD, 2,4 Lutidine, MNPZ, OPZ) were quantified and the formation and total accumulation determined for Period 1 and Period 2 are presented in Figure 7 and Table 2. The rates of formation of MNPZ and OPZ have increased in Period 2 as compared to Period 1, due to the increased NO2 concentration. Inventory variation for the testing period of Period 1 and Period 2 was evaluated based on the changes in total solvent alkalinity. Possible unquantified degradation products are formylpiperazine (FPZ), Acetylpiperazine (APZ) and unknown products with molar masses 55.057, 56.05 and 57.06 gram/mol were detected by PTR-ToF-MS. Further investigation would be needed to allow for quantification. Other factors include high levels of NOx and oxidative degradation catalyzed by increased iron concentration. Iron catalysis may also affect the formation of total formate and ammonia (both increase with increase in iron concentration) [8]. Alkalinity balance decreases as well with the increase in the concentration of iron in the solvent.
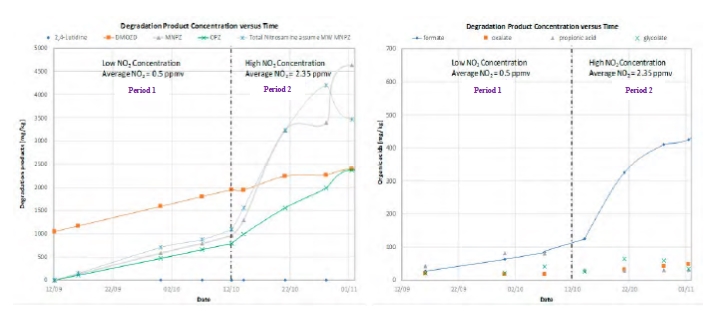
Figure 7. Degradation product concentration in Period 1 and Period 2 during CESAR-1 testing campaign (left). Degradation product concentration versus time showing increase in the concentration of formic acid or formate in Period 2 (right).
| Parameters | Units | Period 1 | Period 2 |
| Amine loss (Degradation products) | kg | 87.04 | 356.90 |
| CO2 captured | kg | 1971.68 | 2112.05 |
| Amine loss per ton of CO2 captured | kg amine/ton CO2 | 0.044 | 0.169 |
| Total ammonia emissions to stack | kg/hr | 0.11 | 0.17 |
| Total aldehyde emissions to stack | kg/hr | 0.029 | 0.035 |
| AMP emissions to stack | kg | 135.2 | 68.3 |
| PZ emissions to stack | kg | 2.8 | 1.5 |
| Total amine loss to stack / ton of CO2 | kg amine/ton CO2 | 0.070 | 0.033 |
| Total Amine loss per ton of CO2 captured (emissions + Degradation) | kg amine/ton CO2 | 0.114 | 0.202 |
Table 2. Total amine losses (emissions + degradation).
Atmospheric emissions were monitored throughout the campaign and are reported in a separate publication [10]. For the entire campaign, the piperazine emissions were in low ppb levels, even under high emissions testing. AMP emissions were in the range of 0.3 ppm to 2 ppm for standard U-curve tests, with high emissions tests yielding emission levels in the range of 6-9 ppm (e.g. reduced water wash efficiency). Nitrosamines were not detected in absorber stack even at ppb level. This topic will be addressed in an upcoming paper.
Based on emission and degradation, the average solvent loss has been estimated to be 0.16 kg amines/ton of CO2 for CCGT type of flue gas. This number represents 1600 hours of operation with a lot of parameters variating and it is considered to be in the low range of amine solvent loss. Similar or higher numbers were reported from test campaigns carried out at TCM [6, 11], e.g. MEA consumption was estimated around 1.5 kg amines/ton of CO2 during TCM MEA-2 campaign.
Successful solvent management includes setting strict threshold limits for the key indicators and applying reclaiming to keep the solvent as clean as possible. Proper solvent management has the potential to control solvent degradation and emissions and thus lower solvent consumption and reduce maintenance needs. From TCM’s operational experience, good solvent hygiene can be achieved by closely monitoring physical appearance of the solvent, together with degradation and emissions. An increase in ammonia emission will give a direct indication of solvent degradation and factors like NOx concentration in the flue gas and iron content can have a huge impact on solvent degradation. The solvent should be clear, light in color and the solvent mass balance should be closed. It is important to keep the solvent fresh, with low concentrations of degradation and corrosion products. Other important measures to improve the solvent hygiene can be solvent reclaiming.
3. Operational experience
3.1 Lab experiments, solvent supply and limits for operation
A set of laboratory experiments were carried out prior to purchase of solvent for three different purposes:
- Determine if the solvent components (AMP and PZ) should be ordered separately or pre-mixed.
- Supply information about solvent behavior and if it precipitates at various CO2 loading and temperature.
- Study at which levels of CO2 loading and temperature precipitation occurs.
For the first purpose, samples of 90% AMP, 68% PZ and a mixture with 53% AMP and 28% PZ were exposed to different temperatures. Piperazine precipitated when exposed to temperatures below 50°C. AMP and the AMP/PZ mixture samples did not form precipitate above 7°C. Based on the results, it was recommended to order the blend pre- mixed to avoid precipitation of pure piperazine in the solvent storage system.
For the second purpose, the AMP/PZ mixture was diluted to 27% AMP and 14% PZ and three samples of the mixture were prepared: one rich (0.73mole CO2/mole amine), one lean (0.10 mole CO2/mole amine) and one unloaded. These samples were each divided in three and exposed to 4°C, 25°C and 40°C. Precipitation occurred in all three rich samples and gel formed in the lean and unloaded samples at 4°C. The samples at 4°C are depicted in Figure 8, showing the two different changes observed in the samples at high, low and no loading. Further, the rich solvent sample was diluted with unloaded CESAR1 solvent to study closer at which levels of CO2 loading and temperature precipitation occurs. The results from the experiments with varying loading and temperature are given in Table 3. Overall, these experiments show that, at low loading, the solvent form a gel at low temperatures, while precipitation occurs at high loading and especially in combination with low temperatures. At the highest loading, precipitation occurs at all temperatures. An additional test was conducted on some of the samples to attempt to reverse the precipitation and gel formation. The gel vanished after heating to 40°C. All rich samples with 0.73 moles CO2/mole amine were heated to 55°C. The precipitate in these samples was not dissolved.
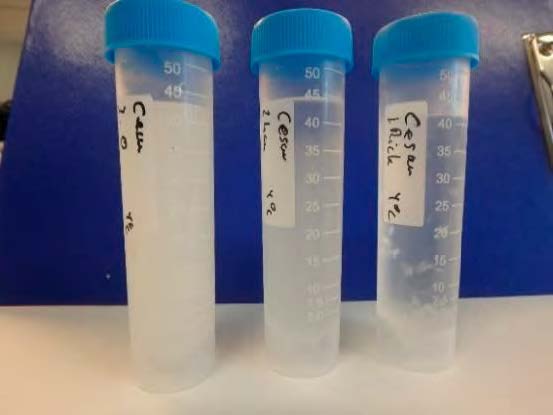
Figure 8. Samples of unloaded, lean (0.1 moles CO2/mole amine) and rich (0.73 moles CO2/mole amine) CESAR1 solvent at 4°C.The unloaded (left) and lean (middle) solvent form a gel, while precipitation is observed in the rich (right) sample.
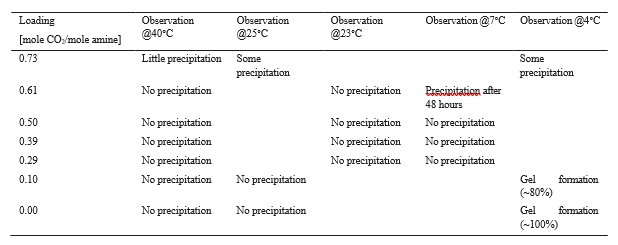
Table 3. Overview of observations made during the experiments where samples of different loading were exposed to different temperatures.
The mixed solvent was delivered at 72% amine concentration. As lab test showed gel formation in lean and unloaded solvent at low temperatures, the solvent was delivered at 40°C and storage tank temperature maintained at 45°C by circulating and heating the solvent. The plant was initially filled with solvent from the storage tank. Make- up from the tank has been added when needed. The lines from the tank to the plant have freeze protection but are not heated. To avoid gel formation in these lines, flushing with water after any transfer from tank to plant has been a part of the filling procedure. Even with water flush after each transfer, there have been some issues with plugging of the line. One part of the line is not possible to flush, and this is believed to be the cause of the plugging. Dilution of the solvent in the tank has been suggested as a mitigating action in order to reduce the risk of plugging the line.
The lab experiments indicate that both high loading and low temperatures should be avoided during operation. The main concern in case of precipitation was blocking of heat exchangers. The lab results were considered when operating the plant for parametric testing and during periods with standstill while the solvent was stored in the plant. The density measured on both lean and rich solvent flows could give indications of loading and the changes in density were monitored during the campaign.
Precipitation in absorber packing and mitigating actions
During phase A, the differential pressure in the lower absorber packing increased, as shown in Figure 9. The measured differential pressure is compared to a theoretical value for a given flue gas and solvent flow rate based on previous TCM experimental data. Lean solvent samples were analyzed for amine concentration and the amount of amine in the plant was calculated. The decrease in amines indicated that solvent was lost from the process and the plant was thoroughly checked for leakage without any findings. In the majority of the cases, the amount of amine in the plant is decreasing with increasing differential pressure, most significantly during phase B (98% capture rate). The increased differential pressure was then suspected to be caused by precipitation in the lower absorber packing. Phase B was followed by repetition of cases from phase A with higher solvent flow and lower capture rate than phase B, resulting in a decrease in the differential pressure. A mitigating actions test (MitAct in Figure 9) was done at higher solvent flow rate with increased lean solvent and flue gas temperatures to investigate if the differential pressure could be further reduced. After the mitigating actions test, the B1 test was repeated to verify the impact on the amine mass. Solvent analysis confirmed a significant increase in the amine mass compared to B1 (at the start of phase B), indicating that the lost solvent was precipitation that had been dissolved. As the differential pressure was still higher than the theoretically expected value, a long flushing without flue gas flow to the absorber was done. After the flushing, the differential pressure was back to the theoretically expected value and the amount of amine in the plant back to similar value as at the start of the campaign. It has been calculated that 5.7 tons of amines were precipitated at the end of phase B. This corresponds to roughly 29% of the total amine mass. In order to reduce the risk of precipitation in the absorber, the rest of the planned tests were operated at 40 °C flue gas inlet temperature. It can be observed that there is no differential pressure increase during the first InsVal (Instrument Validation) test, which was also operated with 40 °C flue gas inlet temperature.
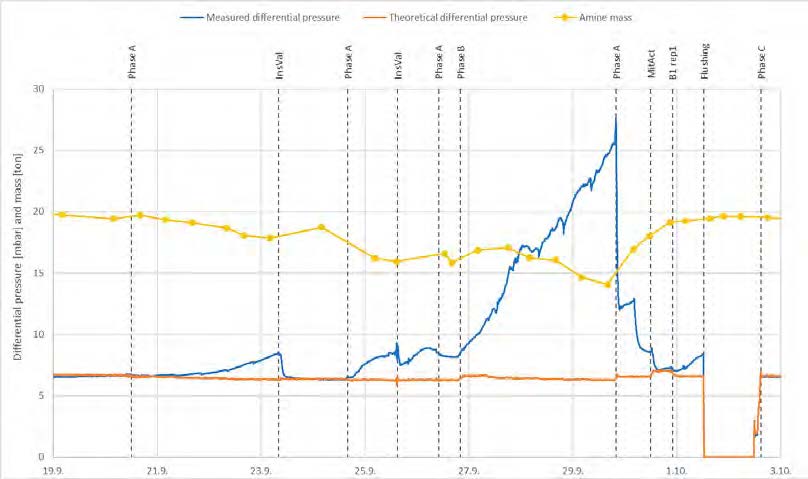
Figure 9. Total amine mass in the plant (yellow), measured (blue) and theoretical (orange) differential pressure in the lower absorber packing.
The density of the solvent, measured on lean and rich flow, did not indicate that precipitation should have been occurring during these initial phases. It is suspected that local differences in loading and temperature in the absorber can give local precipitation. Monitoring of the differential pressure in the absorber packing is recommended. Precipitation is believed to be caused by PZ. However, both AMP and PZ seem to precipitate as their ratio was kept constant during the precipitation periods.
4. Conclusions
The ALIGN-CCUS test campaign was the first TCM test campaign with CESAR1 solvent. The main objective of the campaign was to assess the performance of the solvent in terms of energy demand, emissions and solvent consumption. Some operational challenges have been experienced throughout the test campaign. The CESAR1 solvent is known to have better performance than MEA in terms of thermal energy and stability. This has been confirmed during this test campaign. The energy demand is lower by around 10% compared to 30 wt% MEA. However, the comparison is not straightforward. The MEA baseline was conducted before the rich bypass stream was implemented. In addition to the difference in amine concentration, PZ has two amine functions and can act as a promoter. The minimum flue gas temperature was 40°C with CESAR1 solvent because of precipitation at lower temperature in the absorber, while it was 30°C in MEA case. It was easy to reverse the precipitation by flushing the absorber with hot solvent at high flow rate, but this might be not optimal for a full-scale plant. The flue gas temperature strongly influences the steam consumption. It would be interesting to investigate mitigating actions to be able to lower the gas temperature. Although they were higher than in MEA case, the atmospheric amine emissions were kept low throughout the test campaign (below 1 ppmv). The high vapor pressure of AMP was the main cause of emissions. PZ emissions were found to be negligible with CCGT flue gas but could be strongly influenced by the presence of aerosols. The solvent consumption was found to be lower than MEA. The main loss comes from degradation. The PZ is very sensitive to NO2, it reacts to form nitrosamines. The nitrosamine concentration was high in the solvent but none of them were found in the absorber stack. The HSS concentration was kept low. The test campaign was successful and gave TCM valuable learnings.
Acknowledgements
The authors gratefully acknowledge the staff of TCM DA, Gassnova, Equinor, Shell and Total for their contribution and work at the TCM DA facility.
Acknowledgement ACT ALIGN-CCUS Project No 271501. This project has received funding from RVO (NL), FZJ/PtJ (DE), Gassnova (NO), UEFISCDI (RO), BEIS (UK) and is co-funded by the European Commission under the Horizon 2020 programme ACT, Grant Agreement No 691712 www.alignccus.eu.
References
- IEAGHG Technical Report 2019-09, Further Assessment of Emerging CO2 Capture Technologies for the Power Sector and their Potential to Reduce Costs
- Gjernes E, Pedersen S, Cents T, Watson G, Fostås BF, Shah MI, Lombardo G, Desvignes C, Flø NE, Morken AK, de Cazenove T, Faramarzi L, Hamborg ES. Results from 30 wt% MEA performance testing at the CO2 Technology Centre Mongstad. Energy Procedia, Volume 114, 2017, p 1146-1157.
- Shah MI, Lombardo G, Fostås B, Benquet C, Morken AK, de Cazenove T. CO2 capture from RFCC flue gas with 30 wt% MEA at Technology Centre Mongstad, process optimization and performance comparison. 14th Greenhouse Gas Control Technologies Conference Melbourne 21- 26 October 2018 (GHGT-14)
- Faramarzi L, Thimsen D, Hume S, Maxon A, Watson G, Pedersen S, Gjernes E, Fostås BF, Lombardo G, Cents T, Morken AK, Shah MI, de Cazenove T, Hamborg ES, Results from MEA Testing at the CO2 Technology Centre Mongstad: Verification of Baseline Results in 2015. Energy Procedia, Volume 114, 2017, p 1128-1145.
- IEA (2020), CCUS in Power, IEA, Paris https://www.iea.org/reports/ccus-in-power
- A.K. Morken, S. Pedersen, E.R. Kleppe, A. Wisthaler, K. Vernstad, Ø. Ullestad, N.E. Flø, L. Faramarzi, E. Steinseth Hamborg. Degradation and emission results of amine plant operations from MEA testing at the CO2 technology centre mongstad. Energy Procedia, 114 (2017), pp. 1245-1262
- Freeman, S.A., (PhD thesis). Thermal Degradation and Oxidation of Aqueous Piperazine for Carbon Dioxide Capture 2011. University of Texas at Austin.
- S.A. Mazari et al. 2014. Degradation study of piperazine, its blends and structural analogs for CO2 capture: A review. Int. J. Greenh. Gas Control 31, 214–228.
- Gouedard, C., et al., 2012. Amine degradation in CO2 capture. I. A review. Int. J. Greenh. Gas Control 10, 244.
- Languille B, Drageset A, Mikoviny T, Zardin E, Benquet C, Ullestad Ø, Aronson M, Kleppe ER, Wisthaler A. Atmospheric emissions of amino-methyl-propanol, piperazine and their degradation products during the 2019-20 ALIGN-CCUS campaign at the Technology Centre Mongstad. 15th International Conference on Greenhouse Gas Control Technologies Conference, 15th-18th March 2021 Abu Dhabi (GHGT-15).
Pending acceptation
- Gorset O, Knudsen JN, Bade OM, Askestad I. Results from testing of Aker Solutions advanced amine solvents at CO2 Technology Centre Mongstad, Energy Procedia, 63, 2014, 6267 – 6280