
9. CO2 Capture and work environmental sampling at TCM - lessons learned (2021)
Alexander Reyes-Lingjerdea, Hans Thore Smedboldb, Audun Drageseta, Alexander Hålandd, Anne Kolstad Morkenc, Eirik Romslo Kleppea, Øyvind Ullestadac, Odd Arne Hvidstenac
aTechnology Centre Mongstad, 5954 Mongstad, Norway b Proactima AS, Richard Johnsens gate 4, 4021 Stavanger, Norway cEquinor ASA, Litlåsvegen 208, 5954 Mongstad, Norway dDepartment of Chemistry, University of Oslo, Sem Sælamds vei 26, 0371 Oslo, Norway

Abstract

With almost a decade of operational experience from an amine-based post combustion carbon capture plant in Norway, Technology Centre Mongstad has under multiple occasions and operating scenarios monitored the work environment exposure risk for such facilities. Primary focus has been on concentrations of Nitrosodimethylamine in the work environmental atmosphere. This paper presents some findings from work environmental gas sapling collected between 2012 and 2020, where Thermosorb-N filters, impingers and PTR-MS were used for sampling. The main objective has been to investigate work environment exposure risk in a CO2 capture plant. The findings show that the median outdoor background concentration during the different test campaigns have been 0.2 ng/m3 (Arithmetic Mean 5.8 ng/m3, range <0.01 – 39 ng/m3). The average and maximum concentration represents 3% and 20% of the given Occupational Exposure Limit Value of 200 ng/m3 for NDMA, respectively. Our results suggest that Nitrosodimethylamine can be present at an amine-based CO2-capture test plant, but at acceptable concentrations. In conclusion, the design and operational conditions at Technology Centre Mongstad maintain exposure background levels for the working atmosphere at a satisfactory level.
1. Introduction
Technology Centre Mongstad (TCM) is one of the world’s largest and most flexible test centers for post combustion carbon capture technologies and is located next to the Equinor refinery in the western part of Norway. The refinery supplies two types of flue gases to TCM, using the Combined Cycle Gas Turbine (CCGT) based heat and power plant (CHP) and Residue fluid catalytic cracker (RFCC). The owners of TCM have conducted several non-proprietary test activities (often referred to as campaigns) especially on Monoethanolamine (MEA). In 2019 CESAR 1 solvent was introduced as a non-proprietary solvent. CESAR 1 is an aqueous amine solvent composed of AMP (2-Amino-2- methylpropan-1-ol) and PZ (piperazine).
The large number of participants from public sector, industrial, research and academic institutions involved in different test activities at TCM have provided new knowledge regarding CO2 capture and potential work environment exposure in an amine-based CO2 capture facility. Such data can be useful as background input before deployment of full-scale post-combustion capture (PCC).
Chemical exposure is considered one of the major work environmental risks for personnel at TCM. Therefore, risk assessments, classification and monitoring of chemical exposure is an important topic for TCM. During more than 7 years of operation, the Health Safety and Environmental Department (HSE) has identified several areas eligible for improvement regarding chemical exposure and chemical management. The risks are mainly related to use of the amine solvent and subsequent degradation products.
The CO2 absorption process based on amine technology is often described as a closed process. However, there are locations and operation from where amines and related degradation components can be released into the atmosphere. The amine absorption tower and CO2-stack are continuously emitting low quantities of amines and degradation components. TCM is required to have full control over these emissions. However, they can constitute a potential exposure source for personnel in close surroundings. Other areas of concern might be diffuse emission spots e.g. sumps, ventilation systems, liquid sampling cabinets and instruments.
1.1 Amines and degradation components
In general, the main solvent in the CO2 capture process consists of one or a mixture of amines. In addition to carbon dioxide (CO2) and water the flue gas also contains Oxygen (O2), Nitrogen Oxides (NOx) and Sulphur Oxides (SOx), but in lower quantities. Carbamate is formed when the amine is exposed to CO2, this is a reversible reaction utilized in the capture process. However, the contaminants in the flue gas result in unwanted side products (degradation products) when reacting with the amine solvent. In particular, reaction with NOx will form nitrosamines, especially NO2, while the oxidative degradation for MEA will result in aldehydes, which are components of high environmental and health concerns. This degradation process is described in more detail in Morken et al [3].
At the start-up of TCM, the Norwegian Institute of Public Health (NIPH) published a report regarding health effects of amines and its derivatives. The report recommends limit exposure levels for the population to ensure a minimal or negligible risk of cancer. Calculated risk (level for cancer of 1 in 10-6 after lifelong exposure) for N- Nitrosodimethylamine (NDMA) should be applied to the total amount of nitrosamines and nitramines. The total amount of nitrosamines and nitramines shall not exceed 0.3 ng/m3 in air and 4.0 ng/L in water [1].
The Norwegian Labour Inspection Authority (NLIA) have not established specific Occupational Exposure Limit Values (OELV) for NDMA. Equinor is a responsible operator for TCM and was included in the pre-work for a full- scale plant at Mongstad. In collaboration with key personnel from the pre-work, physicians, and occupational hygienist at TCM it was established that TCM as the only CO2-facility in Norway should adopt the health based calculated occupational cancer risk (4 x 10⁻⁵, for 40 years of exposure to 0.2 x 10⁻² mg/m3) values from Netherlands of 200 ng/m3[5].
Among known CO2-capture related components, piperazine (amine), formaldehyde and NDMA are components of very high concern due to their inherent properties. In addition, piperazine, formaldehyde and NDMA are the components with the lowest OELVs to workers (Table 1). Formaldehyde is classified to be toxic, a skin sensitizer, mutagenic and a carcinogenic component. Piperazine is classified as skin corrosive, and may cause allergic skin reactions, asthmatic symptoms or breathing difficulties if inhaled, and is also suspected to damage fertility. NDMA is considered as acute toxic, both swallowed and inhaled, carcinogenic, and may damage specific organs [8]
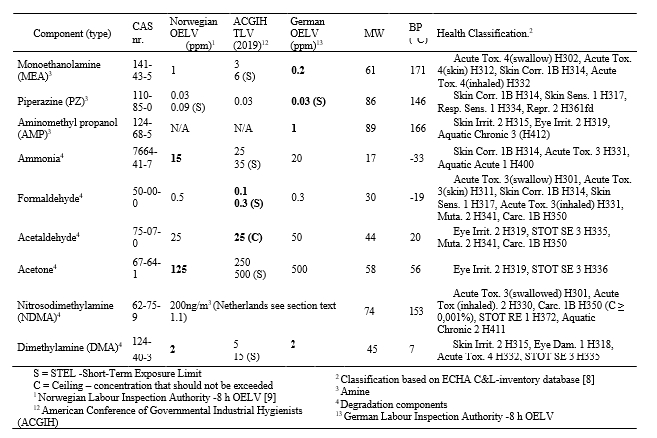
Table 1. Inherent properties of amines, ammonia, formaldehyde, acetaldehyde and acetone.
Determination of airborne nitrosamines has been prone to artefact formation (false positives) if solid sorbents are used, and in case of sample loss. The use of Thermosorb-N cartridges is a simple and credible method that has overcome this problem due to filters with an amine trap system. Linearity and controlled sampling tests have demonstrated that Thermosorb-N air samplers can be precise at low concentrations (25 ng) [2]. However, data on amine-concentration levels obtained at TCM are lower than the tests results described in the technical document [2]. Consequently, some of the initial Thermosorb-N filter analyses detected positive results at plant locations where it was not expected to be found nitrosamines. The credibility of these low quantity results was questioned.
Therefore, in collaboration with SINTEF, TCM introduced a midget impinger (25 ml) as an improved analysing method in 2016. In addition to nitrosamines, the impinger system is also able to detect and quantify amines in the ambient air. However, impinger sampling is considerably more challenging and time consuming to perform and require more training for preparation and sampling compared to use of filters.
TCM represents one of the largest test facilities for CO2 capture worldwide. To our knowledge, data concerning work environmental exposure in such facilities have not previously been reported over this extended time period and covering a large amount of amine technologies. During different test periods between 2012-2020, TCM have investigated background concentrations of different harmful substances and especially nitrosamines.
The primary aim of this paper was to provide an overview of work environmental exposure over time, and specifically sampling of nitrosamine concentrations, during different CO2 capture test periods at TCM. The secondary aim was to provide future CO2 capture plants with specific information about expected background concentrations around an amine plant.
2. Method, analysis, and strategy
Data were collected between 2012-2020, inside the TCM premises. Both personnel (n = 35) and static (n = 35) sampling was performed. During personnel sampling, workers were equipped with a sampling medium placed within a 30 cm radius, corresponding to the breathing zone. Static sampling was performed by stationing a sampling setup at strategic locations. Workplace measurements were performed using filters, impingers and direct reading instruments. To gain a greater insight into measurement methods that can be used in connection with amine plant Azzi et al. describes the various measurements methods in more detail [15]. The methods described in Azzi et al. are more related to the amine stack and amine emission but are also be relevant for the work environment.
Static filter samples were taken inside the amine plant or in close proximity (n = 24), in addition to indoor samples (n = 11). The indoor samplers were taken to verify if indoor environment could be influenced by emissions from amine stack. The indoor samples were placed in the office building, which is the most elevated sampling location inside the TCM area, approximately 200 m from the amine plant. In addition, samples were taken from the laboratory inside the building that represents a working area where personnel open and analyse the solvent and its relevant components. The laboratory was included along with the other indoor samples, because is connected to the same mechanical ventilation system. By dividing the results, it is possible to determine if the laboratory concentrations differ from the rest.
The first 7 samples of Thermosorb-N filters in 2012 were analysed by the Ramboll laboratory, whereas most filters and impinger samples from 2013 and onwards were sent to SINTEF for analysis. SINTEF has been involved in amine- based CO2 capture technology for several years and perform numerous other analyses for TCM as well as degradation tests for many of the tests vendors before testing at TCM.
In collaboration with the University of Oslo (UiO), TCM have conducted investigations into ambient air concentrations close to the plant since start-up in 2012. UiO have performed method development and sampling with direct reading, Proton Transfer Reaction Mass Spectrometer (PTR-MS).
Multiple technology developers have utilized TCM’s capture plant as a CO2 test facility over the years, and TCM is committed to uphold all confidential agreements with those vendors. Samples collected during proprietary test campaigns are therefore masked as general samples without dates, non-proprietary data will be presented without limitations.
2.1 Thermosorb-N Filters
The principle behind active sampling is the use of a pump connected to a sampling medium through a hose (Figure 1). The medium can be either a filter, cartridge, tubes or impingers. TCM have used a SKC Sidekick pump connected to a Thermosorb-N filters and operated at approximately 2 L/min. The flow is controlled before, under and at the end of the measurements with the help of a rotameter. The average concentration is given in ng/m3. The filter tubes were prepared with magnesium silicate and an amine-trapping agent [6].
Figure 1. Sampling setup – from left sidekick pump connected to hose and filter. To right rotameter to measure flow (Photo: A. Reyes-Lingjerde).
According to SINTEF, to retrieve trapped Nitrosamines, the filters were eluted with MeOH/H2O (80/20). An internal standard consisting of isotope-label variants was added to ensure complete elution. The matrix was analysed with LC/MSMS, a liquid chromatography instrument coupled with a tandem mass spectrometer. The spectrometer is of type 6495 Triple Quadruple MS for quantification. The instrument limit of quantification (ILQ) is set to 0.05ng/mL for most nitrosamines, which is presented as <0.05 ng/cartridge in the obtained analysis results.
2.2 Impinger
With impinger it is possible to capture both amines and nitrosamines in the work atmosphere. The setup consists of three impingers in a series, where a pump draw gas through the three components. The impinger with sampling medium was stored in a compartment, filled with water and ice to maintain the temperature as close to 0°C as possible (Figure 2).
Figure 2. (a) Midget impinger setup used; (b) Picture of impinger setup (Illustration: A. Reyes-Lingjerde).
The principle behind impinger sampling is like filter sampling. The flow rate should ideally be 2.83 L/min according to Hinds, 1999 [7]. However, it was not possible to meet this flow rate with a SKC Sidekick. The maximum operational flow was 2.3 L/min. Capture medium for the amines was 0.1 M Sulphuric acid and 0.1 M Sulphamic acid for nitrosamines, respectively. As illustrated in Figure 3, the complexity of the sampling method, only allows static sampling.
2.3 Direct reading instruments
Measurement of background sampling of trace compounds for a longer period (1-2 weeks) was conducted by a Proton Transfer Reaction Time of Flight Mass Spectroscopy (PTR-TOF-MS). This is an instrument used for online monitoring of volatile organic compounds and can achieve a detection limit in the single pptV level. The sampling principle is described more detailed in Languille et al. (2020) [11].
2.4 Data processing and comparison
Our background data were compared with OELV’s from different sources (Table 1). Norwegian and German OELV’s as well as American TLV are presented in Table 1, where most conservative approach was selected as comparison level. For measurement data below the instrument quantification level (IQL) values has been substituted with IQL/√2 (2). The level of detection (LOD) and quantification (LOQ) of the filters was calculated as follows; LOD = (S.E mean)*α*β, where α=β and taken from a Student-t distribution, and LOQ = S.E mean *10 [10]. For statistical analysis of the data Microsoft Excel was used (Office 365). The data seem to be neither normal nor log- normal distributed. This is expected as the data were gathered over a longer period and during different campaigns with different amines. Data are therefore presented as both AM (Arithmetic Mean) and Median, together with
Maximum and Minimum values compared with OELV’s. Confidence interval is not presented due to unclear data distribution.
Our focus in this paper has been on background data from static samples inside TCM. Whereas some data from personnel sampling are also included, a more extensive presentation on this topic will be addressed in a future paper according to standard EN 689 [14].
3. Results
The presentation of the results is divided into three parts, 1) Testing of methods, 2) Background exposure at TCM- plant and 3) Personnel samples.
3.1 Testing methodes
The methodology testing includes results from blank filters, comparing old vs. new filters and exposure the Thermosorb-N filters to known NDMA concentrations.
3.1.1 Blank filters
In total 10 blank filters were analysed. In 50% of the filters NDMA was detected above the ILQ of 0.05 ng/cartridge, with an AM of 0.78 ng/cartridge (Table 2). This indicates possible artefacts at these low levels. The LOD and the LOQ of the method is estimated to be 1.0 and 2.9 ng/cartridge, respectively.
Table 2. Blank filter results. Results reported for filters with detected levels above IQL (n = 10).
| Nr. | Nr. (%) | AM | SD | Min | Max | LOD | LOQ |
| samples | <IQL | [ng/cartridge] | [ng/cartridge] | [ng/cartridge] | [ng/cartridge] | [ng/cartridge] | [ng/cartridge] |
| 10 | 5 (50%) | 0.78 | 0.96 | <0.05 | 2.33 | 1.02 | 2.90 |
3.1.2 Comparison of filters stored for a short and long time
A comparison was performed between filters stored for less than a month and filters older than 24 months. TCM personnel were wearing a parallel set of a new and old filter between 2-5 hours sampling, during normal workdays (Table 3). The work performed was representing a full shift day. Four samples were taken by 4 different operators. The results indicate an average difference of -19.5% and an average absolute average difference of 33%.
| Filter set | 1 | 2 | 3 | 4 |
| New (ng/m3) | 6.11 | 4.68 | 12.62 | 4.00 |
| Old (ng/m3) | 8.30 | 3.37 | 11.76 | 1.26 |
| %-difference | 26% | -28% | -7% | -69% |
| % avg. difference | -19.5% | |||
| % absolute avg. difference | 33% |
Table 3. Comparison of filters stored for a short (<2 years) and long time (>2 years)
3.1.3 Laboratory test with known concentrations
A test experiment was set up intended to study filters exposed to a known nitrosamine matrix. A standardised package of nitrosamines was retrieved from Sigma-Aldrich (EPA 8270). The package contains a 1mL ampule with a concentration of 2000µg/mL of each nitrosamine (including NDMA) diluted in methanol. The ampules were further diluted as following 345, 172.5, 69, 34.5, 17.3, 5.2 ng/mL.
For the experiment, the Thermosorb-N filters where first aligned on a test bench. A weighted funnel was attached to the filters inlet to function as an evaporation chamber for the nitrosamines. To the filter’s outlet, a pump was attached to pull ambient air through the filters. Aliquots of 1 µL from the dilutions were extracted by a micropipette and supplied to the Thermosorb-N filters via the weighing funnels coupled to the filter’s inlet (Figure 3).
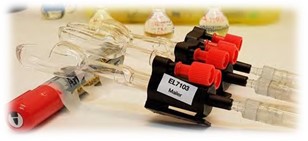
Figure 3. Setup for exposing Thermosorb-N filters for known concentrations of NDMA (Illustration: A. Reyes-Lingjerde).
The main objective with the experiment was to study exposed filters to a source known to contain NDMA. A total of 6 filters with 6 different concentrations was used in the experiment. The results are presented in Table 4 and shows deviations between the theoretical and analysed concentrations varying from -18% to 61%.
| Theoretical [ng/10mL] | Analyzed [ng/cartridge] | Δ% |
| 345.0 | 447.7 | 29.8 |
| 172.5 | 219.0 | 26.9 |
| 69.0 | 110.7 | 60.5 |
| 34.5 | 29.6 | -14.3 |
| 17.3 | 18.3 | 5.6 |
| 5.2 | 4.8 | -17.8 |
Table 4. Laboratory experiment, exposing individually Thermosorb-N filters and midget impingers (Sulfamic acid) series for six theoretical concentrations of NDMA.
3.2 Background exposure at TCM-plant
The background results are divided into two parts, 1) active sampling with filters and impingers and 2) PTR-MS direct reading instrument.
3.2.1 Filter and impinger
Results included 35 background samples, divided into outdoor and indoor concentrations, a total of 24 samples (20 filter and 4 impinger) and 11 samples (5 filter and 6 impinger), respectively (Table 5). The sampling time for all samples was between 1 and 5 hours (avg. 3 hours). The indoor results included 8 samples from inside the laboratory and 3 samples from the remaining building.
The median outdoor background concentrations during the different test campaigns were 0.2 ng/m3 (AM 5.8 ng/m3, range <0.01 ng/m3 – 39 ng/m3). The average and maximum concentration represents 3% and 20% of the given OELV of 200 ng/m3 for NDMA, respectively. Of all the 24 background measurements 2 samples were approximately 20% of the given OELV. Both samples were taken in close proximity to the analysis house. The remaining 22 samples were <9% of the given OELV.
The indoor median concentration for the whole building was 3.1 ng/m3 (AM 2.4 ng/m3, range <0.01 – 7.4 ng/m3). When separating laboratory samples from other parts of the building, the median was 2.1 ng/m3 (AM 2.3 ng/m3, range <0.01 – 6.2 ng/m3). The average and maximum concentration for all indoor samples was 1% and 4%, and for laboratory samples 1% and 3% of the given OELV, respectively.
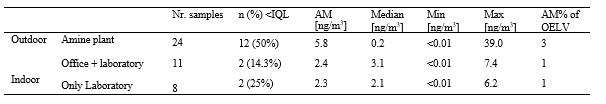
Table 5. Background concentration of NDMA around the TCM plant (number of samples = 35).
3.2.1 Direct reading sampling
From October 8th to 20th 2015 (non-proprietary MEA-campaign) direct reading measurements on air concentrations were carried out in close vicinity to the instrument house (online instruments measuring stack emissions with local instrument emission point) in the plant. NDMA was not detected, while MEA was found in very small quantities (AM 0.20 ppbV). The following degradation components were also detected at a very low concentration: Dimethylamine (DMA), Formaldehyde and Acetone (0.18 – 0.79 ppbV), and Acetaldehyde and Ammonia (2.42 – 14,12 ppbV). Such detection of degradation components is expected according to Morken et al [3]. The AM concentration of all the direct reading measurements was 0.4% or less than the given OELV’s (Table 6). Two task specific personnel samplings where performed during this period indicating presence of NDMA, 4.7 ng/m3 (0.002 ppb) and 11.4 ng/m3 (0.004 ppb).
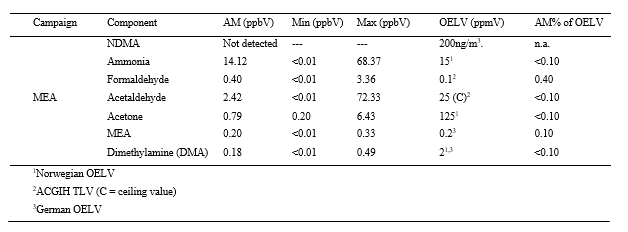
Table 6. Traced components during MEA-campaign, from 8th to 20th of October 2015 (continuous sampling with a PTR-TOF-MS instrument).
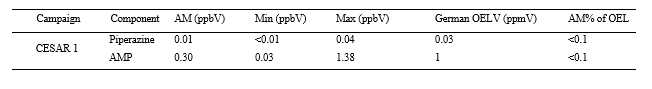
From January 13th to 17th 2020 (non-proprietary CESAR 1-campaign) direct reading measurements were carried out in the amine plant. NDMA was not detected, while Piperazine was found in very small quantities (AM 0.01 ppbV; range <0.01 – 0.04 ppbV) and AMP (AM 0.30 ppbV; range 0.03 – 1.28 ppbV) (Table 7). It was also possible to detect nitroso-piperazine (N-PZ) up to 6 pptV (28 ng/m3), but mostly below 4 pptV (19 ng/m3).
3.3 Personnel samples
Thirteen full shift samples were conducted with a sample time ranging from 4.5 to 6.5-hour. The median concentration was 3.4 ng/m3 (AM 3.8 ng/m3, range 0.8 – 10.7 ng/m3). The average and highest measured full shift exposure was 2% and 5% of the given OELV, respectively (Table 8). Task results are based on 22 samples, with 1 to 3-hour sampling time. The median concentration was 6.1 ng/m3 (AM 6.1 ng/m3, range <0.5 – 12.6 ng/m3). The average and highest measured full shift exposure was 3% and 6% of the given OELV, respectively.
| Nr. samples | n (%) <IQL | AM [ng/m3] | Median [ng/m3] | Min [ng/m3] | Max [ng/m3] | AM% of OELV | |
| Full shift | 13 | 0 (0.0%) | 3.8 | 3.4 | 0.8 | 10.7 | 2 |
| Task | 22 | 1 (4.5%) | 6.1 | 6.1 | <0.5 | 12.6 | 3 |
Table 8. Personal Thermosorb-N filter samples of NDMA at TCM (number of samples = 35)
4. Discussion
4.1 Main findings and significance
Our main findings show that NDMA can be present when amine-based CO2 capture tests are performed at TCM, however median and average background levels were generally present at low concentrations. These results demonstrate that background levels from TCM are in compliance with today’s OELV of 200 ng/m3. In fact, most of the measurements were below or in the same magnitude as the level of quantification.
The intention with the personnel sampling results in this article was to give a general indication on expected concentrations of NDMA. As the results show, the personnel sampling mean concentrations for full shift and task operations were 2% and 3% of the OELV, respectively. These preliminary findings suggest that direct personnel exposure was also low.
Of concern, two background NDMA samples were around ~20% of the given OELV. These samples were both taken close to the analysis facility, which probably explain this finding, as the analysis house is a diffuse emission point.
The first sampling period that included direct reading of air concentrations detected DMA but not NDMA. DMA could potentially form NDMA, which might explain why this was detected in two of the personnel samplings. However, most probably the NDMA found was related to task-based work. These two personnel task-based samples were performed during circumstances where evaporation from the solution is expected. Under such circumstances personnel always wear PPE. Detection of formaldehyde was also considered a factor of concern. The background concentrations were low compared to the OELV, but when personnel perform any risk-based tasks which can lead to direct exposure to the solvent, either physical or by inhalation, appropriate PPE and personal alarm instruments must be used.
Some of the samples during the second test period also identified very low background concentrations. With the direct reading measurements, NDMA air concentrations was not detected, while N-PZ was. When filter sampling was performed, the analysis indicated that NDMA was also present. It is important to emphasize that the Thermosorb-N sampling was performed at the end of an extended test campaign, which can explain the presence of nitrosamines as the solvent degrades over time. The source of the detected nitrosamine background levels can be questioned. Piperazine is not a naturally occurring amine. Detection of N-PZ in proximity to the amine plant most likely indicate that the background levels originate from the amine plant.
It is important to underline that even if the background concentrations found around an amine plant are low, all types of physical contact with the solvent must be avoided due to its inherent hazardous properties to human health. Personnel must be specifically trained to handle leakages, modifications and other tasks that can lead to contact with the solvent. Furthermore, personnel protective equipment (PPE) must be easily available, as well as personal alarm instruments to ensure that personnel have the possibility to detect amine related source of exposure.
To our knowledge, this is the first study that has examined work environment and exposure-risks at an amine-based carbon capture plant of such a magnitude and over a longer time period. In our opinion, the reported findings are reassuring with respect to possible health risks and the work atmosphere in the facility.
4.2 Methodological considerations
When analysing filters after testing, false positive was detected in 50% of the blanks. Even though the concentration were low, this indicates that filters may generate the very same artefacts they are designed to remove. These artefact formations probably represent a limitation for outdoor environment sampling when trying to compare Thermosorb-N filter samples with the recommended exposure levels for the population.
Normally, any “background noise” identified blank filters is subtracted from the findings in exposed filters. However, since 50% of the exposed filters showed values <IQL and the blank filters were analyzed over different test periods, we chose not to subtract such values. If this method had been applied, our study would been reported even lower mean concentrations. The calculated LOQ value for the sampling system (combination of analysis and filter) in this study is based on few measurements and should therefore be subject for further study.
The laboratory experiment exposing filters with known concentrations of amines was a pilot test and a relatively easy to reproduce. The presented results show that Thermosorb-N filters are reliable and can be used in work environment assessments. However, the experiment also illustrates the uncertainties at these low concentrations levels and additional tests should conducted even more precisely e.g. in accordance with Xiao Chen et al [6].
Sampling with old Thermosorb-N filters (stored more than 24 months) compared to new filters indicates a possible loss with an average difference of -20% (-69% to 26%) in the quantity of nitrosamines trapped. This could mean that less nitrosamines are captured on average with filters that has been stored over a longer time. However, it is difficult to evaluate by an only 4 parallel filter comparison and at these very low concentrations. When possible, similar test will be performed in future studies.
An important discovery during the CESAR 1 campaign (2019-2020), the nitrosamine N-PZ was detected by the direct reading instrument. However, when sampling with Thermosorb-N filters during the same period SINTEF couldn’t manage to extract any N-PZ. This discovery shows that it is important to determine which components can be trapped by different sampling methods and at which concentrations.
To strengthen sampling methods and results in the future, TCM have initiated a study suggesting more tests comparing filter with impingers, filter with PTR-TOF-MS, and the use of different adsorbents in impingers. The purpose of comparing measurement methods is to demonstrate difference between the methods and be able to give an assessment of what is the “golden” standard method to use for sampling nitrosamines. In addition, TCM have plans to sample in near surroundings (200-1000m radius). Such data are of interest to understand the background levels in a wider perspective which is relevant for both the work and external environment.
4.3 Conclusions
Our findings demonstrate that the risk of exposure to NDMA in a facility such as TCM is very low when amine- based CO2 capture tests are performed. The required conditions TCM operates at and the design of the plant appears to maintain exposure background levels in the working atmosphere down to a satisfactory level, compared with todays recommended OELV for nitrosamines. Still, low concentrations detected inside the office building indicate that NDMA can be present. It is therefore important to study this further and determine if such findings are related to the location of the facility and/or ventilation system, and if the source is the absorber tower or ground concentrations.
Future research should focus on developing improved methods to identify low concentrations of potentially harmful substances in relation to amine-based CO2 capture plants
Acknowledgments
The authors gratefully acknowledge the staff of TCM DA, Gassnova, Equinor, Shell and Total for their contribution and work at the TCM DA facility. The authors also gratefully acknowledge Gassnova, Equinor, Shell, and Total as the owners of TCM DA for their financial support and contributions.
References
- Låg M, Lindeman B, Instanes C, Brunborg G, Scwarze P. (2011). Health effects of amines and derivatives associated with CO2 capture. Folkehelseinstituttet (Norwegian Institute of Public Health), April 2011, p.30.
- Thermosorb-N Air Sampling Cartridges, Ellutia Chromatography Solutions
- Morken A.K, Pedersen S, Romslo E.K, Wisthaler A, Vernestad K, Ullestad Ø, Flø N.E, Faramarzi L, Hamborg E.S. (2016). Degradation and Emission Results of Amine Plant Operations from MEA Testing at the CO2 Technology Centre Mongstad.
- Zhu L, Mikoviny T, Wisthaler A, Nielsen C (2015). TCM Ambient Air Measurement. University of Oslo (Unpublished)
- Committee of the Health Council of the Netherlands, December 1999. N-Nitrosodimethylamine (NDMA) Health based calculated occupational cancer risk values.
- Reunbehler D.P, Reisch J.W, Fine D.H. (1980). Nitrosamine Air Sampling Using a New Artifact-Resistant Solid Sorbent System.
- Hinds W. C. (1999). Aerosol Technology, Properties, Behaviour, and Measurement of Airborne Particles (second edition, pp. 226-227). John Wiley & Sons, Inc.
- European Chemical Agency. (2019.11.28). C&L Inventory. https://echa.europa.eu/information-on-chemicals/cl- inventory-database
- Norwegian Labour Inspection Authority. (2019.11.28). Regulations concerning action and limit values for physical and chemical agents in the working environment and classified biological agents 2020, S.I.No.FOR-2011- 12-06-1358, Norwegian Labour Inspection Authority. https://www.arbeidstilsynet.no/globalassets/regelverkspdfer/forskrift-om-tiltaks–og-grenseverdier
- Eurachem. 2014. Eurachem Guide: The Fitness for Purpose of Analytical Methods – a Laboratory Guide to Method Validation and Related Topics. 2nd ed., edited by B. Magnusson and U. Örnemark.
- Languille B, Drageset A, Mikoviny T, Zardin E, Benquet C, Ullestad Ø, Aronson M, Romslo E, Wisthaler A. (2020). Best practice for measurement of 2-amino-2-methyl-1-propanol, piperazine and their degradation products in amine plant emissions.
- American Conference of Governmental Industrial Hygienists (ACGIH) (2019). Threshold Limit Values and Biological Exposure Indices.
- Institut für Arbeitsschutz der Deutschen Gesetzlichen Unfallversicherung. (2019.11.28). GESTIS International Limit Values. https://limitvalue.ifa.dguv.de
- Comite Europeen de Normalisation (CEN) (2019). Workplace exposure – Measurement of exposure by inhalation to chemical agents – Strategy for testing compliance with occupational exposure limit values, EN 689.
- Azzi M, Day S, French D, Halliburton B, Jackson P, Lavrencic S, Riley K, Tibbett A (2010). CO2 Capture Mongstad – Project A – Establishing sampling and analytical procedures for potentially harmful components from post-combustion amine based CO2 capture.